Abstract
Measures of regional brain volumes, which can be derived from magnetic resonance imaging (MRI) images by dividing a brain into its constituent parts, can be used as structural indicators of many different neuroanatomical diseases and disorders, including alcoholism. Reducing the time and cost required for brain segmentation would greatly facilitate both clinical and research endeavors. In the present study, we compared two segmentation methods to measure brain volumes in alcoholic and nonalcoholic control subjects: 1) an automated system (FreeSurfer) and 2) a semi-automated, supervised system (Cardviews, developed by the Center for Morphometric Analysis [CMA] at Massachusetts General Hospital), which requires extensive staff and oversight. The participants included 32 abstinent alcoholics (19 women) and 37 demographically matched, nonalcoholic controls (17 women). Brain scans were acquired in a 3 Tesla MRI scanner. The FreeSurfer and CMA methods showed good agreement for the lateral ventricles, cerebral white matter, caudate, and thalamus. In general, the larger the brain structure, the closer the agreement between the methods, except for the cerebral cortex, which showed large between-method differences. However, several other discrepancies existed between the FreeSurfer and CMA volume measures of alcoholics’ brains. The CMA volumes, but not FreeSurfer, demonstrated that the thalamus, caudate, and putamen were significantly smaller in male alcoholics as compared with male controls. Additionally, the hippocampus was significantly smaller in alcoholic women compared with women controls. In general, correlation between methods was lowest in male alcoholic subjects, who also showed the greatest abnormalities. These results suggest that although many brain structures can be segmented reliably by CMA and FreeSurfer, low correlations between methods in some regions may be due to morphological changes in the brains of alcoholics.
Keywords:
Introduction
Brain morphometry is the study of neuroanatomical structures with the use of volumetric analyses. Previous studies have demonstrated that brain morphometry abnormalities can be used as an indicator of specific neurological conditions.Citation1–Citation4 For example, alcoholism is associated with widespread brain changes, as well as concomitant cognitive, emotional, and motivational dysfunction.Citation5–Citation7
Early forays into brain volumetrics required labor-intensive efforts for regional segmentation of the brain into specific structural or functional subunits. As a result, manual efforts to label brain structures have often relied on a variety of information, including magnetic resonance imaging (MRI) image signal and knowledge-based neuroanatomical contouring.Citation8 Accurate and reliable brain morphometry is challenging because it requires many anatomical markers, as well as additional information that cannot be obtained from MRI image intensities alone, since MRI image intensities often overlap between adjacent regions of the brain.Citation4 Image inhomogeneity within MRI scans caused by factors such as a nonuniform magnetic field can also greatly complicate volumetric analyses.Citation9–Citation11
A semiautomated, supervised systemCitation12,Citation13 was developed by the Center for Morphometric Analysis (CMA) at the Massachusetts General Hospital (MGH), Boston, MA. The semiautomated CMA system increases efficiency of segmentation by utilizing advanced computer software, along with a human expert, to segment structures. Although this supervised CMA system is reliable and accurate, it requires one day to fully segment the brain and also requires extensive staff and oversight. This makes such a method limited for high-throughput brain image processing for research analyses and clinical applications.
In contrast to the CMA system, the automated system known as FreeSurfer, developed by researchers at the Athinoula A. Martinos Center at MGH,Citation4,Citation14 requires only minimally supervised computer computational analysis (using an Intel Xeon 3.0 GHz processor) for volumetric segmentation. Moreover, multiple reconstructions and segmentations can be executed simultaneously on multicore processors.Citation14 FreeSurfer uses a probabilistic atlas of spatial information to assign neuroanatomical labels to arbitrary voxels in a raw image, independent of a subject’s position, orientation, or head shape. More specifically, the probabilistic atlas, which was compiled from brains segmented by the CMA, contains spatial information on the prior probability of a given tissue class occurring at a specific atlas location, the likelihood of an image intensity occurring in a given tissue class, and the probability of the local spatial configuration of labels given that tissue class.Citation4 FreeSurfer is minimally labor-intensive and efficient at rapid segmentation and parcellation. The program is also well documented and accessible for free download online.Citation14
Brain volumetrics is often used to examine changes in the brains of elderly people or of individuals who may show morphological changes associated with neurological disorders. The ability to accurately segment the brain despite morphological irregularities would be a crucial attribute for any automated system, such as FreeSurfer, that is used in studying variabilities in brain morphometrics. Although previous studies have used FreeSurfer with older and diseased subjects,Citation2,Citation15,Citation16 none has compared the two methods systematically. In the present study, we used two different morphological segmentation methods to examine brain volumetric differences between alcoholics and nonalcoholic control subjects. We also examined gender differences in the brains of these groups, because of known differences in the neurobiological effects of alcoholism in men and women.Citation17–Citation19
Materials and methods
Subjects
Four groups of subjects participated in this study (): 13 male alcoholics (MALC), 19 female alcoholics (FALC), 20 male nonalcoholic control subjects (MNC), and 17 female nonalcoholic control subjects (FNC). All of the subjects were right-handed, native English-speaking individuals with comparable demographic backgrounds. The subjects were recruited from newspaper and online advertisements and from flyers posted at Boston University School of Medicine, the Boston Veterans Affairs (VA) Healthcare System, and other nearby sites. Subjects were initially prescreened by telephone for identifiers such as age, level of education, health history, and history of alcohol and drug use. Potentially eligible individuals were then screened at the laboratory after written informed consent was obtained. Neuropsychological evaluations were performed and usually required between 5 and 7 hours of testing over a minimum of 1–2 days. The alcoholic subjects met Diagnostic and Statistical Manual, 4th edition (DSM-IV) criteria for alcohol abuse or dependence for at least 5 years, and they had abstained from alcohol use for at least 4 weeks prior to testing. Participants were excluded if any source indicated that they displayed any of the following conditions: neurological dysfunction (eg, seizures unrelated to alcohol withdrawal), electroconvulsive therapy, major psychiatric disease (eg, schizophrenia), current poly-drug abuse, human immunodeficiency virus, severe hepatic disease, history of serious learning disability or dyslexia, or an uncorrected vision or hearing problem, or if the individual had a pacemaker, surgical metal clips, implants, or possible internal metal. Participants were reimbursed for time and travel expenses. This study was approved by the Institutional Review Boards of the participating institutions.
Table 1 Demographic and clinical subject data
Heavy drinking was quantified as greater than 21 drinks per week (one drink: 355 mL beer, 148 mL wine, or 44 mL hard liquor). A quantity frequency index (QFI), which factors the amount, type, and frequency of alcoholic usage over the last 6 months for the nonalcoholic subjects, and over the last 6 months before sobriety for the alcoholic subjects, was calculated for each subject.Citation20,Citation21 The QFI was computed according to 1) a weight assigned to the number of days in which alcohol is consumed (1 = every day; .5 = every other day; .14 every seventh day, etc) and 2) the amount of alcohol consumed (as determined for beer + wine + distilled spirits). The MALC group had a QFI of 13.3 ± 10.9 (mean ± standard deviation) and had been sober for 21 days to 26 years. The FALC group had a QFI of 6.1 ± 5.3 and had been sober for 42 days to 30 years. The MNC group had a QFI of 0.1 ± 0.3, and the FNC group had a QFI of 0.4 ± 0.0 (). The MALC and FALC groups were evenly distributed for short and long durations of abstinence. All alcoholic participants met DSM-IV criteriaCitation22 for alcohol abuse and dependence for a period of at least 5 years, and all but one had been abstinent for at least 4 weeks prior to testing.
MRI acquisition
MRI scans were obtained at MGH on a Siemens 3-Tesla Trio scanner (Siemens Medical Solutions USA, Inc, Malvern, PA). Two eight-minute high-resolution T1-weighted magnetization prepared rapid gradient echo (MP-RAGE) series were acquired for volumetric analysis (repetition time = 2530 ms, echo time = 3.31 ms, inversion time = 1100 ms, flip angle = 7°, field of view = 256 mm, slice thickness = 1.33 mm, number of slices = 128 contiguous, sagittal images of the entire brain with in-plane resolution 1 mm × 1 mm). The two MP-RAGE series were averaged to improve signal to noise ratio while maintaining shorter individual scan duration and then resliced into a standard coronal three-dimensional brain coordinate system before being reformatted to standard spatial orientation, but not rescaled in size.Citation23
MRI morphometric analysis
Image analysis followed both the semiautomated, supervised procedures developed by the CMACitation24–Citation26 and the automated FreeSurfer system.Citation4,Citation27 For the semiautomated CMA procedure, gray matter, white matter, and ventricles were segmented on T1-weighted images using a computer-assisted approach, and gray matter was then divided into cortical and subcortical components.Citation8,Citation27 Brain segmentation was carried out by an experienced research assistant in the CMA with training in neuroanatomy, and supervised by a neuroanatomist. Segmentation of certain structures, such as the hippocampus and amygdala, followed strict procedures involving image intensities and the locations of other structures, such as the ventricles and cortical sulci. High inter-rater and intra-rater reliability of the CMA methods have been established previously,Citation28,Citation29 and blindness of group assignment was maintained throughout the analyses to prevent bias.
FreeSurfer (version 3) was used for the automated volumetric measures of various brain structures. FreeSurfer can automatically segment, parcellate, and label up to 40 unique structures, including many structures in the subcortical regions of interest,Citation4,Citation16 assigning a neuroanatomical label to each voxel in an MRI volume based on probabilistic information automatically estimated from a manually labeled training set. Briefly, FreeSurfer is executed by morphing the image into a Talairach space, by normalizing the white matter intensities of the original image, and by skull-stripping. The label of a particular voxel is determined from algorithms based on collected probabilities of image intensities and structure location using a Bayesian prior based on the maximum a posteriori probability.Citation4,Citation16 FreeSurfer outputs were reviewed by an experienced research assistant with training in neuroanatomy. An example of the results of both methods is shown in .
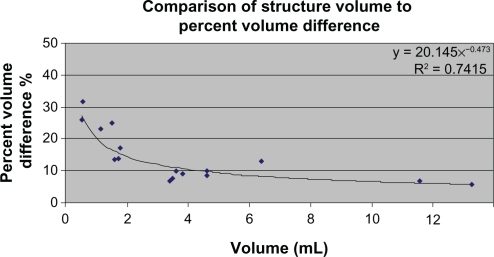
Figure 1 The comparison of the mean volume of brain structures to their absolute PCVD. The mean volume of brain structures was determined as the average of CMA and FreeSurfer volumetric measurements for all subjects.
For this study, the following regions were segmented and analyzed bilaterally: cerebral cortex, cerebral white matter, lateral ventricles, thalamus, hippocampus, amygdala, caudate nucleus (head and body), putamen, pallidum, and the nucleus accumbens area. We did not do a comparison of cortical parcellation between methods, which involves dividing the cerebral cortex into anatomically discrete regions such as cingulum, dorsolateral prefrontal cortex, etc.
Statistical methods
The volumes obtained from the CMA and FreeSurfer methods were converted to a common metric unit (mL). For each region, the intraclass correlation coefficients (ICC) and the 95% confidence intervals for the consistency of volumes were calculated.Citation30,Citation31 Inter-method difference was estimated by comparing the average of the per-subject difference in volume between the methods to the hypothetical assumption that the average of the differences equaled zero by way of a two-tailed, one-sample t-test. Furthermore, the percent common volume difference (PCVD) (Equation 2)Citation4 was calculated to compare the relative measurement difference between regions. The PCVD expresses the difference in volumes as a ratio to the mean of the volumes (the mean was used since the true structure volume is unknown). In raw form, the PCVD indicates directional difference. In its absolute form (ie, the absolute value of the difference divided by the mean), the PCVD can be used to examine overall “noise” among measurements. The volume difference was plotted against the volume mean to examine method-based differences in relation to the magnitude of the measurement and formally tested by the correlation coefficient.Citation32
Subject group/gender specific method-based differences in the PCVD related to between-subjects effects were examined by ANOVA with group, gender, and their interaction as the effects of interest. Familywise error for multiple comparisons within the interaction term was controlled by the Tukey honestly significant difference procedure. These analyses were repeated with the absolute PCVD.
As an example of the implications of the level of agreement between the methods, a more formal analysis of the raw, unscaled volumes from each method was compared by ANOVA with group, gender, and their interaction as the effects of interest. Covariates such as age were not included, as their effect was assumed to be common between methods. The comparability of the results of the analysis applied to both image analysis methods is described. A subset of regions was selected based on: high ICC and no between-subject group/gender differences (caudate nucleus); high ICC with between-subject group/gender differences (cerebral white matter); low ICC with no between-subject group/gender differences (cerebral cortex); and low ICC with between-subject group/gender differences (hippocampus) (see and ).
Table 2 Common mean volume of structures across both methods (in mL) for 69 pairs of volume estimates, along with per-subject differences from the common mean (in volume and percentage volume)
Table 3 Average PCVD between the methods in directional (top) and absolute (bottom) terms (see text for details)
Analyses were carried out using SPSS (Version 16.0; SPSS Inc, Chicago, IL), JMP (Version 8.0.2, SAS Institute Inc., Cary, NC), and Microsoft Excel (Version 2003; Microsoft, Redmond, WA).
Results
Intraclass correlation coefficient and method comparison analysis
Of the 20 regions analyzed (10 per hemisphere), eight had between-methods ICC ≥ 0.75. These were the left and right lateral ventricles, cerebral white matter, caudate, and thalamus (see ). Eight regions had 0.75 > ICC > 0.50. These were the left and right hippocampus, amygdala, putamen, left pallidum, and left cerebral cortex. The remaining regions included the right pallidum (ICC = 0.48) and right cerebral cortex (ICC = 0.47) and the nucleus accumbens area, which at 0.5 mL was the smallest region considered, with ICC less than 0.3.
Eight of the regions showed the CMA estimate to have a larger volume than the FreeSurfer estimate (see ). Six of these regions showed the difference to be more than 10% of the mean volume of the structure: the left and right cerebral cortex differed by more than 60 mL (26.0% and 25.4% respectively), the left and right thalamus differed by less than 1 mL (11.2% and 12%), and the left and right nucleus accumbens area differed by less than 0.1 mL (17.1% and 13.1%). The left and right cerebral white matter differed by 16.3 mL (7.6%) and 14 mL (6.5%), respectively.
Four of the regions (all small regions with differences of 0.3 mL or less) showed the FreeSurfer estimate to have larger volume than the CMA estimate. The left pallidum differed by 0.3 mL (15.1%), the right pallidum differed by 0.2 mL (10.9%), the right amygdala differed by 0.1 mL (6.2%), and the left putamen differed by 0.2 mL (3.4%).
Correlations between the mean volume difference and the mean volume of the region indicated that in only three regions was there a trend for the volume difference to be related to the volume of the structure: left amygdala (r(69) = +0.27, P = 0.03), left pallidum (r(69) = −0.26, P = 0.03), and right pallidum (r(69) = −0.24, P = 0.05). Across regions, however, the trend is for the percentage common voxel difference (PCVD) to vary inversely with the average size of the structure, such that the PCVD decreases as the structure size increases. Excluding the cerebral cortex and white matter, there was a decreasing absolute PCVD as size increased (see ). This indicates that, with the exception of the cerebral cortex (which is a large region that also had large inter-method differences), for discrete subcortical neuroanatomical structures, the larger the brain structure, the better the agreement between the CMA and FreeSurfer measurements.
Comparison of group/gender differences between methods
The analysis of PCVD and absolute PCVD (between-method difference) by group and gender indicated significant interaction effects for the left and right cerebral white matter, hippocampus, putamen, nucleus accumbens area, and right pallidum (see ). In virtually all cases, the volumes of the male alcoholics (MALC) were estimated with significantly more between-method difference than the male controls (MNC). Exceptions were the absolute PCVD for the right cerebral white matter, where there was a significant interaction, but the mean difference between MALC and MNC (5.9 mL) did not meet the corrected significance level (95% confidence level for the difference: −0.6–12.4 mL). In the left hippocampus, the between-method difference (PCVD and absolute PCVD) was significantly greater in the MALC than in both the MNC and female groups. The significance in the putamen was restricted to the absolute PCVD. And in the right accumbens area, the between-method difference was greater in the MALC than in MNC and females. However, the opposite effect was seen in the right pallidum, where the MNC had greater PCVD than the MALC (a trend that was not seen in the left pallidum, where the alcoholics as a group had higher PCVD than the control group). Alcoholic men produced the lowest correlations between methods among the groups. For example, in the right thalamus, alcoholic men had a slope of 0.277 and an R2 value of 0.05, which was a far worse inter-method correlation than for alcoholic women (slope of 1.080 and an R2 value of 0.70), control women (m = 0.898 and R2 = 0.68), and control men (m = 0.678 and R2 = 0.67). Across all subjects, an inter-method slope of 0.733 and an R2 value of 0.57 were found, demonstrating the extent to which relatively strong correlations in the female groups and the male controls could have masked the weak correlations in the alcoholic men.
In addition, although there is significant overall between-method difference in the estimates of the cerebral cortex (>25%), this difference tended to be higher in females than in males. This trend is also seen in the right lateral ventricle, where the PCVDs are positive for the females, but negative (or near zero) for the males. Other significant main effects were seen for the thalamus, amygdala, and caudate, but are less interpretable in the absence of overall significance of the ANOVA.
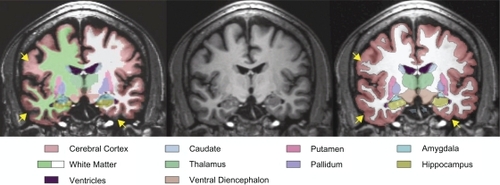
The ICCs and method-based difference present in the cerebral cortex and cerebral white matter are of special note. Using images taken from one of our male alcoholic participants that had large inter-method cerebral cortex volume difference as an example (see ), it can be seen that there were overt differences between the CMA and FreeSurfer estimates of the extent of the white matter into cortical gyri and the extent of the exterior cortical ribbon boundary. In conjunction with the results reported above, the subcortical structures as well as the cortex and white matter boundaries may be more heterogeneous in male alcoholics, which could lead to a higher susceptibility to variance by an automated segmentation system, compared with a supervised one.
Figure 2 Coronal MRI image from a male subject with alcoholism showing the results of segmentation from FreeSurfer (left) and CMA (right) in relation to a reference T1 image (center). Arrows (yellow) indicate regions of disagreement between FreeSurfer and CMA regarding the exterior boundary of the brain (lower arrows) and the extent of the white matter into the cortical gyri (upper arrow). There are also diffuse differences in the estimation of sulcal depth.
Implications for volumetric analysis
Analysis of the raw, unscaled volumes of the cerebral cortex (which had a low ICC and showed modest group/gender between-method differences) showed comparable results between the methods: left cerebral cortex F(3, 63) = 1.3 for CMA (P = 0.3) and 1.6 for FreeSurfer (P = 0.2), right cerebral cortex F(3, 63) = 1.0 for CMA (P = 0.4) and 1.9 for Free-Surfer (P = 0.15). Both methods showed a low-level (0.10 < P < 0.15) trend for subjects with alcoholism to have larger cortex volumes (11–14 mL) than normal controls.
Analysis of the cerebral white matter (which had a high ICC and showed greater between-method differences in MALC than MNC) also showed comparable results: left cerebral white matter F(3, 63) = 2.8 for CMA (P = 0.05) and 4.7 for FreeSurfer (P = 0.005); and right cerebral white matter F(3, 63) = 2.9 for CMA (P = 0.04) and 5.2 for FreeSurfer (P = 0.003). Each analysis also showed significant gender effects indicating the volume of white matter was higher (20–25 mL) in men than in women (P < 0.01 for all).
Analysis of the hippocampus (which had a low ICC and showed greater between-method difference in MALC than MNC) showed a significant group main effect, as well as group-by-gender interactions in the FreeSurfer volumes (left: F(3, 63) = 4.0, P = 0.01, interaction F = 9.1, P = 0.004; right: F(3, 63) = 5.9, P = 0.001, interaction F = 12.9, P ≥ 0.001) whereby MALC volumes were significantly (0.6 mL) smaller than MNC volumes. These trends were not observed in the CMA volumes, where there was only a modest gender effect (F = 2.5, P = 0.11) in the right hippocampus (0.2 mL smaller in women than in men).
Finally, analysis of the caudate volumes (which had a high ICC and no group/gender between-method differences) showed comparable nonsignificant effects between the methods: left caudate F(3, 63) = 0.8 for CMA (P = 0.5) and 1.1 for FreeSurfer (P = 0.4), right caudate F(3, 63) = 1.3 for CMA (P = 0.3) and 1.7 for FreeSurfer (P = 0.2). There was a modest trend in the CMA measures for women to have smaller caudate volumes than men (difference = 0.24 mL, P = 0.06), but this was not seen in FreeSurfer volumes (difference = 0.17 mL, P = 0.2). Additionally, the FreeSurfer caudate volumes of the alcoholic subjects tended to be larger than in control subjects (difference = 0.25 mL, P = 0.06), but this was not seen in CMA volumes (difference = 0.07 mL, P = 0.6).
Volumetric differences in alcoholism
The volumes attained from both the CMA and FreeSurfer methods were analyzed in terms of the diagnosis of alcoholism. Using the CMA results, the cortex (P = 0.047), caudate (P = 0.025), amygdala (P = 0.030), and nucleus accumbens (P = 0.038) were significantly larger in men as compared with women irrespective of the diagnosis of alcoholism. The thalamus (P = 0.006), the caudate (P = 0.002), and the putamen (P = 0.001) were significantly smaller in MALC group as compared with the MNC group, and the FALC group had significantly smaller hippocampi than the FNC group (P = 0.010). The left pallidum also showed a significant increase in volume as a function of the length of abstinence. Additionally, trends toward increases in brain volume as the duration of abstinence increased were seen in the left cortex (P = 0.066), right cortex (P = 0.076), left white matter (P = 0.077), right hippocampus (P = 0.0755), left amygdala (P = 0.073), right nucleus accumbens (P = 0.068), and right pallidum (P = 0.072). Analyses also demonstrated that the left hippocampus (P = 0.021), the left putamen (P = 0.027), and the right putamen (P = 0.043) significantly decreased with age in the FALC subjects, but not in FNC subjects.
In contrast, the use of the FreeSurfer results indicated that the pallidum (P = 0.031) and nucleus accumbens (P = 0.041) were significantly larger in the men than in the women. The putamen (P = 0.002), the pallidum (P = 0.001), and the nucleus accumbens (P = 0.001) were significantly smaller in the MALC as compared with the MNC group, and the FALC subjects had significantly smaller amygdala than the FNC subjects (P = 0.036). The right pallidum (P = 0.015) increased in volume with the length of abstinence. The left putamen (P = 0.010) and the right putamen (P = 0.029) decreased significantly in size with age in the MNC, but not in the MALC group. Thus, the results and interpretation of the volumetric analysis were somewhat dependent on the method used to generate the volumes.
Discussion
Morphometric brain volume measurements reveal abnormalities in developmental or pathological processes in a wide range of psychiatric and neurologic disorders, as well as describe normative neurodevelopment and aging. Both automated and manually supervised systems are available for morphometric brain analysis, with varying benefits and limitations. In contrast to previous studies of healthy young individuals,Citation4 the discrepancies between the Free-Surfer and CMA volumes that we observed suggest that the two methods may vary in volumetric measurements when older and noncontrol groups are studied. Because CMA is a manually supervised expert system, it is presumably more neuroanatomically accurate than FreeSurfer, but CMA may be less reproducible due to variability within and between individual raters in the measurement of certain structures. Nevertheless, CMA is considered the gold standard of brain segmentation because of its high inter-rater and intra-rater reliabilities and neuroanatomical expert supervision, which have consistently been shown.Citation28,Citation29 A manually supervised and edited system may be less susceptible to issues with image quality or tissue intensity that shift structure boundaries nonuniformly or with motion artifacts, since the rater can use knowledge and experience to override computational-based segmentation compared with fully automated segmentation. The disparate definitions of a particular structure between CMA and FreeSurfer may affect volumetric correlations, such as in the cerebral cortex where FreeSurfer consistently underestimated relative to CMA volume. Other structures, such as the nucleus accumbens and the caudate or the hippocampus and the amygdala, which were often grouped together in earlier studiesCitation33 because of the blurry boundary between the two structures, may be defined differently in CMA and FreeSurfer, leading to poor agreement for those particular regions.
Previously, high inter-rater reliabilities were determined between the FreeSurfer and CMA systems by segmenting seven healthy brains and then by establishing a probabilistic atlas in FreeSurfer using six of the brains to automatically segment the seventh brain.Citation27 A similar methodology was used for the CMA measurements, and it was found that percent volume overlap and percent volume difference within the two methods were comparable,Citation4 indicating similar degrees of consistency within the methods. However, we have demonstrated here an inconsistency between the two methods for many brain structures. In addition, the previous comparison used seven healthy subjects compared with the 69 older and/or alcoholic subjects that were used in this study, which represents a much larger sample size and a different demographic representation. The present study is notable because of issues presented by segmentation of brains containing natural atrophy (as with elderly subjects) and/or with pathologic morphological changes, such as those that may be found in individuals with a history of alcoholism. Importantly, male alcoholics demonstrated the lowest volumetric consistency between methods, while they also demonstrated the largest volumetric changes in relation to alcoholism. Thus, automated methods such as FreeSurfer may be more challenged to accurately segment certain structures in the male alcoholic brains. Perhaps the two methods applied in the current study would have demonstrated enhanced agreement if group-specific training sets were used to make separate group atlases for automated analyses. Clearly, further study is warranted.
Based on CMA analyses, the thalamus, caudate, and putamen were significantly smaller in male alcoholics as compared with male controls, whereas only the hippocampus was significantly smaller in women. This finding of gender differences is noteworthy because it has been previously suggested that women are more vulnerable to the effects of alcohol than men in terms of increased brain atrophy and increased organ damage.Citation18,Citation19,Citation34 However, our FALC group had a lower QFI, which may have been related to less severe atrophy. Thus, the fewer brain deficits seen in alcoholic women relative to alcoholic men in the present study further suggests that alcoholism affects the brain differently in the two genders.Citation18,Citation35
The ICC analysis demonstrated that the volumetric measurements of white matter, thalamus, caudate, and lateral ventricles, were strongly correlated between CMA and FreeSurfer methods. However, although a significantly smaller thalamus and caudate were found in CMA volumes for alcoholic subjects, these results were not found using the FreeSurfer volumes for thalamus and caudate. This may have occurred despite the relatively high ICC values in thalamus and caudate, because of the greater variability between methods in alcoholic men compared with the other groups. Furthermore, ICC does not measure solely the correlation between methods, but the consistency of the measurements within CMA or FreeSurfer themselves. The low correlation between methods was seen specifically in alcoholic men, even in many of the regions that had “acceptable” ICC values. It is noteworthy that the women had more comparable between-method results. Thus, in order to increase the reliability of ICC values between methods, it would be helpful to have separate ICC value calculations for each gender and disorder subgroup.
Our results demonstrated the advantages and limitations of fully automated FreeSurfer versus semi-automated CMA morphometry. FreeSurfer automated segmentation computed regional volumes that differed from manually derived volumes for certain structures. In some regions, such as cerebral cortex, the differences were relatively large. However, as long as the same method is used within a study, a systematic difference across subjects may still allow useful analyses. Improvements in FreeSurfer and similar automated approaches will continue to present faster and more reliable methods for brain segmentation for increased speed and reliability of brain processing and analyses. For example, the analyses in the current paper used an older version of FreeSurfer (version 3, whereas version 5 of FreeSurfer was released in 2010). However, we re-analyzed the scan in with FreeSurfer, version 5, and derived a cerebral cortex volume that was similar to the results reported above for version 3, both of which were substantially smaller than the CMA volume determined for this scan. For future analyses, it would be of interest to create a probabilistic atlasCitation4 from a set of segmented male alcoholic brains for automated analysis with FreeSurfer. Then, by running an additional male alcoholic brain through the atlas for segmentation and by repeating this process for each male alcoholic brain, the inter-method reliability could be reevaluated. It may be that with group-specific atlas templates, the reliability between methods of the MALC group would improve to be comparable with the MNC and female groups. Potentially, volumetric measurements between FreeSurfer and CMA methods would be more highly correlated if FreeSurfer applied group-specific templates with volumes derived from a solely male, alcoholic atlas. If so, perhaps FreeSurfer could be trained for brain segmentation using unique atlases for different demographic populations. In contrast, CMA has the disadvantages of being time and labor intensive, limiting its availability to a constrained user-base and constricting the throughput of scan analyses that can be performed. Furthermore, since it is not automated, relying on user-assisted region definition, it is more prone to inter- and intra-rater variability versus computer automated methods such as FreeSurfer.
Conclusion
This study demonstrated that brain segmentation by the fully automated FreeSurfer methodology and the semi-automated observer-assisted CMA method yielded more similar results for control subjects of both genders and for alcoholic women than for alcoholic men. Measurements of smaller brain regions such as the nucleus accumbens showed increasingly discrepant volume differences between the two methods, as did cerebral cortex volume. The discrepancies between methods were greatest in alcoholic men. Analyses of the brains of alcoholics using the CMA volumes demonstrated that the thalamus, caudate, and putamen were significantly smaller in alcoholic men as compared with nonalcoholic control men, and that the hippocampus was significantly smaller in alcoholic women as compared with nonalcoholic control women. The results suggest that the low correlations between methods observed in the alcoholic men but not in control men or women for certain structures may be due to alcoholism-related morphological abnormalities found in the brain reward system. Future research is needed to determine the comparability of automated and user-supervised methods to explore the effects of alcoholism on additional brain structures.
Acknowledgements
This research was supported by funds from the US Department of Health and Human Services, NIAAA (R01 AA 07112, K05 AA 00219), and by funds from the Medical Research Service of the US Department of Veterans Affairs. Ms Song thanks the Center for Excellence in Education (CEE), the Research Science Institute (RSI), the Massachusetts General Hospital (MGH), and the Massachusetts Institute of Technology (MIT) for providing the opportunity to conduct this work, as well as the RSI staff, and especially Mr Zach Wissner-Gross, Mr Austin Webb, and Ms Lauren Lisann, for their support. Thanks also to Rob Zondervan for his help.
Disclosure
The authors report no conflicts of interest in this work.
References
- MakrisNOscar-BermanMJaffinSKDecreased volume of the brain reward system in alcoholismBiol Psychiatry200864319220218374900
- GoldmanALPezawasLMattayVSHeritability of brain morphology related to schizophrenia: a large-scale automated magnetic resonance imaging segmentation studyBiol Psychiatry200863547548317727823
- Van EijndhovenPvan WingenGvan OijenKAmygdala volume marks the acute state in the early course of depressionBiol Psychiatry200965981281819028381
- FischlBSalatDHBusaEWhole brain segmentation: automated labeling of neuroanatomical structures in the human brainNeuron200233334135511832223
- SullivanEVRosenbloomMJPfefferbaumAPattern of motor and cognitive deficits in detoxified alcoholic menAlcohol Clin Exp Res200024561162110832902
- PfefferbaumASullivanEVMathalonDHLimKOFrontal lobe volume loss observed with magnetic resonance imaging in older chronic alcoholicsAlcohol Clin Exp Res19972135215299161613
- Oscar-BermanMMarinkovicKAlcohol: effects on neurobehavioral functions and the brainNeuropsychol Rev200717323925717874302
- DesikanRSSegonneFFischlBAn automated labeling system for subdividing the human cerebral cortex on MRI scans into gyral based regions of interestNeuroimage200631396898016530430
- ChengHHuangFMRI image intensity correction with extrapolation and smoothingConf Proc IEEE Eng Med Biol Soc200521324132717282440
- FischlBSalatDHvan der KouweAJSequence-independent segmentation of magnetic resonance imagesNeuroimage200423Suppl 1S69S8415501102
- JovicichJCzannerSHanXMRI-derived measurements of human subcortical, ventricular and intracranial brain volumes: reliability effects of scan sessions, acquisition sequences, data analyses, scanner upgrade, scanner vendors and field strengthsNeuroimage200946117719219233293
- NishidaMMakrisNKennedyDNDetailed semiautomated MRI based morphometry of the neonatal brain: preliminary resultsNeuroimage20063231041104916857388
- MakrisNKaiserJHaselgroveCHuman cerebral cortex: a system for the integration of volume- and surface-based representationsNeuroimage200633113915316920366
- FreeSurfer [homepage on the Internet] Available from: http://surfer.nmr.mgh.harvard.edu/. Accessed February 7, 2011.
- JerniganTLArchibaldSLFennema-NotestineCEffects of age on tissues and regions of the cerebrum and cerebellumNeurobiol Aging200122458159411445259
- McDonaldCRHaglerDJJrAhmadiMESubcortical and cerebellar atrophy in mesial temporal lobe epilepsy revealed by automatic segmentationEpilepsy Res2008792–313013818359198
- SullivanEVFamaRRosenbloomMJPfefferbaumAA profile of neuropsychological deficits in alcoholic womenNeuropsychology2002161748311853359
- PfefferbaumARosenbloomMDeshmukhASullivanESex differences in the effects of alcohol on brain structureAm J Psychiatry2001158218819711156800
- MannKAckermannKCroissantBMundleGNakovicsHDiehlANeuroimaging of gender differences in alcohol dependence: are women more vulnerable?Alcohol Clin Exp Res200529589690115897736
- CahalanVCisinICrossleyHMAmerican drinking practices: a national study of drinking behavior and attitudes, Report 6New Brunswick, NJRutgers Center for Alcohol Studies1969
- ApaoWKDamonAMLocus of control and the quantity – frequency index of alcohol useJ Stud Alcohol19824332332397120994
- APADiagnostic and statistical manual of mental disorders (DSM-IV)Washington, DCAmerican Psychiatric Association1994
- KennedyDNFilipekPACavinessVSJrAnatomic segmentation and volumetric calculations in nuclear magnetic resonance imagingIEEE Trans Med Imaging1989811718230494
- MakrisNMeyerJWBatesJFYeterianEHKennedyDNCavinessVSMRI-Based topographic parcellation of human cerebral white matter and nuclei II. Rationale and applications with systematics of cerebral connectivityNeuroimage19999118459918726
- FilipekPARichelmeCKennedyDNCavinessVSJrThe young adult human brain: an MRI-based morphometric analysisCereb Cortex1994443443607950308
- CavinessVSJrKennedyDNRichelmeCRademacherJFilipekPAThe human brain age 7–11 years: a volumetric analysis based on magnetic resonance imagesCereb Cortex1996657267368921207
- DaleAMFischlBSerenoMICortical surface-based analysis. I. Segmentation and surface reconstructionNeuroimage1999921791949931268
- SeidmanLJFaraoneSVGoldsteinJMThalamic and amygdala-hippocampal volume reductions in first-degree relatives of patients with schizophrenia: an MRI-based morphometric analysisBiol Psychiatry199946794195410509177
- CavinessVSJrMeyerJWMakrisNKennedyDNMRI-based topographic parcellation of the human neocortex: an anatomically specified method with estimate of reliabilityJ Cogn Neurosci199686566587
- ShroutPEFleissJLIntraclass correlations: uses in assessing rater reliabilityPsychol Bull197986242042818839484
- McGrawKWongSForming inferences about some intraclass correlation coefficientsPsychol Methods1996113046
- BlandJMAltmanDGMeasuring agreement in method comparison studiesStat Methods Med Res19998213516010501650
- KarimiMMBatmanghelichNSoltanian-ZadehHLucasCA 3-D deformable surface method for automatic hippocampus-amygdala complex segmentationIEEE Nucl Sci Symp Conf Rec2004637253729
- HommerDMomenanRKaiserERawlingsREvidence for a gender-related effect of alcoholism on brain volumesAm J Psychiatry2001158219820411156801
- PfefferbaumARosenbloomMServentiKLSullivanEVCorpus callosum, pons, and cortical white matter in alcoholic womenAlcohol Clin Exp Res200226340040611923595
- WechslerDWechsler Adult Intelligence Scale – IIISan Antonio, TXThe Psychological Corporation1997