
Abstract
Objective
Obstructive sleep apnea (OSA) is accompanied by widespread abnormal spontaneous regional activity related to cognitive deficits. However, little is known about the topological properties of the functional brain connectome of patients with OSA. This study aimed to use the graph theory approaches to investigate the topological properties and functional connectivity (FC) of the functional connectome in patients with OSA, based on resting-state functional magnetic resonance imaging (rs-fMRI).
Methods
Forty-five male patients with newly diagnosed untreated severe OSA and 45 male good sleepers (GSs) underwent a polysomnography (PSG), clinical evaluations, and rs-fMRI scans. The automated anatomical labeling (AAL) atlas was used to construct the functional brain connectome. The topological organization and FC of brain functional networks in patients with OSA were characterized using graph theory methods and investigated the relationship between functional network topology and clinical variables.
Results
Both the patients with OSA and the GSs exhibited high-efficiency “small-world” network attributes. However, the patients with OSA exhibited decreased σ, γ, Eglob; increased Lp, λ; and abnormal nodal centralities in several default-mode network (DMN), salience network (SN), and central executive network (CEN) regions. However, the patients with OSA exhibited abnormal functional connections between the DMN, SN, and CEN. The disrupted FC was significantly positive correlations with the global network metrics γ and σ. The global network metrics were significantly correlated with the Epworth Sleepiness Scale (ESS) score, Montreal Cognitive Assessment (MoCA) score, and oxygen desaturation index.
Conclusion
The findings suggest that the functional connectome of patients with OSA exhibited disrupted functional integration and segregation, and functional disconnections of the DMN, SN, and CEN. The aberrant topological attributes may be associated with disrupted FC and cognitive functions. These topological abnormalities and disconnections might be potential biomarkers of cognitive impairments in patients with OSA.
Introduction
Obstructive sleep apnea (OSA) is a common sleep-related breathing disorder characterized by repetitive partial (hypopneas) or complete (apnea) obstruction of the upper airway during sleep, which leads to fragmented sleep, intermittent nocturnal hypoxia, and hypercapnic hypoxia.Citation1 Population-based epidemiological studies indicate that OSA is estimated to occur in 12% of women and up to 30% of men aged between 30 and 70 years, and the prevalence rates are increasing with increasing population age and obesity levels.Citation2 OSA is associated with a broad range of neurocognitive impairment, psychological problems, cardiovascular and cerebrovascular diseases, insomnia, and even Alzheimer’s disease. The detrimental effects of OSA include impaired work performance, daytime sleepiness, decreased quality of life, increased risk of vehicular and industrial accidents, and cognitive deficits. Patients with OSA exhibit neurocognitive impairments that involve attention, memory, learning, executive function, visuospatial function, and language abilities. Sleep fragmentation and intermittent nocturnal hypoxia are presumed to be the main contributory factors in neuropsychological impairments in patients with OSA;Citation1,Citation3 however, the underlying neuropathological mechanisms of cognitive impairments in patients with OSA remain largely unclear. To explain cognitive deficits, magnetic resonance imaging (MRI), a non-invasive imaging technique, has been widely used to identify brain structural and functional impairments in OSA patients. Several studies have suggested that widespread local abnormalities in OSA, expressed as reduced white matter integrity and gray matter volume, brain metabolites abnormalities,Citation4 aberrant regional cerebral blood flow,Citation5 and altered brain activation and deactivation patterns in multiple brain regions,Citation6–Citation9 particularly in the default-mode network (DMN), salience network (SN), and central executive network (CEN), are responses for the evoked sensorimotor, affective, autonomic, and ventilatory challenges and cognitive deficits.Citation10–Citation12
Resting-state functional MRI (rs-fMRI) is a promising tool for understanding neural deficits, monitoring disease progression, and evaluating treatment effects in patients with OSA,Citation13 and rs-fMRI has been widely used to explore the intrinsic brain activity of humans.Citation14 Previous rs-fMRI studies have suggested that OSA specifically affects resting-state brain activity in several regions, including the insular cortex, hippocampus, posterior cingulate cortex (PCC), thalamus, basal ganglia, frontal regions, cerebellum, and sensorimotor-related areas.Citation8,Citation9 Functional connectivity (FC) alterations have been identified between specific region pairs in patients with OSA. Zhang et alCitation15 found a functional disconnection between the right anterior insula (AIns) and the DMN that was associated with OSA severity and impaired working memory performance; the authors regard the weakened rs-FC of the right AIns with the DMN to be a biomarker of cognitive impairment in patients with OSA. OSA selectively impairs the rs-FC of subregions within the DMN, which is associated with cognitive impairments.Citation6 In addition, structural and functional deficits in the anterior DMN, but functional compensation in the posterior DMN, have been found in patients with OSA.Citation13 Park et alCitation16 observed abnormal rs-FC in various brain regions, including autonomic, affective, executive, and sensorimotor functional areas related to cognitive functions in patients with OSA. Despite the increasing knowledge of impaired spontaneous regional activity and abnormal FC, either within a specific brain system or between different systems of OSA,Citation7–Citation9 very little is known regarding whether OSA disrupts the global topological organization of the brain functional connectome or the relationship between FC and global topological organization.
Graph theoretical analysis provides a powerful framework for characterizing the topological properties of brain networks, including global and regional properties, and has become increasingly popular in the neuroimaging field. Through graph theory approaches, the functional network of the human brain has been found to show prominent small-world attributes that are simultaneously highly segregated and integrated, and are characterized by a high degree of local interconnectivity and small path lengths linking nodes in individual networks.Citation17 Graph theory approaches have been applied to study not only normal brainsCitation18 but also various brain-related diseases, such as depression,Citation19 Alzheimer’s disease,Citation20 posttraumatic stress disorder,Citation21 schizophrenia,Citation22 and epilepsy.Citation23 An increasing number of studies have used graph theory and combined FC with the small-world network organization of brain functions to investigate the effects of diseases on brain networks and have shown that cognitive deficits are accompanied by disrupted topological organization.Citation24 The relationship between functional network topology and cognitive function in OSA is an important question that has so far been relatively under-explored, although current work has shown variations in the topological properties of functional and structural networks in OSA.Citation25,Citation26
We hypothesized that the topological organization of the brain functional connectome has been disrupted in patients with OSA and that these alterations may be related to the disrupted rs-FC and cognitive impairments of patients with OSA. Here, we used graph theory approaches and rs-fMRI to investigate changes in the topological organization of functional networks in OSA patients. In this study, we constructed the functional connectome of OSA and sought to determine whether patients with OSA would show the following: (1) abnormal global and regional properties in brain functional networks; (2) disrupted functional network connectivity; and (3) the relationship between network topological property changes and FC, clinical variables, and cognitive performance.
Methods
Subjects
Forty-five male patients with untreated severe OSA who were recruited from the Sleep Monitoring Room of the First Affiliated Hospital of Nanchang University, China, and 45 demographically matched good sleepers (GSs) from the local community participated in this study, between October 2015 and August 2017. The following inclusion criteria were used for the OSA patients and GSs in this study: (1) OSA patients, an apnea–hypopnea index (AHI) greater than or equal to 30; GSs, as healthy control, with an AHI less than 5; (2) right-handed; (3) male gender; and (4) age older than 20 years but younger than 60 years. The following exclusion criteria for the OSA patients and GSs were employed: (1) other sleep disorders, such as primary insomnia or a sleep-related eating disorder; (2) a structural lesion in conventional MR images; (3) neurological or mental illnesses (eg, neurodegenerative diseases, hypothyroidism, epilepsy, depression, psychosis, and head injury); (4) addiction to drugs or alcohol; (5) chronic obstructive pulmonary disease or diabetes cerebrovascular disease; (6) MRI contraindications, such as claustrophobia, metallic implants, or devices in the body; and (7) refusal by the participant to enroll in this study. This study was approved by the Institutional Review Board of the First Affiliated Hospital, Nanchang University, China. This study was conducted in compliance with the principles of the Declaration of Helsinki. Written informed consent was provided by all participants before beginning any study procedure.
Polysomnography (PSG)
Full nocturnal PSG was performed on patients with OSA and GSs using the Respironics LE-Series Physiological Monitoring System (Alice 5 LE; Respironics, Orlando, FL, USA). One day prior to the overnight PSG, all participants were required to refrain from consuming hypnotics, alcoholic drinks, and coffee. Overnight PSG was recorded from 10 PM to 6 AM the next morning. Standard electroencephalogram (EEG), electrooculogram (EOG), chin electromyogram (EMG), electrocardiogram (ECG), thoracic and abdominal respiratory movements, oral and nasal airflow, oxygen saturation (SaO2), snoring, and body position were recorded. According to the American Academy of Sleep Medicine guidelines, obstructive apnea was defined as a reduction in airflow ≥90% lasting for more than 10 s and associated with persistent respiratory effort; a hypopnea was defined as a reduction in airflow ≥30% lasting at least 10 s and accompanied by a 4% or greater oxygen desaturation and/or with EEG arousal.Citation27 The AHI was calculated as the average number of apnea and hypopnea events experienced per hour during sleep. The arousal index (AI) was calculated as the mean number of EEG arousals per hour of sleep.
Neuropsychological assessments
Excessive daytime sleepiness was evaluated by using the Epworth Sleepiness Scale (ESS, Chinese version), which requires participants to rate his or her probability of falling asleep on a scale of increasing probability from 0 to 3 in eight different situations.Citation28 The maximum score is 24. A score greater than 6 suggests sleepiness, a score greater than 11 demonstrates excessive sleepiness, and a score greater than 16 indicates risky sleepiness. Cognitive function was evaluated using the Montreal Cognitive Assessment (MoCA, Chinese version),Citation29 with eight cognitive items, including executive function, memory, attention, calculation, abstraction, naming, language, and orientation. The maximum MoCA score is 30, with a MoCA score less than 26 indicating cognitive impairment. If the number of schooling years was less than 12, one point was added to adjust for educational deviations.Citation30
MRI data acquisition
All MRI data were collected on a 3.0 T MRI system (Siemens, Erlangen, Germany) scanner using an 8-channel phased-array head coil in the First Affiliated Hospital of Nanchang University, China. Foam pads were used to restrict head movements, and ear plugs were used to minimize scanner noise. Participants were trained how to swallow, keep nasal breathing, and, without open mouth, to control the movement of the tongue and the mandible. All the participants were required to remain as still as possible, to relax, to keep their eyes closed, to not think systematically, and to not fall asleep. First, conventional T1-weighted images and T2-weighted images were collected for all the participants to exclude macrostructural brain lesions that may affect brain function or microstructure. Resting-state functional images with a gradient-recalled echo-planar imaging (EPI) sequence (repetition time=2,000 ms, echo time=30 ms, thickness=4.0 mm, gap=1.2 mm, field of view=230×230 mm, flip angle=90°, matrix=64×64, slices=30, duration 8 min and 6 s, 30 axial slices covering the whole brain) were obtained. Finally, high-resolution three-dimensional T1-weighted brain structural MR images were obtained using a magnetization-prepared rapid gradient echo sequence (repetition time=1,900 ms, echo time=2.26 ms, thickness=1.0 mm, gap=0.5 mm, field of view=250×250 mm, flip angle=9°, resolution matrix=256×256, slices=176). After the MRI scan, all the participants were asked whether they fell asleep during the scan.
fMRI data preprocessing
Data were preprocessed using Statistical Parametric Mapping (SPM8) (http://www.fil.ion.ucl.ac.uk) and Data Processing & Analysis Assistant for Resting-State Brain Imaging (DPABI, Chinese Academy of Sciences, Beijing, China, http://rfmri.org/DPABI)Citation31 in the MATLAB 2012a (MathWorks, Natick, MA, USA) platform. The first 10 volumes of each subject were discarded to eliminate magnetic saturation effects, and the remaining 230 volumes were slice-time corrected and three-dimensional head motion corrected. Subjects were excluded if there was more than 1.5-mm maximum displacement in any of the directions (x, y, z), or more than 1.5° of angular rotation in any axis during the whole fMRI scans, or if there was a frame-wise displacement (FD) of more than 2.5 standard deviationsCitation32 for any of the 230 volumes. The T1-weighted structural images were co-registered to the mean of the realigned EPI images for each individual. The transformed structural images were then segmented into gray matter, white matter, and cerebrospinal fluid using the new segmentation in SPM8. The Diffeomorphic Anatomical Registration Through Exponentiated Lie Algebra tool was used to compute transformations from individual native space to Montreal Neurological Institute (MNI) space, and images were re-sampled to 3×3×3 mm3 voxels. Then, the images were smoothed with a 6-mm full-width at half-maximum Gaussian kernel. To further reduce the effects of confounding factors, nuisance covariates, including the white matter signal, cerebrospinal fluid signal, global signal, and Friston 24-parameter head motion parameters, were regressed from the time series of all voxels via linear regression.Citation33 Finally, a temporal bandpass filtering (0.01–0.08 Hz) was performed to reduce low-frequency drift, physiological high-frequency noise, and cardiac noise.
Functional network construction
Node and edge definitions
At the microscopic scale, a human brain network can be described abstractly by a graph or subgraph, with nodes defining neurons and edges representing axonal connections. However, at the macroscopic scale of neuroimaging data, the nodes represent voxels or regions, and the edges are some statistical measure of association (ie, FC) between voxels or regions. To define the brain nodes, automated anatomical labeling (AAL) was employed, which divided the whole brain into 116 cortical and subcortical regions of interest.Citation34,Citation35 For each subject, the averaged time series of all voxels in each region of interest was extracted to obtain a representative time series. The Pearson’s correlation coefficients between the regional mean time series of all possible pairs of the 116 brain regions were calculated as edges in the network, resulting in a 116×116 Pearson’s correlation matrix for each participant, and then converted into binarized matrices. A Fisher’s r-to-z transformation was performed to translate the individual correlation maps into z-scored maps to improve normality.Citation36
Network analysis
In this study, both the global and regional network measures of functional brain networks of patients with OSA and GSs were investigated using the graph theoretical network analysis toolbox (GRETNA) (http://www.nitrc.org/projects/gretna/).Citation37 The brain functional networks were modeled based on an unweighted, undirected method. Sparsity (Sp) was defined as the ratio of the existing edges, divided by the highest possible number of edges in a network, which ensured that the all resultant networks would have the same number of edges and minimized the effects of possible discrepancies in the overall correlation strength between the groups.Citation19,Citation38 Therefore, we applied a Sp threshold to all correlation matrices over a wide range of Sp levels (from 0.05 to 0.40 using intervals of 0.01) to explore the between-group differences in the brain functional network organization of patients with OSA and GSs. The area under the curve (AUC) of each network metric was calculated over the Sp range from S1 to Sn, with an interval of ∆S, and this depicts the change in topological characterization of the brain networks.Citation19 The integrated AUC metric is sensitive at detecting topological alterations of brain disorders, and has been used in previous studies.Citation24,Citation39,Citation40 The global network metrics examined in the present study included the following: 1) the small-world properties,Citation17 clustering coefficient, Cp, characteristic path length, Lp, normalized clustering coefficient, γ, normalized characteristic path length, λ, and small-worldness, σ; and 2) the network efficiency parameters,Citation39,Citation41 global efficiency, Eglob, and local efficiency, Eloc. A small-world network with a much higher clustering coefficient (Cp) and a similar characteristic path length (Lp) compared with random networks, met the following criteria: normalized clustering coefficients, γ=Cpreal/Cprand>1, and normalized characteristic path length, λ=Lpreal/Lprand ≈1, or the small-worldness equation, σ=γ/λ>1.Citation17 To determine the regional (nodal) characteristics of functional networks, nodal degree, nodal efficiency (Enodal), and nodal betweenness centrality were computed in this study.
Statistical analysis
Demographic and clinical variables of the OSA patients and GSs were compared using two-sample t-tests with IBM Statistical Package for the Social Sciences 20.0 software (IBM SPSS Inc., Chicago, IL, USA). To determine the between-group differences in the small-world properties (Cp, Lp, γ, λ, and σ), network efficiency (Eglob, Eloc), and nodal characteristics (nodal degree, nodal efficiency, and betweenness centrality), the AUC of each metric was calculated for statistical comparison under the Sp range (0.05<Sp<0.40, step=0.01) with age, educational level, and mean FD as covariates. A false discovery rate (FDR) procedure was further performed at a q-value of 0.05 to correct for multiple comparisons.Citation42
To localize the specific pairs of brain regions with altered FC in the patients with OSA, we chose the pairs of regions that exhibited between-group differences in at least one of the three nodal centralities, including nodal degree, nodal efficiency, and nodal betweenness, and then utilized the network-based statistics (NBS) approachCitation43 (www.nitrc.org/projects/nbs/) to localize the connected networks that showed significant alterations in the patients with OSA. Then, a subset of connection matrices was generated based on these altered nodes in patients with OSA. We applied the NBS method to define a set of suprathreshold links among any connected components (threshold, T=2.368, P<0.01). The significance of each component was estimated using the nonparametric permutation method (10,000 permutations). Age, educational level, and mean FD were taken as covariates of no interest in this model. Finally, to evaluate the clinical correlates of these network property changes in OSA patients, a partial correlation analysis was performed to assess the relationships between network metrics and clinical variables.
Results
Demographic and clinical data
There were no significant differences in age (P=0.893) and education (P=0.817) between the OSA patients and the GSs. There were significant between-group differences in BMI, AHI, nadir SaO2, average SaO2, N1, REM, SaO2<90 percentage, AI, oxygen, desaturation index, MoCA score, ESS score, and sleep efficiency between the OSA patients and the GSs ().
Table 1 Demographic and clinical data comparisons between the patients with OSA and the GSs
Small-world properties of brain functional networks
In the defined threshold range (here from 0.05 to 0.40, step=0.01), both the patients with OSA and the GSs exhibited γ obviously larger than 1 (γOSA=1.74±0.80, γGSs=1.86±0.90) and λ approximately equal to 1 (λOSA=1.08±0.15, λGSs=1.06±0.10). σ (σ=γ/λ) was larger than 1 (σOSA=1.59±0.58, σGSs=1.73±0.65), which suggests that both the OSA patients and the GSs had typical features of small-world attributes in brain functional networks and that, compared with matched random networks, the brain functional networks exhibited much larger clustering coefficients and approximately equal shortest path lengths.
OSA-related alterations in global network measures
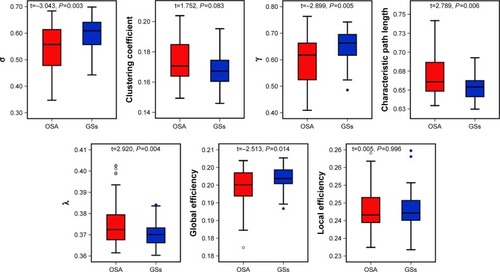
Despite the regime of small-worldness in both groups, statistical analyses revealed significant differences between the patients with OSA and the GSs in both small-world parameters and network efficiency. Using the AUC of each metric for statistical comparisons with the age, educational level, and mean FD as covariates, compared with the GS group, we found that the OSA group exhibited increased Lp (t=2.789, P=0.006), λ (t=2.920, P=0.004), and decreased γ (t=−2.899, P=0.005), σ (t=−3.043, P=0.003). The network efficiency significantly decreased in Eglob (t=−2.513, P=0.014). No significant differences were identified in the Cp (t=1.752, P=0.083) or Eloc (t=0.005, P=0.996). These results suggest that the small-world architecture and network efficiency were significantly altered in the brain functional networks of the OSA patients ().
Figure 1 The small-world parameters and network efficiency parameters comparisons in patients with OSA and GSs.
Abbreviations: σ, small-worldness; γ, normalized clustering coefficient; λ, normalized characteristic path length; OSA, obstructive sleep apnea; GSs, good sleepers.
Nodal characteristics
Regions that exhibited significant between-group differences in at least one of the three nodal centralities were considered abnormal nodal centralities in patients with OSA. The FDR correction was applied to each nodal characteristic, and none survived the correction for nodal betweenness (P<0.01). Compared with GSs, the patients with OSA exhibited increased nodal centralities in the following brain regions: the left insula (INS), left heschl gyrus (HES), left cerebellum crus I, left cerebellum VIII, vermis VII, and vermis VIII. Decreased nodal centralities were found in the bilateral PCC, bilateral inferior parietal, but supramarginal and angular gyri (IPL), right inferior frontal gyrus, opercular part (IFGoperc), bilateral middle frontal gyrus, orbital part (ORBmid), and left angular gyrus (ANG) ().
Table 2 Between-group differences in nodal characteristics in patients with OSA and GSs
OSA-related alterations in FC
Using the NBS approach, we identified a disconnected functional subnetwork with 14 nodes and 17 connections that was significantly altered in the OSA group (FDR-corrected q=0.01). The disconnected functional subnetwork comprising pairs of nodes exhibited between-group differences in at least one of the three nodal centralities in the OSA group, and the nodes were mainly located in the prefrontal, parietal, and subcortical regions, as well as the cerebellum, which included several DMN regions (eg, the PCC, middle frontal gyrus, ANG), SN regions (eg, the insula, cerebellar vermis, and orbitofrontal gyrus), and CEN regions (eg, inferior frontal gyrus and inferior parietal lobe). The connections were mainly involved in long-distance connections linking different regions, including decreased FC in the prefrontal-cerebellum and prefrontal-parietal, and increased FC in the parietal-cerebellum and parietal-prefrontal; connections were also involved in increased short-distance connections within parietal regions and cerebellum regions ( and ). Within this subnetwork, the mean connectivity values were not significantly different between the OSA group and the GSs (t=0.355, P=0.723). The mean FC values showed significant positive correlation with global network metrics σ (r=0.329, P=0.029) and γ (r=0.385, P=0.011; ).
Figure 2 OSA-related alterations in FC.
Abbreviations: OSA, obstructive sleep apnea; FC, functional connectivity; NBS, network-based statistics; DMN, default-mode network; SN, salience network; CEN, central executive network; rs-FC, resting state functional connectivity; GSs, good sleepers; ORBmid, middle frontal gyrus, orbital part; INS, insula; HES, heschl gyrus; IFGoperc, inferior frontal gyrus, opercular part; IPL, inferior parietal, but supramarginal and angular gyri; PCC, posterior cingulate cortex; CRBL-VIII, cerebellar lobule VIII; ANG, angular gyrus; CRBLCrus-I, cerebellum crus I.
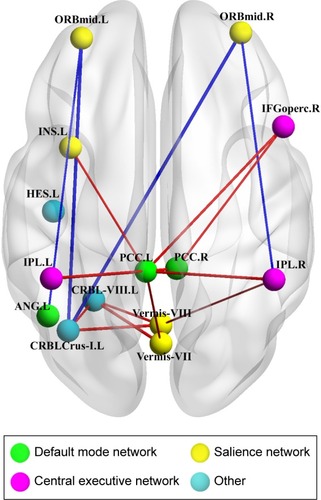
Figure 3 The relationship between the mean FC and global network metrics.
Abbreviation: FC, functional connectivity.
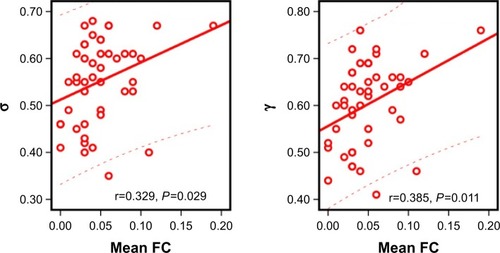
Table 3 OSA-related alterations in FC
Relationships between network metrics and cognitive and clinical variables
Eloc was positively correlated with the MoCA score (r=0.298, P=0.049). Cp (r=−0.381, P=0.011), Lp (r=−0.378, P=0.011), and λ (r=−0.378, P=0.012) were negatively correlated with the ESS score. σ (r=0.304, P=0.045) and Eglob (r=0.325, P=0.031) were positively correlated with the oxygen desaturation index. Lp (r=−0.358, P=0.017) and λ (r=−0.368, P=0.014) were negatively correlated with the oxygen desaturation index.
Discussion
The present study applied graph-based theoretical approaches to analyze the topological organization of brain functional networks in patients with OSA. The results revealed that both the patients with OSA and the GSs had typical features of small-world attributes in brain functional networks. There were five main findings: (1) the patients with OSA exhibited decreased σ, γ, and Eglob, and increased Lp and λ in brain functional networks; (2) the patients with OSA exhibited increased nodal centralities in some SN regions, and decreased nodal centralities in some DMN, SN, and CEN regions; (3) the patients with OSA exhibited abnormal long-distance and short-distance functional connections between/within DMN, SN, and CEN; (4) the mean FC value was significantly positively correlated with global network metrics σ and γ; and (5) the global network metrics were significantly correlated with the ESS score, MoCA score, and oxygen desaturation index. Our findings indicate that individuals with OSA have disrupted global and regional properties and altered FC in brain functional networks, that the OSA-related altered FC further led to disrupted topological properties in brain functional networks, and that the disrupted topological properties are likely related to cognitive impairment, oxygen desaturation, and somnolence, thus providing a new insight into the understanding of the pathophysiology of OSA.
Both the patients with OSA and the GSs exhibited small-world attributes in the brain functional networks, specifically a small-world network with both high clustering and short path lengths; these features provide a topological substrate that facilitates functional specialization and efficient integration and information transfer across the networks that are thought to constitute the basis of cognitive processes. Although both groups showed efficient economic small-world organization in their brain functional networks, the OSA group showed significantly increased Lp, and λ and decreased γ, Eglob, and σ, which were consistent with the previous OSA-related brain network studies using structural MRI and fMRI,Citation16,Citation25,Citation26 and the decreased σ implies a disturbance in functional integration and segregation in the brain network. Lp minimizes the cost associated with routing action potentials across synaptic and axonal contacts, ensuring an inter-regional effective integrity or prompt information transfers across different nodes in the brain network.Citation41 An increased λ shows an increased ratio of characteristic shortest path lengths in the patients with OSA. The OSA-related increased Lp could be attributable to the degeneration of long-distance FC or sparse connectivity for information transmission. The clustering coefficient is often interpreted as an index of functional specialization or segregation or as a measure of the local information-processing capacity of a network. The present results also showed that the OSA patients had a decreased γ, which is consistent with previous findings.Citation25 Our NBS results showed compensatory increased short-distance connections within parietal regions and cerebellar regions. The decreased γ in the OSA patients suggests that the high functional specialization and segregation of the brain functional networks may be damaged, and decreased γ might be due to the altered short-distance connections between adjacent brain regions in the patients with OSA. We also found that σ was positively correlated with the oxygen desaturation index, Cp, Lp, and λ were negatively correlated with the ESS score, and that Lp and λ were negatively correlated with the oxygen desaturation index, which might provide clues to support that chronic intermittent hypoxemia disrupted the efficient integration and specialization of functional brain networks in OSA, and further resulted in cognitive impairment and daytime sleepiness.
Global efficiency, Eglob, as a superior measure of integration, reflects information transfer between remote cortical regions across whole-brain regions, which are associated with long-range connections.Citation25 In addition, our NBS results found that disrupted long-distance connections including decreased FC in the prefrontal-cerebellum and prefrontal-parietal and increased FC in the parietal-prefrontal and parietal-cerebellum. Our finding of decreased Eglob suggests that the capacity for information exchange or functional integration of the brain networks in patients with OSA have been disrupted, which may result from the damaged or sparse functional connections across the whole-brain network in patients with OSA. This study also found that Eloc was positively correlated with the MoCA score and that Eglob was positively correlated with the oxygen desaturation index, indicating that chronic intermittent hypoxemia was related to a reduced efficiency of information dissemination and damaged capacity for information integration between remote brain regions, and that aberrant network efficiency was related to cognitive function impairment in patients with OSA.
Nodal centrality detects the importance of a region in network communication by measuring the information flow in the functional connectome.Citation41 We combined the betweenness centrality, nodal efficiency, and nodal degree to explore the node attributes of the brain functional connectome in patients with OSA. We found that the patients with OSA exhibited increased nodal centralities in several regions related to the SN (left insula and cerebellar vermis) and decreased nodal centralities in some DMN (bilateral PCC, bilateral middle frontal gyrus, and left ANG), SN (bilateral orbitofrontal gyrus), and CEN regions (right inferior frontal gyrus and bilateral inferior parietal lobe). Such findings are comparable to previous studies showing that patients with OSA demonstrate altered white matter integrity, regional gray matter volume, and regional cerebral blood flow, as well as brain metabolic abnormalities, connectivity deficits, and regional spontaneous activity deficits in these regions, which largely overlap with the DMN, SN, and CEN and explain the observed affective, sensorimotor, and cognitive deficits of OSA patients.Citation6,Citation11,Citation13,Citation15,Citation44,Citation45 The PCC has strong reciprocal connections with other structural areas that are components of the DMN and plays a crucial role in attention processing, cognitive functions, personal significance, evoked emotions, and the collection and evaluation of information.Citation46 In addition, as abnormal brain activation, decreased gray matter volume and white matter integrity in the PCC are correlated with intermittent hypoxia and cognitive dysfunction in OSA,Citation8,Citation9,Citation13 conceivably, decreased nodal centralities of the bilateral PCC might be involved in the disruption of cognitive function and emotional processing in OSA patients. The insula is thought to be related to sensorimotor integration, cognitive control, and emotional modulation.Citation47 Bilateral anterior insular neuronal damage, localized cortical thinning in the insula, and abnormal insular cortex metabolites have been shown to be correlated with disease severity and neuropsychological status in patients with OSA.Citation45,Citation48 Park et alCitation49 found that patients with OSA show complex abnormal FC between the insular cortices and several brain regions regulating affective, cognitive functions, autonomic, and sensorimotor functions.Citation49 A meta-analysis highlighted that the insular cortex is an important node in neurocognitive, somatosensory, affective, and perceptual deficits in patients with OSA.Citation50 We found increased nodal centralities in the left insula of the SN, which might be related to altered processing of cognitive, emotional, and sensorimotor integration in patients of OSA. These previous findings suggest that structural and functional deficits exist in the DMN, SN, and CEN, and we speculate that the structural changes and functional alterations observed in patients with OSA in those regions may impair regional centrality of brain networks and further diminish the integrative and communicative hub role of the DMN, SN, and CEN in patients with OSA.
Prilipko et alCitation10 observed defective deactivation of the DMN in patients with OSA during tasks and proposed nocturnal desaturation and intermittent hypoxia as a major factor behind the observed abnormal FC and DMN dysfunction in patients with OSA. The DMN is critical for maintaining brain function in the resting state and contributes to attentional internal mentation and adaptive function,Citation51 and decreased rs-FC within the DMN may be related to depression and anxiety in patients with OSA.Citation6 The SN plays a crucial role in detecting and processing cognitive, attention, control, emotional, and homeostatic saliency events. The right AIns, as a core area of the SN, plays a key role in switching between the DMN and CEN.Citation52 Our NBS results showed decreased FC between the left insula of the SN and the left PCC of the DMN and increased FC between the orbital part of the left middle frontal gyrus of the SN and the left ANG of the DMN, which indicates that the FC between the DMN and the SN is disturbed in patients with OSA. Moreover, Zhang et alCitation15 demonstrated a disconnect between the right insular cortex of the SN and DMN, which may be related to deficits in cognitive control, such as working memory, attention, and depression in patients with OSA. These findings suggest that the functional disconnect between the SN and DMN might play a crucial role in cognitive deficits and affective disturbances in patients with OSA. The CEN is usually observed to be active in task-positive tasks, which are associated with working memory, as well as processes related to goal-directed behaviors, attention, response selection, and task management.Citation52,Citation53 Altered spontaneous activation of the CEN and deactivation of the DMN during working memory tasks and a functional disconnect between brain regions of the CEN and DMN have been shown in rs-fMRI, which may contribute to cognitive deficits in OSA patients.Citation8,Citation10,Citation13,Citation15,Citation50 Our results showed that the altered functional connections predominantly linked the CEN and the DMN, which indicates a functional disconnection between the CEN and the DMN in patients with OSA. Combined with previous findings, we speculate that the aberrant nodal centralities may be relevant to the disconnection between the CEN and DMN, which further results in cognitive deficits in OSA patients, such as impairments in attention and working memory.
The present study had several limitations. First, we only recruited severe male patients with OSA, thus lacking an investigation of OSA severity or sex-specific differences, which prevents us from generalizing these findings to the total population of patients with OSA. Second, the functional brain networks were constructed by the AAL atlas, which parcellates the whole brain into 116 brain regions at a coarsely anatomical level; a more precise parcellation strategy or a functional scale should be used to construct the brain networks in the future. Third, OSA is related to depression and anxiety, which may affect the intrinsic resting-state brain activity, but we did not conduct an affective evaluation.Citation54 Finally, we only used the MoCA to evaluate the cognitive function of subjects; a more detailed neuropsychological questionnaire should be used to disclose more interesting data.
Conclusion
In this rs-fMRI study, we applied graph-based theoretical approaches to investigate the topological properties of the functional connectome in OSA patients. We found that, although the patients with OSA showed small-world networks, the functional connectome of the patients with OSA had impaired global and regional properties and functional disconnections of the DMN, SN, and CEN; the aberrant topological attributes may be associated with disrupted FC and clinical and cognitive variables. These topological abnormalities and functional disconnections might be the potential biomarkers of cognitive impairments in patients with OSA.
Acknowledgments
This work was supported by grants from the Natural Science Foundation of China (Grant No 81560285), the Natural Science Foundation of Jiangxi, China (Grant No 20171BAB205070, 20132BAB205100), the Education Department Foundation of Jiangxi, China (Grant No 700544006), the Graduate Innovation Foundation of Jiangxi, China (Grant No YC2016-S100), the Science and Technology Support Program of Jiangxi, China (Grant No 20132BBG70061, 20141BBG70026), and the Doctoral Project Startup Fund (Grant No 700544005).
Disclosure
The authors report no conflicts of interest in this work.
References
- LimDCPackAIObstructive sleep apnea and cognitive impairment: addressing the blood-brain barrierSleep Med Rev2014181354823541562
- PeppardPEYoungTBarnetJHPaltaMHagenEWHlaKMIncreased prevalence of sleep-disordered breathing in adultsAm J Epidemiol201317791006101423589584
- DécaryARouleauIMontplaisirJCognitive deficits associated with sleep apnea syndrome: a proposed neuropsychological test batterySleep200023336938110811381
- KumarRPhamTTMaceyPMWooMAYan-GoFLHarperRMAbnormal myelin and axonal integrity in recently diagnosed patients with obstructive sleep apneaSleep201437472373224899761
- JooEYTaeWSHanSJChoJWHongSBReduced cerebral blood flow during wakefulness in obstructive sleep apnea-hypopnea syndromeSleep200730111515152018041484
- LiHJNieXGongHHZhangWNieSPengDCAbnormal resting-state functional connectivity within the default mode network subregions in male patients with obstructive sleep apneaNeuropsychiatr Dis Treat20161220321226855576
- LiHJDaiXJGongHHNieXZhangWPengDCAberrant spontaneous low-frequency brain activity in male patients with severe obstructive sleep apnea revealed by resting-state functional MRINeuropsychiatr Dis Treat20151120721425653530
- SantarnecchiESiciliaIRichiardiJAltered cortical and subcortical local coherence in obstructive sleep apnea: a functional magnetic resonance imaging studyJ Sleep Res201322333734723171248
- PengDCDaiXJGongHHLiHJNieXZhangWAltered intrinsic regional brain activity in male patients with severe obstructive sleep apnea: a resting-state functional magnetic resonance imaging studyNeuropsychiatr Dis Treat2014101819182625278755
- PrilipkoOHuynhNSchwartzSTask positive and default mode networks during a parametric working memory task in obstructive sleep apnea patients and healthy controlsSleep201134329330121358846
- KhazaieHVeroneseMNooriKFunctional reorganization in obstructive sleep apnoea and insomnia: a systematic review of the resting-state fMRINeurosci Biobehav Rev20177721923128344075
- MaceyPMKumarROgrenJAWooMAHarperRMGlobal brain blood-oxygen level responses to autonomic challenges in obstructive sleep apneaPLoS One201498e10526125166862
- ZhangQWangDQinWAltered resting-state brain activity in obstructive sleep apneaSleep201336565165923633747
- LiuFGuoWLiuLAbnormal amplitude low-frequency oscillations in medication-naive, first-episode patients with major depressive disorder: a resting-state fMRI studyJ Affect Disord2013146340140623116810
- ZhangQQinWHeXFunctional disconnection of the right anterior insula in obstructive sleep apneaSleep Med20151691062107026298780
- ParkBPalomaresJAWooMADisrupted functional brain network organization in patients with obstructive sleep apneaBrain Behav201663e0044127099802
- WattsDJStrogatzSHCollective dynamics of ‘small-world’ networksNature199839366844404429623998
- HeYChenZJEvansACSmall-world anatomical networks in the human brain revealed by cortical thickness from MRICereb Cortex200717102407241917204824
- ZhangJWangJWuQDisrupted brain connectivity networks in drug-naive, first-episode major depressive disorderBiol Psychiatry201170433434221791259
- JohnMIkutaTFerbinteanuJGraph analysis of structural brain networks in Alzheimer’s disease: beyond small world propertiesBrain Struct Funct2017222292394227357309
- LeiDLiKLiLDisrupted functional brain connectome in patients with posttraumatic stress disorderRadiology2015276381882725848901
- LiuFZhuoCYuCAltered cerebral blood flow covariance network in schizophreniaFront Neurosci20161030827445677
- XuYQiuSWangJDisrupted topological properties of brain white matter networks in left temporal lobe epilepsy: a diffusion tensor imaging studyNeuroscience201427915516725194789
- SuoXLeiDLiKDisrupted brain network topology in pediatric posttraumatic stress disorder: a resting-state fMRI studyHum Brain Mapp20153693677368626096541
- LuoYGWangDLiuKBrain structure network analysis in patients with obstructive sleep apneaPLoS One2015109e013905526413809
- ChenLTFanXLLiHJDisrupted small-world brain functional network topology in male patients with severe obstructive sleep apnea revealed by resting-state fMRINeuropsychiatr Dis Treat2017131471148228652747
- BerryRBBudhirajaRGottliebDJRules for scoring respiratory events in sleep: update of the 2007 AASM manual for the scoring of sleep and associated eventsJ Clin Sleep Med20128559761923066376
- BillingsMERosenCLAuckleyDPsychometric performance and responsiveness of the functional outcomes of sleep questionnaire and sleep apnea quality of life instrument in a randomized trial: the HomePAP studySleep201437122017202425325491
- ChenKLXuYChuAQValidation of the Chinese version of Montreal Cognitive Assessment basic for screening mild cognitive impairmentJ Am Geriatr Soc20166412e285e29027996103
- NasreddineZSPhillipsNABédirianVThe Montreal Cognitive Assessment, MoCA: a brief screening tool for mild cognitive impairmentJ Am Geriatr Soc200553469569915817019
- YanCGWangXDZuoXNZangYFDPABI: data processing & analysis for (resting-state) brain imagingNeuroinformatics201614333935127075850
- Van DijkKRSabuncuMRBucknerRLThe influence of head motion on intrinsic functional connectivity MRINeuroimage201259143143821810475
- YanCGCheungBKellyCA comprehensive assessment of regional variation in the impact of head micromovements on functional connectomicsNeuroimage201376118320123499792
- Tzourio-MazoyerNLandeauBPapathanassiouDAutomated anatomical labeling of activations in SPM using a macroscopic anatomical parcellation of the MNI MRI single-subject brainNeuroimage200215127328911771995
- LiuFGuoWFoucheJPMultivariate classification of social anxiety disorder using whole brain functional connectivityBrain Struct Funct2015220110111524072164
- LiuFWangYLiMDynamic functional network connectivity in idiopathic generalized epilepsy with generalized tonic-lonic seizureHum Brain Mapp201738295797327726245
- WangJWangXXiaMLiaoXEvansAHeYCorrigendum: GRETNA: a graph theoretical network analysis toolbox for imaging connectomicsFront Hum Neurosci2015945826347640
- HeYDagherAChenZImpaired small-world efficiency in structural cortical networks in multiple sclerosis associated with white matter lesion loadBrain2009132123366337919439423
- AchardSBullmoreEEfficiency and cost of economical brain functional networksPLoS Comput Biol200732e1717274684
- WangJWangLZangYParcellation-dependent small-world brain functional networks: a resting-state fMRI studyHum Brain Mapp20093051511152318649353
- RubinovMSpornsOComplex network measures of brain connectivity: uses and interpretationsNeuroimage20105231059106919819337
- GenoveseCRLazarNANicholsTThresholding of statistical maps in functional neuroimaging using the false discovery rateNeuroimage200215487087811906227
- ZaleskyAFornitoABullmoreETNetwork-based statistic: identifying differences in brain networksNeuroimage20105341197120720600983
- NieSPengDCGongHHLiHJChenLTYeCLResting cerebral blood flow alteration in severe obstructive sleep apnoea: an arterial spin labelling perfusion fMRI studySleep Breath201721248749528210922
- JooEYJeonSKimSTLeeJMHongSBLocalized cortical thinning in patients with obstructive sleep apnea syndromeSleep20133681153116223904675
- TortaDMCaudaFDifferent functions in the cingulate cortex, a meta-analytic connectivity modeling studyNeuroimage20115642157217221459151
- MenonVUddinLQSaliency, switching, attention and control: a network model of insula functionBrain Struct Funct20102145–665566720512370
- YadavSKKumarRMaceyPMWooMAYan-GoFLHarperRMInsular cortex metabolite changes in obstructive sleep apneaSleep201437595195824790274
- ParkBPalomaresJAWooMAAberrant insular functional network integrity in patients with obstructive sleep apneaSleep2016395989100026943471
- TahmasianMRosenzweigIEickhoffSBStructural and functional neural adaptations in obstructive sleep apnea: an activation likelihood estimation meta-analysisNeurosci Biobehav Rev20166514215627039344
- Andrews-HannaJRReidlerJSSepulcreJPoulinRBucknerRLFunctional-anatomic fractionation of the brain’s default networkNeuron201065455056220188659
- SridharanDLevitinDJMenonVA critical role for the right fronto-insular cortex in switching between central-executive and default-mode networksProc Natl Acad Sci U S A200810534125691257418723676
- MenonVLarge-scale brain networks and psychopathology: a unifying triple network modelTrends Cogn Sci2011151048350621908230
- MaceyPMWooMAKumarRCrossRLHarperRMRelationship between obstructive sleep apnea severity and sleep, depression and anxiety symptoms in newly-diagnosed patientsPLoS One201054e1021120419135