
Abstract
Purpose
Depressive symptoms are frequent nonmotor symptoms that occur in multiple system atrophy (MSA) patients. However, possible changes that can present in the amygdala (AMY) functional connectivity (FC) of the brain in MSA patients with depressive symptoms (DMSA patients) remain largely unknown.
Materials and methods
Resting-state functional magnetic resonance imaging scans were obtained from 29 DMSA patients, 28 MSA patients without depression symptoms (NDMSA patients), and 34 healthy controls (HCs). FC was analyzed by defining the bilateral AMY as the seed region. Correlation analysis was performed between the FC and clinical scores.
Results
When compared with NDMSA patients, DMSA patients showed increased bilateral AMY FC in the left middle frontal gyrus (MFG) and decreased right AMY FC in the left middle occipital gyrus. Moreover, the AMY FC values in the left middle frontal cortex were positively correlated with the Hamilton Depression Rating Scale-17 item scores. Furthermore, relative to the HCs, DMSA patients presented decreased bilateral AMY FC values in the visuospatial cortex, sensorimotor networks, and limbic areas.
Conclusion
Depressive symptoms are associated with AMY–MFG FC anomalies in MSA patients. We propose that the middle frontal cortex may play an important role in the neuropathophysiology of depression in MSA patients.
Introduction
Multiple system atrophy (MSA) is the most common type of parkinsonian syndrome, with an incidence of about six to seven individuals affected per 100,000 in the United Kingdom.Citation1 However, although movement disorders have been well defined in previous studies, nonmotor features such as cognitive impairment and depression in MSA patients remain underrecognized and, consequently, undertreated. Results from a recent, relatively large-sample epidemiological survey showed that up to 62% of MSA patients suffer from depression.Citation2 As a result, depression plays a significant role in the poor quality of life in MSA patients.Citation3,Citation4 Severe depression is associated with increased disability and the risk of suicide in MSA patients. Exploring depressive symptoms in MSA patients may further help to avoid misdiagnosis, inappropriate referrals, and delayed treatment.
Amygdala (AMY) is a pivotal hub of the emotional processing neural system and is involved in the onset and development of depression in neurobiological models.Citation5 Real-time functional magnetic resonance imaging (fMRI) neurofeedback is a novel approach that presents an indirect response to the relationship between brain activity and hemodynamics. Patients with depression have shown decreased depressive symptoms and an increase in the percentage of specific memories recalled relative to baseline when receiving AMY real-time fMRI neurofeedback training.Citation6 Task-based fMRI studies have revealed that the AMY activity is increased in response to negative emotional signals (eg, faces, pictures, and words) in major depressive disorder.Citation7 Furthermore, resting-state (RS)-fMRI studies have found that AMY–ventromedial prefrontal cortex circuit functional connectivity (FC) dysfunction is positively correlated with symptom severity for females demonstrating early life stress and depression.Citation8 These findings, taken together with evidence that the AMY closely links the processing of and response to negative and fearful emotional stimuli. Pathological study suggests that characteristic glial cytoplasmic inclusion (GCI) deposition occurs not only in typical disease-associated regions (eg, striatum and substantia nigra) but also within the AMY.Citation9 MSA postmortem brain examination has also revealed the significant atrophy of the AMY,Citation10 which highlights a possible dysfunction of the AMY in conjunction with depression in MSA patients. However, functional changes of the brain under pathological injury of MSA patients with depressive symptoms (DMSA patients) remain poorly understood.
Resting-state functional connectivity (RS-FC) has been proven to be a powerful paradigm for exploring brain interregional correlations in neuronal variability.Citation11 Abnormal AMY-induced RS-FC alteration has been observed in previous studies. For example, patients with major depressive disorder show dysfunction in the orbitofrontal–AMY (OFC-AMY) structure and effective connectivity in the left hemisphere.Citation12 Another research study has suggested that depressed type 2 diabetes mellitus patients present decreased AMY FC in the cingulate cortex, the frontal lobe, and the precentral gyrus as well as a decrease in FC in the anterior cingulate cortex associated with the clinical depression score.Citation13 Similar AMY FC abnormality was also observed in individuals with Parkinson’s diseaseCitation14 and end-stage renal disease.Citation15 To the best of our knowledge, no study has thus far described the difference between DMSA patients and MSA patients without depression symptoms (NDMSA patients), while only one study has revealed DMSA patients show significant metabolic decreases in the bilateral frontal, parietal, and cerebellar cortex and in the left putamen as compared with healthy controls (HCs).Citation16 In this study, depression severity was significantly associated with dorsolateral prefrontal glucose metabolism in MSA patients. Depression symptoms are common in MSA patients, with nearly 62% of MSA patients having different degrees of depressive symptoms.Citation2 However, whether there are alterations in the FC between the AMY and other brain regions in DMSA patients remain unknown.
To explore the above-mentioned issues, we selected the bilateral AMY as a seed region for the investigation of FC patterns of the AMY among DMSA and NDMSA patients using RS fMRI. We hypothesized that the FC between the AMY and several specific brain regions is vulnerable in MSA. We also hypothesized that the above-mentioned FC changes are positively correlated with clinical depressive symptoms in MSA patients.
Materials and methods
Subjects
A total of 57 individuals (29 males and 28 females) with MSA and 34 HCs (19 males and 15 females) were recruited from the First Affiliated Hospital of China Medical University in Shenyang, China, between November 2013 and August 2016. Eligible MSA patients were diagnosed by a neurologist and met the “probable” MSA clinical diagnostic criteria.Citation17 All the participants were right-handed Han Chinese. Potential participants were excluded when 1) obvious brain lesions were assessed on the basis of medical history and conventional MRI; 2) diabetes disease, thyroid disease, or end-stage renal disease was noted; 3) head motion(s) of >2.0 mm or 2.0° during MRI scanning occurred. MSA patients who demonstrated a Mini–Mental State Examination (MMSE) score of <24 as well as those using antidepressants prior to the beginning of the study were also excluded. To control variables, only depressive symptoms secondary to motor symptoms in MSA patients were included through detailed medical history inquiries. This study was approved by the medical research ethical committee of the First Affiliated Hospital of China Medical University, and a written informed consent was obtained from all the participants. Patients know the details of the experiment and are willing to take part in the research.
Neuropsychological measurements
According to the Hamilton Depression Rating Scale-17 item (HAMD-17) scores, 57 MSA patients were divided into two groups: 29 patients with depressive mood disorder and 28 patients without depressive mood disorder. HAMD-17 scores below 7 points indicated that the subject was normal or without depression symptoms. To reduce bias, a HAMD-17 score of ≥17 points indicated a significant depressive mood.Citation18,Citation19 The MMSE was used to assess the global cognitive function of each subject. The Unified Multiple System Atrophy Rating Scale (UMSARS) and the Hoehn and Yahr (H-Y) staging scale were used to assess the severity of MSA.Citation20 All the neurological evaluations were conducted preceding the MRI scan. All the participants were in the “off” state (ie, without an antidepressant medication use history and not having used dopamine for at least 12 hours).
Image acquisition
The RS functional image data were obtained using a 3.0 T MRI scanner (GE, Boston, MA, USA) equipped with an eight-channel head coil in the Department of Radiology. All the participants were instructed to keep calm with their eyes closed, but to stay awake. Foam pads and earplugs were used to reduce head motion and scanner noise, respectively. Functional images were acquired by using a gradient echo planar imaging sequence, paralleled to the anterior commissure–posterior commissure (AC-PC) plane. The parameters were as follows: TR =3,000 ms, TE =60 ms, flip angle =90°, field of view =24×24 cm, matrix =64×64, thickness =1.8 mm, and pixel size =3.75×3.75 mm. Three-dimensional T1-weighted images were acquired in a sagittal orientation employing a 3D-SPGR sequence. The parameters were as follows: TR =7.1 ms, TE =3.2 ms, flip angle =151°, thickness =1 mm, field of view =24×24 cm, and matrix =256×256. A total of 172 slices were collected from the 3D-T1 sequence, and 9,600 images were obtained by blood oxygenation level-dependent contrast.
Data preprocessing
Functional images were preprocessed with the SPM8 software (Statistical Parametric Mapping version 8; www.fil.ion.ucl.ac.uk/spm) and the DPABI (Data Processing and Analysis of Brain Imaging) software toolbox (http://rfmri.org/dpabi).Citation21 The first 10 volumes of each subject were discarded due to the inhomogeneity of the magnetic field. The remaining images were corrected by realignment, accounting for head motion. No subjects were excluded from the study because of having head motions exceeding 2.0 mm of translation, or 2.0° of rotation, throughout the course of the scan. Subsequently, the resulting images were spatially normalized to the T1 space, resampled to a voxel size of 3×3×3 mm, and spatially smoothened with a Gaussian kernel full width at half-maximum 6×6×6 mm. The resulting fMRI data were band pass filtered (0.01<f<0.08 Hz) to reduce for low-frequency drift and high-frequency physiological respiratory and cardiac noise. Any linear trend was then removed. There was no difference in the mean head motion (P>0.05). Thirty-four head motion parameters and the mean time series of global activities, white matter, and cerebrospinal fluid (CSF) signals were introduced as covariates into a random-effects model to remove possible effects of head motion, global, white matter, and CSF signals on the results. Finally, data scrubbing was performed to further compensate for motion, removing volumes with excessive movement.Citation22
FC and statistical analysis
FC
The left and right AMY were defined as region of interest (ROI), according to the automated anatomical labeling template, which was created by WFU_PickAtlas (http://www.ansir.wfubmc.edu).Citation23 The mean time series of the bilateral AMY were extracted. Voxel-wise FC analysis was performed by computing the temporal cross-correlation between the mean time series of each ROI and the time series of each voxel within the brain. The correlation coefficients of each voxel were normalized to Z-scores with Fisher’s r-to-z transformation. Then, an entire brain Z-score map was created for each ROI of each subject.
Statistical analyses
Statistical analyses of demographic and clinical data were completed using the SPSS version 22.0 software (IBM Corporation, Armonk, NY, USA). The Kolmogorov–Smirnov test was applied to evaluate the normality of continuous variables. For statistical analyses among DMSA patients, NDMSA patients, and HCs, one-way ANOVA, chi-squared test, or Kruskal–Wallis test followed by Bonferroni post hoc analysis was performed according to the category of variables, including age, gender, duration of education, MMSE score, and HAMD-17 score. A two-sample t-test and Mann–Whitney U test were performed between patient groups, including UMSARS, H-Y staging scale, and duration of illness. A threshold of P<0.05 was considered to be statistically significant.
Imaging data statistical analyses were performed by DPABI software. To explore FC differences among the three groups, one-way ANOVA was conducted with age, gender, years of education, and gray matter volume. MMSE subject scores were used as covariates in all the above analyses. UMSARS scores were also taken as covariates for analyses between DMSA and NDMSA patients to eliminate confounding factors, and AlphaSim multiple comparison correction was performed (voxel-level P-value <0.001; cluster-level significance threshold of P<0.001; left cluster size >64 voxels and right cluster size >57 voxels). Subsequently, post hoc tests for between-group differences were carried out within a mask presenting statistical significance in the ANOVA results. Post hoc analysis shared similar covariates and multiple comparison correction methods with ANOVA. Furthermore, to explore the relationship between seed-based FC abnormalities and the depression profile of the DMSA patients, correlation analyses between FC abnormality clusters and HAMD-17 scores of the DMSA patients were also performed. A threshold of P<0.05 was considered to be significantly different per the SPSS software.
Results
Demographics and clinical data
There was no significant difference among the DMSA, NDMSA, and HC groups in terms of age, sex distribution, and level of education. In addition, MMSE scores were not statistically different among the groups, and no subjects were excluded. Also, no significant differences were found among patient groups with respect to H-Y staging scale, duration of illness, levodopa equivalent dose (mg), or UMSARS score. As expected, there was a significant difference in HAMD-17 score among pairs of groups, as follows: DMSA patients vs HCs (P<0.00); DMSA patients vs NDMSA patients (P<0.00); and DMSA patients vs HCs (P<0.002). Further details are presented in .
Table 1 Demographics and clinical features among DMSA, NDMSA, and HCs
DMSA patients vs HCs
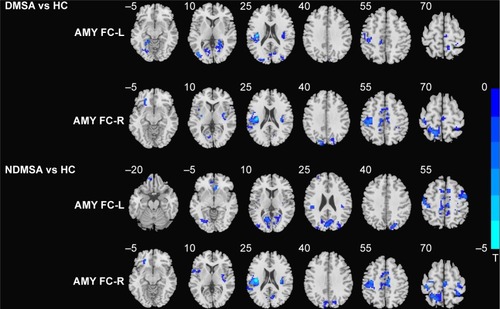
In comparison with the HCs, DMSA patients showed decreased left AMY FC with the left lingual gyrus, left fusiform gyrus, bilateral calcarine gyrus, left insula, and bilateral rolandic areas and decreased right AMY FC with the left lingual gyrus, left parahippocampal gyrus (PHG), left orbit frontal cortex, left middle occipital gyrus (MOG), left superior and middle temporal gyrus, left superior occipital gyrus, left postcentral lobe, right supply motor area, left cuneus, left precuneus lobe, left paracentral lobe, and left middle cingulum cortex (; ).
Table 2 Difference of functional connectivity between DMSA patients and HCs
Figure 1 Statistical parametric map showing the significant differences in left and right AMY FC differences between DMSA patients and HCs (left AMY, cluster size >14, P<0.001 and right AMY cluster size >9, P<0.001 AlphaSim corrected); differences between NDMSA and HC (left AMY, cluster size >47, P<0.001 and right AMY cluster size >64, P<0.001 AlphaSim corrected).
Abbreviations: AMY, amygdala; DMSA, multiple system atrophy patients with depression; FC, functional connectivity; HC, healthy control; L, left; NDMSA, multiple system atrophy patients without depression; R, right.
NDMSA patients vs HCs
As compared with the HCs, NDMSA patients showed decreased left AMY FC with left lingual, left fusiform, left middle frontal gyrus (MFG), left calcarine gyrus, left cuneus lobe, left superior occipital gyrus, left MOG, right insula, left superior temporal gyrus, left rolandic oper, right precentral gyrus, right postcentral gyrus, right supply motor area, right precuneus lobe, and right middle cingulum cortex. Decreased right AMY FC with the left superior frontal gyrus, bilateral insula, right putamen, left rolandic oper, left superior temporal gyrus, right calcarine gyrus, left cuneus lobe, left postcentral lobe, right supply motor area, right precentral gyrus, left superior parietal gyrus, and right middle cingulum cortex were also observed in the NDMSA group (; ).
Table 3 Difference of functional connectivity between NDMSA patients and HCs
DMSA patients vs NDMSA patients
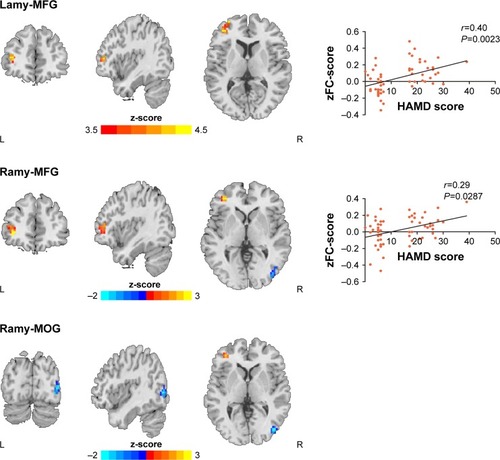
As compared with the NDMSA patients, the DMSA patients showed increase bilateral AMY FC with the left MFG while decreased right AMY FC with the right MOG (; ).
Table 4 Difference of functional connectivity between DMSA and NDMSA patients
Figure 2 Statistical parametric map showing the significant differences between DMSA and NDMSA patients (P<0.001, AlphaSim corrected); Blue denotes decreased FC in DMSA group than NDMSA group, red denotes increased FC in DMSA group than NDMSA group.
Abbreviations: AMY, amygdala; DMSA, multiple system atrophy patients with depression; FC, functional connectivity; HAMD, Hamilton Depression Rating Scale; MFG, middle frontal gyrus; MOG, middle occipital gyrus; NDMSA, multiple system atrophy patients without depression.
Correlation analyses
Within the depressed patient group, FC between the left AMY and left MFG was positively correlated with HAMD-17 scores (r=0.4, P=0.0023). Also, FC values between the right AMY and left MFG were positively correlated with HAMD-17 scores (r=0.29; P=0.0287). No associations were found for HAMD-17 scores and FC between the right MOG and the bilateral AMY (). The threshold was set at P<0.001 (AlphaSim corrected).
Discussion
The current study demonstrated that DMSA patients suffered from disrupted RS AMY–cortical FC in a set of brain regions, including the middle frontal cortex, the occipital visual cortex, the limbic areas, and the somatosensory areas as compared with NDMSA patients and HCs. Furthermore, the middle prefrontal cortex was correlated with the severity of clinical depression in the DMSA patients. To the best of our knowledge, this is the first study to examine the alterations of the AMY–cortical FC networks in DMSA patients. Our results may provide novel insights into the underlying neural mechanisms of MSA-related depression.
The middle prefrontal cortex is located in the dorsal prefrontal cortex (DLPFC), an area primarily involved in cognition and executive function. Increasing evidence has shown that the prefrontal cortex is responsible for top–down regulation of emotion and attention, and dysfunction in this area plays a role in the pathogenesis of primary depression patients.Citation24 RS-fMRI studies have shown that depressed idiopathic Parkinson’s disease patients had decreased right MFG degree centrality vs HCs.Citation25 Hamilton et alCitation26 reported that bilateral middle frontal cortex functional consistency was negatively correlated with HAMD-17 scores. Repetitive transcranial magnetic stimulation (rTMS) has been proven to be a powerful antidepressant intervention tool and has been widely investigated in the last two decades.Citation27,Citation28 Treatment-resistant depression (TRD) patients show a significant improvement of depressive symptoms after DLPFC high-frequency (5–20 Hz) rTMS treatment.Citation29,Citation30 The above-mentioned results indicate that the middle prefrontal cortex may be a key cortical pathogenesis hub that is associated with depression. In the present study, we found an increase in frontal-AMY FC between DMSA patients and NDMSA patients; furthermore, this finding was positively related to depressive scores. The current results are consistent with those of previous studies reporting an increased RS-FC of the DLPFC in subclinical depressive individuals.Citation31,Citation32 However, this is in contrast to a preponderance of findings showing decreased DLPFC activity in depressive patients.Citation33,Citation34 This discrepancy could be explained in part by differences in the neural basis between depression symptoms and depression. The medial prefrontal cortex is also a cortex hub for cognitive control in MSA.Citation35 In fact, cognitive impairment is one of the key characteristics of depressive patients.Citation36 We hypothesized that enhanced frontal-AMY functional coupling may reflect the need for more cognitive resources in MSA patients with severe depressive symptoms. Whatever, our results demonstrate that alteration in AMY– DLPFC functional coupling at rest is related to the existence of depression symptoms in MSA patients.
Decreased FC has been noted between the right AMY and the right middle occipital cortex in our study. This finding was in line with other studies that reported higher magnetization transfer ratio in the left occipital lobe in patients with TRD vs those without TRD.Citation37 By using arterial spin labeling, patients without TRD showed greater perfusion in the left occipital lobe.Citation38 MOG attains a functional specialization for spatial processing;Citation39 its activity in the depressed MSA patient could be influenced by AMY through various structural and functional connectivities. In relation to HCs, DMSA patients also showed decreased FC in the left lingual gyrus, bilateral calcarine gyrus, and left cuneus; notably, the aforementioned areas belong to the visual processing cortex. The performance of task-based fMRI proved that the processing of emotion involved multiple brain region activation, including not only limbic structures such as the AMY but also occipital and parietal visual regions.Citation32 The visual cortex participates in external stimuli perception and transfers this information to the brain regions that relate to emotion processing and response.Citation40 Interestingly, involved visual cortex functional abnormalities are mostly found in major depression disorder patients,Citation41 and depression severity is positively correlated with visual contrast sensitivity.Citation42 Although no associations were found between FC values in visual associative cortices and depression assessments, we speculate that these active regions may play an important role of either compensation or pathology in DMSA patients. Future multimodal studies combining positron-emission tomography (PET) imaging findings may help to clarify specific visual abnormalities of induced depression symptoms in MSA patients.
We observed decreased AMY connectivity in the left posterior cingulate cortex (PCC), the left PHG, and the left insula. Through functional and structural connectivity with other limbic structures and the AMY, the PCC and PHG play an important role in memory and emotional regulation.Citation43,Citation44 The insula has extensive connections to several areas of the cortex and limbic system implicated in affectivity processes,Citation45 with both belonging to limbic circuits. Neurobiological evidence has demonstrated that AMY limbic dysfunction may contribute to depression symptoms.Citation14,Citation15,Citation25 Decreased AMY–limbic areas in our study may reflect an emotion processing bias in DMSA patients vs in HCs.
Aside from the above findings, DMSA patients also showed extensive AMY FC changes located in wider motor areas, such as the left primary somatosensory cortex and the left supply motor area, when compared with the HCs. Only one previous study in the literature, which involved a small sample size, showed that frontal dysfunction may contribute to depression associated with MSA and progressive supra nuclear palsy,Citation29 and, notably, no motor-related brain areas were involved in this study. Different methods and sample sizes among the two studies may account for the inconsistent findings. This study used PET to directly compare DMSA patients with HCs. Our results are second to AMY RS-FC toward depression symptoms in MSA patients. Interestingly, a number of recent studies have found that patients with depression show extensive functional abnormalities in the motor cortex.Citation15,Citation25,Citation46 Accordingly, we speculate that some of these structures are also involved in nonmotor functions, including emotional regulation. Future studies should investigate correlations between motor impairment and depression symptoms in MSA patients.
Limitations
There were limitations in the current study. First, the fact that MSA patients with severe depression symptoms were recruited into our study may somewhat reduce the confounding effect by overlapping motor and nonmotor symptoms to a large degree,Citation47 but it may also introduce new bias. Thus, the function underlying different degrees of depressive symptoms needs to be explored using a more detailed scale assessment. Second, the use of a small sample size (29 DMSA and 28 NDMSA patients) may reduce the generalization of our findings. Finally, MSA patients had two different clinical variants (ie, parkinsonism types [MSA-P] and cerebellum types [MSA-C]). More severe depression symptoms were reported in MSA-P patients than in MSA-C patients in the previous study.Citation3 However, both MSA-P and MSA-C share the same GCI pathology.Citation9 Additional studies with large sample sizes may clarify the AMY-induced depression symptoms between the two subtypes.
Conclusion
In the current study, we chose bilateral AMY as the ROI to investigate the RS disconnectivity pattern in DMSA and NDMSA patients. We identified abnormal FC in DLPFC, MOG, the limbic system, and the motor cortex of DMSA patients. Furthermore, the alteration of AMY FC toward DLPFC is associated with clinical depression scores. Our findings suggest that abnormal AMY–MFG circuits may play an important role in the progression of depression in MSA. Our study provides a significant step forward in the understanding of the neural mechanisms of DMSA.
Author contributions
Bin Zhao contributed to study design, neurological assessments, and writing the manuscript. Hu Liu and Huanhuan Li involved in image processing. Hu Liu and Bin Zhao performed statistical analyses. Xiuli Shang provided critical revision of the manuscript. All authors contributed to data analysis, drafting and revising the article, gave final approval of the version to be published, and agree to be accountable for all aspects of the work.
Acknowledgments
We thank LetPub (www.letpub.com) for its linguistic assistance during the preparation of this manuscript. We also thank all the participants and their families.
Disclosure
The authors report no conflicts of interest in this work.
References
- StefanovaNWenningGKReview: multiple system atrophy: emerging targets for interventional therapiesNeuropathol Appl Neurobiol2016421203226785838
- ZhangLYCaoBZouYTDepression and anxiety in multiple system atrophyActa Neurol Scand20181371333728748633
- ZhangLCaoBOuRNon-motor symptoms and the quality of life in multiple system atrophy with different subtypesParkinsonism Relat Disord201735636827993522
- Benrud-LarsonLMSandroniPSchragALowPADepressive symptoms and life satisfaction in patients with multiple system atrophyMov Disord200520895195715782421
- HamannSCognitive and neural mechanisms of emotional memoryTrends Cogn Sci20015939440011520704
- YoungKDSiegleGJZotevVRandomized clinical trial of real-time fMRI amygdala neurofeedback for major depressive disorder: effects on symptoms and autobiographical memory recallAm J Psychiatry2017174874875528407727
- YoungKDSiegleGJBodurkaJDrevetsWCAmygdala activity during autobiographical memory recall in depressed and vulnerable individuals: association with symptom severity and autobiographical overgeneralityAm J Psychiatry20161731788926541813
- BurghyCAStodolaDERuttlePLDevelopmental pathways to amygdala-prefrontal function and internalizing symptoms in adolescenceNat Neurosci201215121736174123143517
- CykowskiMDCoonEAPowellSZExpanding the spectrum of neuronal pathology in multiple system atrophyBrain2015138Pt 82293230925981961
- KielyAPAsiYTKaraEα-Synucleinopathy associated with G51D SNCA mutation: a link between Parkinson’s disease and multiple system atrophy?Acta Neuropathol2013125575376923404372
- CordesDHaughtonVMArfanakisKFrequencies contributing to functional connectivity in the cerebral cortex in “resting-state” dataAJNR Am J Neuroradiol20012271326133311498421
- ZhengKZWangHNLiuJIncapacity to control emotion in major depression may arise from disrupted white matter integrity and OFC-amygdala inhibitionCNS Neurosci Ther201824111053106229368421
- XiaWLuoYChenYCDisrupted functional connectivity of the amygdala is associated with depressive mood in type 2 diabetes patientsJ Affect Disord201822820721529272791
- HuXSongXYuanYAbnormal functional connectivity of the amygdala is associated with depression in Parkinson’s diseaseMov Disord201530223824425545969
- ChenHJWangYFQiRAltered amygdala resting-state functional connectivity in maintenance hemodialysis end-stage renal disease patients with depressive moodMol Neurobiol20175432223223326941102
- HertingBBeuthien-BaumannBPöttrichKPrefrontal cortex dysfunction and depression in atypical parkinsonian syndromesMov Disord200722449049717260333
- GilmanSWenningGKLowPASecond consensus statement on the diagnosis of multiple system atrophyNeurology200871967067618725592
- ZimmermanMMartinezJHYoungDChelminskiIDalrympleKSeverity classification on the Hamilton Depression Rating ScaleJ Affect Disord2013150238438823759278
- PengWMaoLYinDFunctional network changes in the hippocampus contribute to depressive symptoms in epilepsySeizure201860162229883917
- WenningGKTisonFSeppiKMultiple System Atrophy Study GroupDevelopment and validation of the Unified Multiple System Atrophy Rating Scale (UMSARS)Mov Disord200419121391140215452868
- YanCGWangXDZuoXNZangYFDPABI: Data Processing & Analysis for (Resting-State) Brain ImagingNeuroinformatics201614333935127075850
- CiricRWolfDHPowerJDBenchmarking of participant-level confound regression strategies for the control of motion artifact in studies of functional connectivityNeuroimage201715417418728302591
- MaldjianJALaurientiPJKraftRABurdetteJHAn automated method for neuroanatomic and cytoarchitectonic atlas-based interrogation of fMRI data setsNeuroimage20031931233123912880848
- KerestesRDaveyCGStephanouKWhittleSHarrisonBJFunctional brain imaging studies of youth depression: a systematic reviewNeuroimage Clin2014420923124455472
- WangHChenHWuJAltered resting-state voxel-level whole-brain functional connectivity in depressed Parkinson’s diseaseParkinsonism Relat Disord201850748029449183
- HamiltonJPEtkinAFurmanDJLemusMGJohnsonRFGotlibIHFunctional neuroimaging of major depressive disorder: a meta-analysis and new integration of base line activation and neural response dataAm J Psychiatry2012169769370322535198
- BajboujMAustSSpiesJPsychotherapyPlus: augmentation of cognitive behavioral therapy (CBT) with prefrontal transcranial direct current stimulation (tDCS) in major depressive disorder-study design and methodology of a multicenter double-blind randomized placebo-controlled trialEur Arch Psychiatry Clin Neurosci Epub2017126
- PalmUSchillerCFintescuZTranscranial direct current stimulation in treatment resistant depression: a randomized double-blind, placebo-controlled studyBrain Stimul20125324225121962978
- LamRWChanPWilkins-HoMYathamLNRepetitive transcranial magnetic stimulation for treatment-resistant depression: a systematic review and metaanalysisCan J Psychiatry200853962163118801225
- SchutterDJAntidepressant efficacy of high-frequency transcranial magnetic stimulation over the left dorsolateral prefrontal cortex in double-blind sham-controlled designs: a meta-analysisPsychol Med2009391657518447962
- ColichNLFoland-RossLCEgglestonCSinghMKGotlibIHNeural aspects of inhibition following emotional primes in depressed adolescentsJ Clin Child Adolesc Psychol2016451213025635920
- ColichNLHoTCFoland-RossLCHyperactivation in cognitive control and visual attention brain regions during emotional interference in adolescent depressionBiol Psychiatry Cogn Neurosci Neuroimaging20172538839528890942
- MurroughJWAbdallahCGAnticevicAReduced global functional connectivity of the medial prefrontal cortex in major depressive disorderHum Brain Mapp20163793214322327144347
- LiuWMaoYWeiDStructural asymmetry of dorsolateral prefrontal cortex correlates with depressive symptoms: evidence from healthy individuals and patients with major depressive disorderNeurosci Bull201632321722627015663
- FiorenzatoEWeisLSeppiKMovement Disorders Society MSA (MODIMSA) Neuropsychology and Imaging Study GroupsBrain structural profile of multiple system atrophy patients with cognitive impairmentJ Neural Transm (Vienna)2017124329330227778099
- YoshimuraSOkamotoYOnodaKCognitive behavioral therapy for depression changes medial prefrontal and ventral anterior cingulate cortex activity associated with self-referential processingSoc Cogn Affect Neurosci20149448749323327934
- JiaZPengWChenZMagnetization transfer imaging of treatment-resistant depressionRadiology2017284252152928318404
- LuiSParkesLMHuangXDepressive disorders: focally altered cerebral perfusion measured with arterial spin-labeling MR imagingRadiology2009251247648419401575
- RenierLAAnurovaIDe VolderAGCarlsonSVanmeterJRauscheckerJPPreserved functional specialization for spatial processing in the middle occipital gyrus of the early blindNeuron201068113814820920797
- AdolphsRThe neurobiology of social cognitionCurr Opin Neurobiol200111223123911301245
- JaworskaNYangXRKnottVMacQueenGA review of fMRI studies during visual emotive processing in major depressive disorderWorld J Biol Psychiatry201516744847124635551
- FamJRushAJHaalandBBarbierSLuuCVisual contrast sensitivity in major depressive disorderJ Psychosom Res2013751838623751244
- DisnerSGBeeversCGHaighEABeckATNeural mechanisms of the cognitive model of depressionNat Rev Neurosci201112846747721731066
- MaddockRJGarrettASBuonocoreMHPosterior cingulate cortex activation by emotional words: fMRI evidence from a valence decision taskHum Brain Mapp2003181304112454910
- SimmonsWKAveryJABarcalowJCBodurkaJDrevetsWCBellgowanPKeeping the body in mind: insula functional organization and functional connectivity integrate interoceptive, exteroceptive, and emotional awarenessHum Brain Mapp201334112944295822696421
- LouYHuangPLiDAltered brain network centrality in depressed Parkinson’s disease patientsMov Disord201530131777178426180026
- LeentjensAFVerheyFRLuijckxGJTroostJThe validity of the Beck Depression Inventory as a screening and diagnostic instrument for depression in patients with Parkinson’s diseaseMov Disord20001561221122411104209