
Abstract
Purpose
Obesity is a complex and multifactorial disease identified as a global epidemic. Convergent evidence indicates that obesity differentially influences patients with neuropsychiatric disorders providing a basis for hypothesizing that obesity alters brain structure and function associated with the brain’s propensity toward disturbances in mood and cognition. Herein, we characterize alterations in brain structures and networks among obese subjects (ie, body mass index [BMI] ≥30 kg/m2) when compared with non-obese controls.
Patients and methods
We obtained noninvasive diffusion tensor imaging and generalized q-sampling imaging scans of 20 obese subjects (BMI=37.9±5.2 SD) and 30 non-obese controls (BMI=22.6±3.4 SD). Graph theoretical analysis and network-based statistical analysis were performed to assess structural and functional differences between groups. We additionally assessed for correlations between diffusion indices, BMI, and anxiety and depressive symptom severity (ie, Hospital Anxiety and Depression Scale total score).
Results
The diffusion indices of the posterior limb of the internal capsule, corona radiata, and superior longitudinal fasciculus were significantly lower among obese subjects when compared with controls. Moreover, obese subjects were more likely to report anxiety and depressive symptoms. There were fewer structural network connections observed in obese subjects compared with non-obese controls. Topological measures of clustering coefficient (C), local efficiency (Elocal), global efficiency (Eglobal), and transitivity were significantly lower among obese subjects. Similarly, three sub-networks were identified to have decreased structural connectivity among frontal–temporal regions in obese subjects compared with non-obese controls.
Conclusion
We extend knowledge further by delineating structural interconnectivity alterations within and across brain regions that are adversely affected in individuals who are obese.
Introduction
Obesity is operationalized by the WHO as a body mass index (BMI) (ie, weight in kilograms/height in meterCitation2) of 30 or greater; however, disparate BMI thresholds for obesity have been reported across global regions (eg, North America vs Asia).Citation1,Citation2 Obesity is a complex and multifactorial disease that represents one of the leading challenges in chronic disease prevention worldwide.Citation3 According to the WHO, ~2.8 million people die each year due to overweight/obesity with an estimated 35.8 million global disability-adjusted life years being attributable to obesity in the absence of other medical comorbidities.Citation4 Replicated evidence also indicates that obesity significantly increases the risk for, exacerbates the course of, and significantly reduces overall health outcomes for a multitude of chronic diseases including, but not limited to, disturbances in the metabolic milieu (eg, hypertension, dyslipidemia, and metabolic syndrome), cardiovascular disease, autoimmune diseases, and cancers (eg, breast, colon, and prostate).Citation3,Citation5–Citation7 Furthermore, available data indicate that obesity differentially affects individuals with neuropsychiatric disorders, influencing illness trajectory and progression.Citation8–Citation11 Notwithstanding, the mediators of the association between obesity and adverse brain function are insufficiently characterized. Replicated evidence suggests that the metabolic–immunoinflammatory interface is a critical moderator of the differential effects of obesity on individuals with a neuropsychiatric illness.Citation10–Citation13
The hypothesis of our study was that the main cause of obesity was due to metabolic problems, which may lead to changes in nerve fibers.Citation10–Citation13 Obesity was thought to be associated with dopaminergic pathways that can regulate rewarding processes.Citation14 Therefore, when dopamine receptor decreased, it will reduce the sensitivity to natural rewards. Rewarding processes play a critical role in brain processes that regulate human eating behavior and food intake. In addition to obesity, accumulation of fat in the body may also have an important effect on brain function and optimal body composition maintenance (ie, optimal body fat to muscle ratio).Citation15 Moreover, available data suggested that overweight/obesity influences structural and functional changes in patients with neuropsychiatric disorders (eg, anxiety and depression), provides a basis for hypothesizing that overweight/obesity alters brain structure and function, increasing the brain’s propensity toward disturbances in mood and cognition.Citation8,Citation16–Citation18
Obesity is increasingly being recognized as having a significant impact on both brain structure and function. For example, obesity has been evinced to produce differential activation of brain functional regions or networks among individuals with obesity when compared with non-obese controls.Citation16 Moreover, the convergence of replicated evidence indicating that overweight/obesity influences structural and functional changes in patients with neuropsychiatric disorders (eg, anxiety and depression), provides a basis for hypothesizing that overweight/obesity alters brain structure and function, increasing the brain’s propensity toward disturbances in mood and cognition.Citation8,Citation16–Citation18
Diffuse tensor imaging (DTI) was used to investigate neurological disease, such as epilepsy, Parkinson’s disease and Alzheimer’s disease.Citation19–Citation21 Marqués-Iturria et al used DTI to reconstruct and compare obese (n=31) and non-obese (n=32) subjects’ brain reward networks based on white matter volume and microstructure, the authors reported that obese subjects displayed a lower number of fibers and decreased integrity of connections in addition to reduced network clustering strength among the orbitofrontal cortex and striatum nuclei including the accumbens, caudate, and putamen when compared with non-obese subjects.Citation22 In a separate study, Kullmann et al used DTI and multiparametric mapping to examine the effect of increasing BMI among lean, overweight, and obese subjects on brain white matter.Citation23
Results indicated that white matter structures showed reduced myelin and increased water with increasing BMI in the corticospinal tract and fiber tracts linking limbic structures with prefrontal regions.Citation23 The foregoing observations were interpreted by the authors as having the potential to accelerate cognitive decline among obese individuals, which comport with existing literature on the differential impact of obesity in individuals with neuropsychiatric disorders, representing a pathophysiological nexus sub-serving the multiplicative interaction between obesity, mood, and cognition.Citation10,Citation23–Citation26
A conceptual framework for brain research that was recently proposed describes the “connectome”.Citation27,Citation28 The “connectome” provides novel insights to various brain functions and structural organization by modeling the complex networks of the human brain, allowing researchers to investigate the segregation and integration of information processing. The foregoing analyses are accomplished based on topology and graph theoretical analysis (GTA), which provides a quantitative method of identifying nodes, edges, and disparate topological parameters, including, but not limited to, clustering coefficient(s), characteristic path length(s), and small-worldness (ie, high levels of local clustering among nodes of a network and short paths that globally link all nodes of the network).Citation29,Citation30
In keeping with the “connectome” conceptual framework, we used noninvasive DTI and generalized q-sampling imaging (GQI) to identify altered brain structure(s)/networks between obese subjects and non-obese healthy controls (HC). GQI was used to overcome limitations including, but not limited to the resolution of complicated neural structures (eg, fiber crossings) and the detection of structural changes in gray matter.Citation31–Citation33 The correlation between diffusion indices with subjects’ BMI and Hospital Anxiety and Depression Scale (HADS) ratings were also calculated. In addition, GTA and network-based statistical (NBS) analysis were also used to identify the structural network differences between the two groups.Citation27,Citation34
Patients and methods
Subjects and clinical characteristics
A total of 50 subjects, including 20 obese subjects (BMI=37.9±5.2) and 30 age- and sex-matched non-obese controls (BMI=22.6±3.4) were recruited in this study. Obese subjects are recruited from patients who are going to the outpatient clinic for a stomach reduction surgery. This study was conducted in accordance with the Declaration of Helsinki, and written informed consent was obtained from all subjects. The study was approved by the Institutional Review Board of Jen-Ai Hospital, Taichung, Taiwan (IRB No 104-3465B), and all research was performed in accordance with relevant guidelines and regulations. Subjects’ baseline anxiety and/or depressive symptoms were evaluated using the HADS prior to DTI and GQI. The HADS is a 14-item scale with 7 items to assess anxiety and depressive symptoms, respectively. Each of the 14 items is scored from 0 to 3 with a maximum score of 21. Total scores above 7 indicate clinically significant anxiety and depressive symptoms; a total score exceeding 10 suggests moderate-to-severe symptoms ().
Table 1 Demographic and clinical characteristics
Exclusion criteria for all subjects included a history of any psychiatric or neurological illnesses (eg, schizophrenia) or substance dependence and/or use disorders, no family history of major neuropsychiatric or serious medical illnesses and not currently taking any prescription or psychotropic medications. The exclusion criteria also included those who were pregnant or breastfeeding, or those with metallic implants or other known contraindications to MRI.
MRI data acquisition
All images were acquired using a 1.5T MRI system (Ingenia, Philips, the Netherlands). Echo planar diffusion images were obtained with repetition time/echo time=3,279/110 ms, field of view=224×224 mm2, matrix=128×128, slices=40, in-plane resolution=1.75×1.75 mm2, slice thickness=3 mm, 67 non-collinear diffusion-weighting gradient direction with b=1,000 and 2,000 s/mm2 and one additional image without diffusion weighting (b=0 s/mm2). The scan time for each subject was ~20 minutes.
Diffusion image analysis
Each subject’s original diffusion image was completed with Eddy Current Correction using FSL (FMRIB Software Library, Oxford, UK). Images were then spatially normalized to the Montreal Neurological Institute T2-weighted imaging template using parameters determined from the normalization of the diffusion null image to the T2-weighted imaging template using Statistical Parametric Mapping (SPM8, Wellcome Department of Cognitive Neurology, London, UK). Images were resampled with a final voxel size of 2×2×2 mm3. DTI and GQI reconstruction were performed using DSI Studio (National Taiwan University, Taipei, Taiwan). For the DTI analysis, the fractional anisotropy (FA), mean diffusivity (MD), axial diffusivity (AD), and radial diffusivity (RD) mapping were calculated. For the GQI analysis, the generalized fractional anisotropy (GFA), isotropic value of the orientation distribution function (ISO), and normalized quantitative anisotropy (NQA) mapping were calculated. For the voxel-based statistical analysis, analysis of covariance (ANCOVA) was used to test for statistical significance. In addition, multiple regression was used to detect the correlation between the diffusion (DTI and GQI) indices and BMI as well as HADS scores for all 50 subjects. In the ANCOVA, age and sex, both of which were significantly different between groups, were used as covariates.
Graph theoretical and NBS analyses
The structural connectivity matrix of obese subjects (n=20) and non-obese HC (n=30) was obtained by DTI and GQI whole-brain tractography with FA and NQA threshold of 0.15, respectively, and max angle of 70°. The individual structural connectivity matrix (fiber number × FA or NQA/mean fiber length) of each subject with a size of 90×90 could be output followed by importation of ROIs based on the Automated Anatomical Labeling.
Graph theoretical and NBS (Melbourne Neuropsychiatry Center, The University of Melbourne and Melbourne Health, Australia) analyses were applied to investigate systematic alterations of whole-brain structural topological organization and structural connectivity between the two groups. GTA was performed on the interregional connectivity matrix by using Graph Analysis Toolbox (GAT, Stanford University School of Medicine, Stanford, CA, USA). In the ANCOVA, age and sex, both of which were significantly different between groups, were used as covariates. The topological measures of structural brain networks were calculated, including clustering coefficient (C), normalized clustering coefficient (γ), local efficiency (Elocal), characteristic path length (L), normalized characteristic path length (λ), global efficiency (Eglobal), small-worldness index (σ), assortativity, transitivity, and modularity. Both P-value <0.05 for the permutation test in GTA and the two-sample t-test in NBS were considered to indicate statistical significance. The BrainNet viewer was used to visualize significant differences in sub-networks between the two groups revealed from NBS analysis.
Results
Altered DTI indices between obese subjects and non-obese HCs
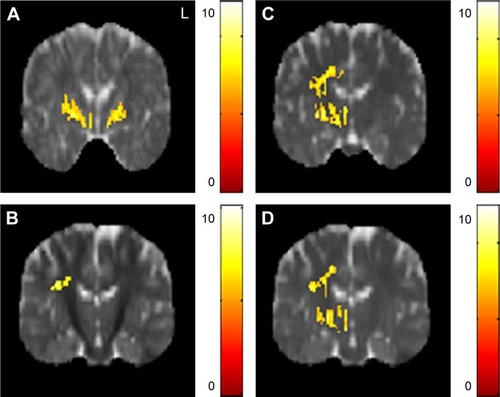
The AD value of the posterior limb of internal capsule was lower in the obese subjects compared with the non-obese HC. The RD value of the superior corona radiata was lower in the obese subjects compared with the non-obese HC. The MD values of posterior limb of internal capsule and superior longitudinal fasciculus were also lower in the obese subjects compared with the non-obese HC ().
Figure 1 The significant differences of DTI indices between obese subjects and non-obese HC.
Abbreviations: AD, axial diffusivity; DTI, diffusion tensor imaging; FDR, false discovery rate; HC, healthy controls; MD, mean diffusivity; RD, radial diffusivity.
The correlation between DTI indices, BMI, and HADS scores
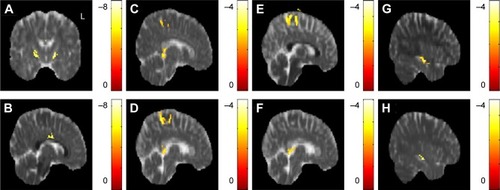
In the correlation between DTI indices, BMI, and HADS scores, a significant negative correlation between BMI and the AD value in the posterior limb of the internal capsule was observed across all subjects (N=50). A significant negative correlation was also observed between BMI and RD values in the corpus callosum (). There was no significant correlation between BMI and the FA, MD value. A significant negative correlation between anxiety scores and AD values in the corpus callosum and superior frontal blade was observed; in addition, a significant negative correlation between anxiety scores and RD value was observed in the superior frontal blade (). There was no signifi-cant correlation between anxiety scores and FA, MD value. A significant negative correlation between depression scores and AD value in the corpus callosum was also found, as was a significant negative correlation between depression scores and RD value in the sagittal stratum. A significant positive correlation between depression scores was also observed between depression scores and MD value (). There was no significant correlation between depression scores and FA value.
Figure 2 The correlation between DTI indices, BMI, and HADS scores.
Abbreviations: AD, axial diffusivity; BMI, body mass index; DTI, diffusion tensor imaging; FDR, false discovery rate; HADS, Hospital Anxiety and Depression Scale; MD, mean diffusivity; RD, radial diffusivity.
Altered GQI indices between obese subjects and non-obese HCs
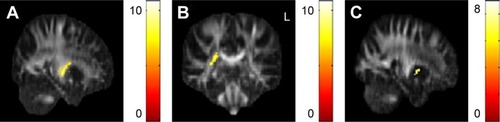
The GFA values of the posterior limb of the internal capsule and posterior corona radiata were significantly lower in the obese subjects compared with the non-obese HC. The NQA values of the lentiform nucleus were also significantly lower in the obese subjects compared with non-obese HC ().
Figure 3 The significant differences of GQI indices between obese subjects and non-obese HC.
Abbreviations: AD, axial diffusivity; DTI, diffusion tensor imaging; GQI, generalized q-sampling imaging; HC, healthy controls; MD, mean diffusivity.
The correlation between the GQI indices, BMI, and HADS scores
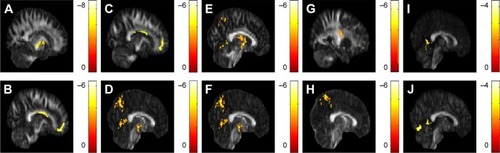
In the correlation between the GQI indices, BMI, and HADS scores, a significant negative correlation between BMI and the GFA value in the posterior limb of the internal capsule was observed; likewise, a significant negative correlation between BMI and NQA values in the corpus callosum and superior frontal blade were observed across all subjects (N=50) (). A significant negative correlation between anxiety scores and GFA values in the posterior cingulate, lentiform nucleus, and precuneus was observed. Significant negative correlation between anxiety scores and NQA value in the superior corona radiata was also observed (). A significant negative correlation between depression scores and the GFA value in the precuneus was observed in addition to a significant negative correlation between NQA values in the posterior cingulate and lingual gyrus (). There was no significant correlation between BMI, anxiety scores, depression scores, and ISO values.
Figure 4 The correlation between GQI indices, BMI, and HADS scores.
Abbreviations: BMI, body mass index; FDR, false discovery rate; GFA, generalized fractional anisotropy; GQI, generalized q-sampling imaging; HADS, Hospital Anxiety and Depression Scale; NQA, normalized quantitative anisotropy.
Graph theoretical and NBS analyses
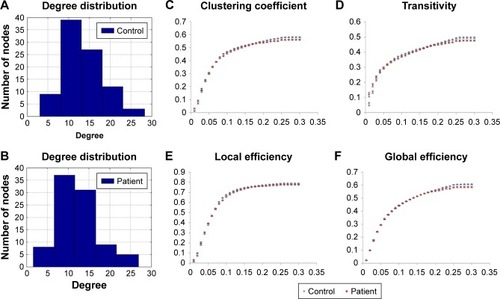
For the DTI analysis, there were no significant differences in any topological measures between obese subjects and non-obese HC. For the GQI analysis, there were fewer connections of structural networks found in the obese subjects compared with non-obese HC in high node degree regime (). The topological measures of C, Elocal, Eglobal, and transitivity were significantly lower in obese subjects compared with non-obese HC (), while no significant differences were observed for other topological measures between the two groups.
Figure 5 The degree of distribution in the structural network of (A) non-obese healthy controls and (B) obese subjects by graph theoretical analysis with GQI. (C–F) The topological measures of structural networks in obese subjects and non-obese HC by graph theoretical analysis with GQI (P<0.05, corrected by FDR).
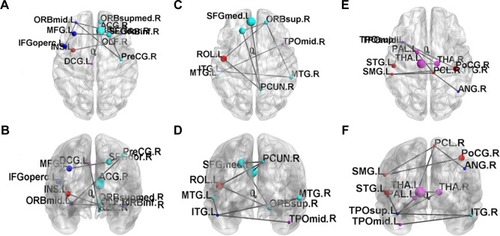
Three networks were identified by the NBS (P<0.001, corrected), exhibiting decreased structural connectivity among frontal–temporal regions in obese subjects (). The weakened connectivity within sub-networks comprised edges between the right precentral gyrus, right superior frontal gyrus, left middle frontal gyrus (including pars orbitalis), left inferior frontal gyrus (pars opercularis), right inferior frontal gyrus (pars orbitalis), right olfactory, right middle frontal gyrus (pars orbitalis), right rectus, left insula, right anterior cingulum, and left middle cingulum (); between the left superior frontal gyrus, right superior frontal gyrus (pars orbitalis), left rolandic operculum, right precuneus, left superior medial frontal gyrus, bilateral middle temporal gyrus, left inferior temporal gyrus and right middle temporal pole (); and between the right postcentral gyrus, left supramarginal gyrus, right paracentral lobule, right angular gyrus, left globus pallidum, bilateral thalamus, left superior temporal pole, left superior temporal gyrus, right inferior temporal gyrus, and left middle temporal pole ().
Figure 6 The disrupted sub-networks of obese subjects identified by the NBS with GQI (P<0.001, corrected by FDR).
Discussion
We found that the diffusion indices of the posterior limb of the internal capsule, corona radiate, superior longitudinal fasciculus, and lentiform nucleus were lower in obese subjects when compared with non-obese HC. The obese subjects were more likely to have feelings of anxiety and depression. For GTA, the lower global integration and local segregation of the structural brain networks were found in the obese subjects. In addition, three networks showed decreased structural connectivity within frontal–temporal regions in the obese subjects.
The identified brain structures are involved in neural networks associated with feeding behaviors (eg, reward, motivation, and control).Citation35–Citation40 The foregoing observation comports with phenomenological evidence of higher prevalence of eating disorders among obese individuals and vice versa.Citation41,Citation42 Obesity has been proposed to be associated with dopaminergic pathways that can regulate rewarding processes.Citation14 Therefore, when dopamine receptor decreases, it will reduce the sensitivity to natural rewards. Reward processes play a critical role in regulating human eating behavior and food intake. For example, a previous study reported that a decrease in dopamine receptor activity results in a sharp increase in the consumption of high-fat foods.Citation15 In addition, lower number of fibers and integrity of connections in the reward system are correlated with obesity.Citation22 Similarly, neural networks that are highly interconnected and modulate the body shape processing (eg, frontal-temporal regions) have been found to be underactive in people with an eating disorder.Citation43,Citation44 Taken together, brain circuits and networks that modulate reward sensitivity, self-perception, and feeding behavior may be altered in obese individuals.
A higher incidence of anxiety and depressive disorders has been observed in populations with an eating disorder.Citation45 Similarly, when compared with non-obese individuals, obese participants were more likely to have depressive symptoms, and the higher prevalence of obesity among populations with mood disorders.Citation46,Citation47 Furthermore, obesity may adversely affect treatment outcomes in patients with neuropsychiatric disorders. After evaluating the impact of weight on the treatment of patients with major depressive disorder, patients with high BMI showed a significantly slower clinical response than patients with normal BMI during antidepressant treatment.Citation48 Therefore, we can know that obesity lead to unfavorable treatment outcome of patients with major depressive disorder.
We identified alterations in the posterior limb of the internal capsule, corona radiata, and superior longitudinal fasciculus among obese subjects when compared with controls, implicating changes in the frontal gyrus, cingulate, lentiform nucleus, and precuneus. Frontal gyrus activity has been implicated to moderate food intake avoidance.Citation35 A separate study also reported that decreased activity in the frontal cortex bilaterally is associated with subjects reporting a loss of control over their eating behaviors.Citation36 The cingulate cortex has been described as being involved in compensatory mechanisms, which increase the likelihood of engaging in healthier behaviors (eg, exercise) as well as being more receptive to education (eg, weight control advice).Citation37,Citation38 Mounting evidence suggests that the lentiform nucleus is a critical structure in the modulation of the reward circuit, wherein excess weight may negatively impact reward circuit processing.Citation39,Citation49
The strength of our study is that in addition to identifying altered brain structures between obese subjects and non-obese HCs, we observe structural brain network to investigate the segregation and integration of information processing. The limitation of this study is that we did not use the mini-mental state examination score to test the cognitive function of all subjects.
Conclusion
Our results indicate that the structural connectivity of the posterior limb of the internal capsule, corona radiata, superior longitudinal fasciculus, and lentiform nucleus were lower in obese subjects compared with non-obese HC. The obese subjects were more likely to have feelings of anxiety and depression. The lower global integration and local segregation of the structural brain networks were also found in the obese subjects. In addition, three networks showed decreased structural connectivity among frontal-temporal regions in the obese subjects. Our results reinforce further the observation that obesity is associated with abnormal brain structure and function. We extend knowledge further by delineating structural interconnectivity alterations within and across brain regions that are adversely affected in individuals who are obese. Translationally, the link between obesity and adverse brain outcomes have significant public health implications in light of the global obesity epidemic. Moreover, it is a testable hypothesis that treatment and prevention strategies that aim to normalize body weight may exert salutary effects on brain structure and function.
Author contributions
VCHC: project idea, study design, manuscript revision; YCL: data analysis, writing article; SHC: data collection; RSM: manuscript revision; DSC: manuscript revision; YL: manuscript revision; JCW: project idea, study design, software development, data analysis, writing article, manuscript revision. All authors contributed to data analysis, drafting and revising the article, gave final approval of the version to be published, and agree to be accountable for all aspects of the work.
Acknowledgments
This study was supported by the research programs NSC103-2420-H-182A-001 and MOST106-2221-E-182-079, which were sponsored by the Ministry of Science and Technology, Taipei, Taiwan. The authors appreciate the full support from the Department of Radiology, Jen-Ai Hospital, Taichung, Taiwan, and the Health Information and Epidemiology Laboratory (CLRPG6G0041), Chang Gung Memorial Hospital, Chiayi, Taiwan. The authors would like to thank Hsiang-Ya Huang and I Ieng Chao for their assistance in experimental preparation.
Disclosure
The authors report no conflicts of interest in this work.
References
- WHO Expert ConsultationAppropriate body-mass index for Asian populations and its implications for policy and intervention strategiesLancet2004363940315716314726171
- WHOObesity verweight2017 Available from: http://www.who.int/news-room/fact-sheets/detail/obesity-and-overweightAccessedNovember 6, 2018
- HrubyAHuFBThe epidemiology of obesity: a big picturePharmacoeconomics201533767368925471927
- WHOObesity: Situation and trends Available from: http://www.who.int/gho/ncd/risk_factors/overweight/en/Accessed November 6, 2018
- SlyepchenkoAMaesMJackaFNGut microbiota, bacterial trans-location, and interactions with diet: pathophysiological links between major depressive disorder and non-communicable medical comorbiditiesPsychother Psychosom2017861314627884012
- WooYSMcIntyreRSKimJBAssociation of treatment response with obesity and other metabolic risk factors in adults with depressive disorders: Results from a National Depression Cohort study in Korea (the CRESCEND study)J Affect Disord201620319019827310099
- MansurRBBrietzkeEMcIntyreRSIs there a “metabolic-mood syndrome”? A review of the relationship between obesity and mood disordersNeurosci Biobehav Rev2015528910425579847
- MansurRBBrietzkeEMcIntyreRSBDNF and BMI effects on brain structures of bipolar offspring: results from the global mood and brain science initiativeActa Psychiatr Scand2017136660761429023633
- LeclercEMansurRBGrassi-OliveiraRThe differential association between history of childhood sexual abuse and body mass index in early and late stages of bipolar disorderJ Affect Disord201822721421829102835
- MansurRBMcIntyreRSCaoBObesity and frontal-striatal brain structures in offspring of individuals with bipolar disorder: Results from the global mood and brain science initiativeBipolar Disord2018201424828944976
- LeeJHParkSKRyooJHU-shaped relationship between depression and body mass index in the Korean adultsEur Psychiatry201745728028738292
- CizzaGRotherKIBeyond fast food and slow motion: weighty contributors to the obesity epidemicJ Endocrinol Invest201235223624222183119
- ScarpinaFMiglioratiDMarzulloPMauroAScacchiMCostantiniMAltered multisensory temporal integration in obesitySci Rep201662838227324727
- VolkowNDWangGJBalerRDReward, dopamine and the control of food intake: implications for obesityTrends Cogn Sci2011151374621109477
- KrishnaSKeralapurathMMLinZNeurochemical and electrophysiological deficits in the ventral hippocampus and selective behavioral alterations caused by high-fat diet in female C57BL/6 miceNeuroscience201529717018125849614
- ChaoSHLiaoYTChenVCCorrelation between brain circuit segregation and obesityBehav Brain Res201833721822728899821
- ThiaraGCigliobiancoMMuravskyAEvidence for neurocognitive improvement after bariatric surgery: A systematic reviewPsychosomatics201758321722728410777
- JantaratnotaiNMosikanonKLeeYMcIntyreRSThe interface of depression and obesityObes Res Clin Pract2017111110
- ChandraADervenoulasGPolitisMAlzheimer’s Disease Neuroimaging InitiativeMagnetic resonance imaging in Alzheimer’s disease and mild cognitive impairmentJ Neurol Epub2018817
- XuSWXiJHLinCCognitive decline and white matter changes in mesial temporal lobe epilepsyMedicine (Baltimore)20189733e1180330113469
- GuimarãesRPCamposBMde RezendeTJIs diffusion tensor imaging a good biomarker for early parkinson’s disease?Front Neurol2018962630186216
- Marqués-IturriaIScholtensLHGaroleraMAffected connectivity organization of the reward system structure in obesityNeuroimage201511110010625687594
- KullmannSCallaghanMFHeniMSpecific white matter tissue microstructure changes associated with obesityNeuroimage2016125364426458514
- MoraEPortellaMJMartinez-AlonsoMThe impact of obesity on cognitive functioning in euthymic bipolar patients: a cross-sectional and longitudinal studyJ Clin Psychiatry2017788e924e93228994517
- LacknerNBengesserSABirnerAAbdominal obesity is associated with impaired cognitive function in euthymic bipolar individualsWorld J Biol Psychiatry201617753554626068130
- YimCYSoczynskaJKKennedySHWoldeyohannesHOBrietzkeEMcIntyreRSThe effect of overweight/obesity on cognitive function in euthymic individuals with bipolar disorderEur Psychiatry201227322322821570263
- BullmoreETBassettDSBrain graphs: graphical models of the human brain connectomeAnnu Rev Clin Psychol2011711314021128784
- ChenVCShenCYLiangSHAssessment of abnormal brain structures and networks in major depressive disorder using morphometric and connectome analysesJ Affect Disord201620510311127423425
- BullmoreESpornsOComplex brain networks: graph theoretical analysis of structural and functional systemsNat Rev Neurosci200910318619819190637
- HosseiniSMHoeftFKeslerSRGAT: a graph-theoretical analysis toolbox for analyzing between-group differences in large-scale structural and functional brain networksPLoS One201277e4070922808240
- TyanYSLiaoJRShenCYLinYCWengJCGender differences in the structural connectome of the teenage brain revealed by generalized q-sampling MRINeuroimage Clin20171537638228580294
- WengJCKaoTWHuangGJTyanYSTsengHCHoMCEvaluation of structural connectivity changes in betel-quid chewers using generalized q-sampling MRIPsychopharmacology (Berl)2017234131945195528342092
- YehFCWedeenVJTsengWYImaging Gq-SamplingGeneralized q-sampling imagingIEEE Trans Med Imaging20102991626163520304721
- ZaleskyAFornitoABullmoreETNetwork-based statistic: identifying differences in brain networksNeuroimage20105341197120720600983
- BrooksSJO’DalyOGUherRDifferential neural responses to food images in women with bulimia versus anorexia nervosaPLoS One201167e2225921799807
- MarshRStefanMBansalRHaoXWalshBTPetersonBSAnatomical characteristics of the cerebral surface in bulimia nervosaBiol Psychiatry201577761662323978404
- KernsJGCohenJDMacDonaldAW3rdChoRYStengerVACarterCSAnterior cingulate conflict monitoring and adjustments in controlScience200430356601023102614963333
- KingNACaudwellPHopkinsMMetabolic and behavioral compensatory responses to exercise interventions: barriers to weight lossObesity (Silver Spring)20071561373138317557973
- VolkowNDWangGJTomasiDBalerRDObesity and addiction: neurobiological overlapsObes Rev201314121823016694
- DevotoFZapparoliLBonandriniRHungry brains: a meta-analytical review of brain activation imaging studies on food perception and appetite in obese individualsNeurosci Biobehav Rev20189427128530071209
- HauckCWeißASchulteEMMeuleAEllrottTPrevalence of ‘food addiction’ as measured with the yale food addiction scale 2.0 in a representative german sample and its association with sex, age and weight categoriesObes Facts2017101122428190017
- EladawiNHelalRNiazyNAAbdelsalamSPrevalence and associated factors of eating disorders in weight management centers in Tanta, EgyptChin Med J (Engl)20181311505529271380
- UherRMurphyTFriederichHCFunctional neuroanatomy of body shape perception in healthy and eating-disordered womenBiol Psychiatry2005581299099716084858
- VolpeUGalderisiSMucciAP02-145 – Perception of body shape in bulimia nervosa: An ERP studyEur Psychiatry201126741
- RoweRPicklesASimonoffEBulikCMSilbergJLBulimic symptoms in the Virginia Twin Study of adolescent behavioral development: correlates, comorbidity, and geneticsBiol Psychiatry200251217218211822996
- XiangXAnRObesity and onset of depression among U.S. middle-aged and older adultsJ Psychosom Res201578324224825553601
- Martin-RodriguezEGuillen-GrimaFAubáEMartíABrugos-LarumbeARelationship between body mass index and depression in women: a 7-year prospective cohort study. The APNA studyEur Psychiatry201632556026803616
- KloiberSIsingMReppermundSOverweight and obesity affect treatment response in major depressionBiol Psychiatry200762432132617241618
- TakiYKinomuraSSatoKRelationship between body mass index and gray matter volume in 1,428 healthy individualsObesity (Silver Spring)200816111912418223623