
Abstract
Background
Previous studies demonstrated that early blindness is associated with abnormal intrinsic functional connectivity (FC) between the primary visual cortex (V1) and other sensory areas. However, the V1 pattern of spontaneous neural activity occurring in late blindness (LB) remains unknown. The purpose of this study was to investigate the intrinsic FC patterns of V1 in LB.
Materials and methods
Thirty LB individuals (18 males and 12 females; mean age: 38.76±14.43 years) and 30 sighted controls (SCs) individuals (18 males and 12 females; mean age: 38.67±13.85 years) closely matched for age, sex, and education, underwent resting-state magnetic resonance imaging scans. Region of interest analysis was performed to extract the correlation coefficient matrix among each pair of Brodmann area (BA) 17 and FC between V1 and vision-related subcortical nuclei.
Results
Compared with SCs, LB individuals showed a decreased FC between the left V1 and the bilateral cuneus (CUN)/lingual gyrus (LGG)/calcarine (CAL) (BA 18/19/30) and left precentral gyrus (PreCG) and the postcentral gyrus (PostCG) (BA 2/3/4). Also, LB individuals showed a decreased FC between the right V1 and the bilateral CUN/LGG/CAL (BA 18/19/30) and the left PreCG and PostCG (BA 2/3/4/6) (voxel-level: P<0.01, cluster-level: P<0.05). Meanwhile, LB individuals showed a decreased FC between the left V1 and the right V1 and increased FC between the left V1 and the right superior colliculus, the right V1, and the left hippocampus (P<0.05). Moreover, a positive correlation was observed between the onset age of blindness and FC values in V1 to CUN/LGG/CAL in LB.
Conclusion
Our results highlighted that LB induces a decreased FC between V1 and higher visual areas, motor cortices, and somatosensory cortices at rest. This might indicate that LB humans could present with impaired top-down modulations, visual imagery, and vision-motor function.
Introduction
Visual deprivation leads to cross-modal plasticity in the primary visual cortex (V1) of the human brain. Visual experience plays a major role in promoting the development of visual cortex during the critical development periods.Citation1–Citation3 In early blindness (EB) individuals, visual deprivation leads to functional and structural architecture changes in the visual cortex. The visual cortex of EB adults shows a shift of visual information to nonvisual stimuli, including auditory perception,Citation4 tactile perception,Citation5 and language perception.Citation6 Meanwhile, increased energy metabolism and neural activities have been observed in EB individuals.Citation7,Citation8 Moreover, EB has been associated with structural modification in the visual cortex due to visual deprivation before critical development periods. Indeed, thicker cortical thickness in visual cortices has been shown in EB adults compared with SCs.Citation9 Previous neuroimaging studies have revealed decreased gray matter volume in the visual pathway and the visual cortex in EB individuals.Citation10,Citation11 Furthermore, visual deprivation before and after sensitive periods of visual form showed different functional connectivity (FC) patterns within the occipital cortex.Citation12,Citation13 Another study reported that EB participants showed more brain functional reorganization than late blindness (LB) individuals.Citation14 Altered FC between V1 and other nonvisual cortices also occurred in EB individuals.Citation15 All the above mentioned studies have focused on the alterations of functional and structural architecture in the visual cortex in EB individuals. However, the pattern of spontaneous neural activity changes in V1 in LB remains unknown.
Retinitis pigmentosa (RP) patients provide a unique model to address this issue. Indeed, RP is a hereditary retinal disease characterized by a progressive visual loss. The worldwide prevalence of RP is about 1 in 4,000Citation16 and RP begins mainly during adulthood.Citation17 The peripheral visual loss in RP is due to the progressive degeneration of rod photoreceptor cells, followed by the degeneration of cone photoreceptor cells, which eventually ends up in blindness. In this study, we selected RP patients who have suffered from vision loss in their adulthood. These RP patients thus had visual deprivation after critical development periods in visual formation.
The human brain shows blood oxygenation level-dependent (BOLD) signals at rest, which are closely linked to the spontaneous neural activity. Resting-state magnetic resonance imaging (MRI) based on BOLD signals has been successfully applied to investigate the alterations in spontaneous neural activity.Citation18–Citation20 Resting-state function connectivity (RSFC) is a method that calculates the temporal coherence of the BOLD signals between distant brain regions.Citation21 Therefore, the RSFC method is an effective tool to investigate the neural activity connections between separated brain areas. Moreover, FC is based on a region of interest (ROI), which allows researchers to target a prior brain region before calculating its temporal coherence with other brain regions. Increased FC between the primary somatosensory cortex and the visual area has been shown in EB adults using a positron emission tomography (PET) method.Citation22 Yu et al demonstrated that EB individuals showed a decreased FC between V1 and the sensorimotor and auditory cortices.Citation23 Another study reported that decreased FC between visual and other sensory cortices was observed in EB.Citation24 However, the effect of visual deprivation after critical development periods on the spontaneous neural activity in V1 remains largely unknown.
Consequently, the purpose of this study was to determine whether spontaneous neural activity changes in V1 occurred in LB individuals. Moreover, we examined the strength of FC between V1 and some vision-related subcortical nuclei, such as lateral geniculate nucleus (LGN), superior colliculus, and hippocampus (Hipp) between two groups. We hypothesized that LB showed a different FC pattern between V1 and other brain regions relative to EB. These results may provide some useful information for the understanding of the underlying reorganization of V1 occurring in LB individuals.
Materials and methods
Participants
In total, 30 right-handed LB individuals due to RP (18 males and 12 females; mean age: 38.76±14.43 years) and 30 right-handed sighted controls (SCs) (18 males and 12 females; mean age: 38.67±13.85 years) participated in the study. The research protocol followed the Declaration of Helsinki and was approved by the medical ethics committee of the Renmin Hospital of Wuhan University. All subjects were given an informed written consent form for agreement to participant in this study.
All subjects met the following criteria: 1) no contraindications for MRI scanning (eg, no cardiac pacemaker or implanted metal devices, and so on); 2) no claustrophobia; 3) no heart disease, hypertension, and cerebral diseases. (The high resolution T1-weighted imaging of all subjects was checked by an experienced radiologist.)
All LB individuals met the following criteria: 1) onset age of blindness >12 years; 2) no experience of vision after visual deprivation; 3) no ocular surgical history.
All SCs participants met the following criteria: 1) no ocular diseases (myopia, cataracts, glaucoma, optic neuritis, retinal degeneration, etc); 2) binocular visual acuity ≥1.0; 3) no ocular surgical history; 4) no mental disorders.
MRI parameters
MRI scanning was performed on a 3-T MR scanner (Discovery MR750W system; GE Healthcare Bio-Sciences Corporation, Piscataway, NJ, USA) with eight-channel head coil. Whole-brain T1-weights were obtained with magnetization prepared gradient echo image (MPRAGE) with these parameters: (repetition time/echo time =8.5/3.3, thickness =1.0 mm, no intersection gap, acquisition matrix =256×256, field of view =240×240 mm2, flip angle =12°).
Functional images were obtained by using gradient echo-planar imaging sequence with the following parameters (repetition time =2,000 ms, echo time =25 ms, thickness =3.0 mm, gap =1.2 mm, acquisition matrix =64×64, flip angle =90°, field of view =240×240 mm2, voxel size =3.6×3.6×3.6 mm3, 35 axial) > All subjects underwent MRI scanning with eyes closed and without falling asleep.
Functional MRI (fMRI) data preprocessing
Digital Imaging and Communications in Medicine format of the functional images was converted to Neuroimaging Informatics Technology Initiative format using MRIcron software (http://www.cabiatl.com/mricro/mricron/dcm2nii.html). All preprocessing was performed using the toolbox for Data Processing & Analysis of Brain Imaging (http://www.rfmri.org/dpabi),Citation25 which is based on Statistical Parametric Mapping (SPM8; http://www.fil.ion.ucl.ac.uk/spm) implemented in MATLAB 2013a (MathWorks, Natick, MA, USA) including briefly the following steps. 1) The first 10 volumes of each subject were discarded due to the signal reaching equilibrium. 2) The remaining 230 volumes of functional BOLD images were corrected for slice timing effects, motion corrected, and realigned. Data from subjects whose head motion was >2 mm or for whom rotation exceeded 2° during scanning were excluded. 3) Individual T1-weighted MPRAGE structural images were registered to the mean fMRI data, and then the resulting aligned T1-weighted images were segmented using the Diffeomorphic Anatomical Registration Through Exponentiated Lie Algebra toolbox for improved spatial precision in the normalization of fMRI data.Citation26 Normalized data (in Montreal Neurological Institute 152 space) were re-sliced at a resolution of 3×3×3 mm3. 4) Smoothing was performed with a 6 mm full-width-half-maximum Gaussian kernel. 5) Data with linear trend were removed, and temporal band-pass was filtered (0.01–0.1 Hz). 6) Linear regression analysis was used to regress out several covariates (six head motion parameters, mean frame-wise displacement, global brain signal, and averaged signal from white matter signal and cerebrospinal fluid). 7) We regressed out the global signal to obtain the whole brain FC index.Citation27
Definition of ROI in LGN, SC, and Hipp
The ROI in bilateral V1, bilateral LGN, bilateral SC, and bilateral Hipp were selected according to previous studies,Citation23,Citation28–Citation30 left V1(x=−8, y=−76, z=10) and right V1 (x=7, y=−76, z=10) and left LGN (x=−18, y=−32, z=0) and right LGN (x=22, y=−30, z=−2) and left SC (x=−2, y=−28, z=−6) and right SC (x=2, y=−26, z=−6) and left Hipp (x=−24, y=−3, z=−2) and right Hipp (x=24, y=−3, z=−2) (). For FC in V1 analysis, correlation analysis of time course was performed between the spherical seed region and each voxel of the whole brain for each subject using REST software (http://www.resting-fmri.Sourceforge.net).Citation31 Then, all FC maps were z-transformed with Fisher’s r-to-z transformation to reduce the influence of individual variations for group statistical comparisons. For FC between V1 and vision-related subcortical nuclei analysis, Pearson’s correlation coefficients between the mean time series of each pairwise V1 and vision-related nuclei were computed and converted to z-values using Fisher’s r-to-z transformation for group statistical comparisons.
Table 1 MNI coordinates for selected seed regions
Ophthalmic testing
For visual acuity testing, the visual acuity of all participants was measured by applying the logarithm of minimum angle of resolution table. Then, we checked the blind eyes with a flashlight to make sure they have no sensation of light. (All participants in this study were examined by two experienced ophthalmologists.)
Statistical analysis
One-sample t-test was conducted to assess intragroup patterns of z-values functional connectivity (zFC) maps using SPM8 software (voxel-level: P<0.001, Gaussian random field [GRF] correction). Two-sample t-test was used to compare two group differences in the zFC maps and in the pairs of zFC maps between V1 and vision-related nuclei using the GRF method which was used to correct for multiple comparisons and regressed covariates of age and sex using the SPM 8 software (two-tailed, voxel-level: P<0.01, GRF correction, cluster-level: P<0.05).
Pearson correlation coefficient was used to assess the relationships between the zFC values of different brain regions and behavioral data in LB using SPSS version 20.0 software (IBM Corporation, Armonk, NY, USA).
Results
Demographics measurements
The demographics measurements of the LB group included parameters such as gender, age, preferred hand, onset age, onset age of blindness, and cause of blindness. Details are provided in .
Table 2 Demographics and characteristics of late blindness
FC differences in ROI in V1
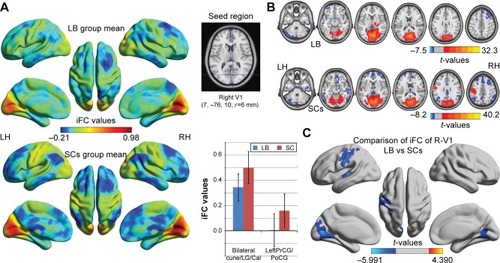
Distribution mean zFC patterns of left V1 and right V1 in group-level of LB and SCs subjects in the typical frequency band (0.01–0.1 Hz) are shown in and . Intra-group patterns of zFC maps of left V1 and right V1 between the two groups are shown in and . Compared with SCs, LB individuals showed decreased FC between the left V1 and the bilateral cuneus (CUN)/lingual gyrus (LGG)/calcarine (CAL) (Brodmann area [BA] 18/19/30) and left precentral gyrus (PreCG) and postcentral gyrus (PostCG) (BA 2/3/4) ( and ). Also, LB individuals showed decreased FC between the right V1 and the bilateral CUN/LGG/CAL (BA 18/19/30) and left PreCG and PostCG (BA 2/3/4/6) ( and ) (voxel-level: P<0.01, GRF correction, cluster-level: P<0.05).
Table 3 Significant differences in the FC of V1 between LB and SCs
Figure 1 Significant zFC maps of left V1 differences between two groups.
Abbreviations: GRF, Gaussian random field; iFC, intrinsic functional connectivity; LB, late blindness; LH, left hemisphere; RH, right hemisphere; SCs, sighted controls; V1, primary visual cortex; zFC, z-values functional connectivity.
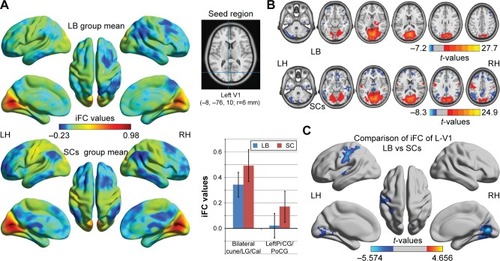
Figure 2 Significant zFC maps of right V1 differences between two groups.
Abbreviations: GRF, Gaussian random field; iFC, intrinsic functional connectivity; LB, late blindness; LH, left hemisphere; RH, right hemisphere; SCs, sighted controls; V1, primary visual cortex; zFC, z-values functional connectivity.
FC differences between V1 and vision-related nuclei
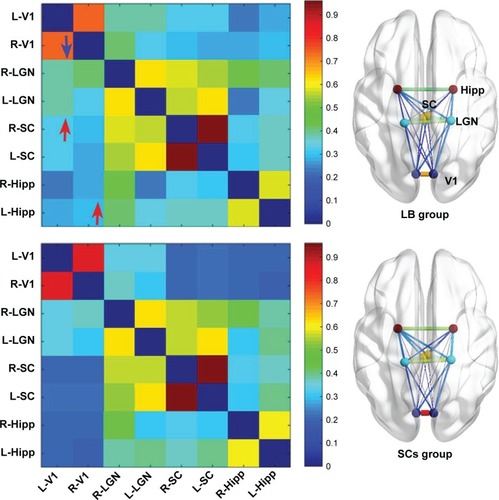
Compared with SCs, LB individuals showed decreased FC between the left V1 and the right V1 and increased FC between the left V1 and the right superior colliculus, the right V1, and the left Hipp (P<0.05) ( and ).
Table 4 Abnormal rs-FC within the vision-related nuclei between two groups
Figure 3 Significant zFC maps of V1 and vision-related nuclei differences between two groups.
Abbreviations: FC, functional connectivity; GRF, Gaussian random field; Hipp, hippocampus; L, left; LB, late blindness; LGN, lateral geniculate nucleus; R, right; SCs, sighted controls; SC, superior colliculus; V1, primary visual cortex.
Receiver operating characteristic (ROC) curve
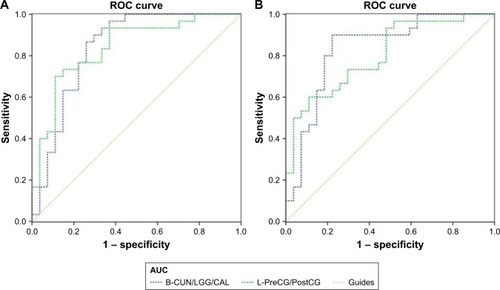
The mean FC values of the different brain regions were analyzed by the ROC curves. The areas under the curves for FC values were as follows: ROC curve in zFC in left V1: LB < SCs, for bilateral CUN/LGG/CAL 0.838 (P<0.001; 95% CI: 0.726–0.950); for left-PreCG/PostCG 0.838 (P<0.001; 95% CI: 0.733–0.944) (); ROC curve in zFC in right V1: LB < SCs, for bilateral CUN/LGG/CAL 0.835 (P<0.001; 95% CI: 0.723–0.946); for left-PreCG/PostCG 0.804 (P<0.001; 95% CI: 0.691–0.916) ().
Figure 4 ROC curve analysis of the mean zFC values for altered brain regions.
Abbreviations: AUC, area under the curve; B, bilateral; CAL, calcarine; CUN, cuneus; FC, functional connectivity; L, left; LGG, lingual gyrus; PostCG, postcentral gyrus; PreCG, precentral gyrus; ROC, receiver operating characteristic; V1, primary visual cortex.
Correlation analysis
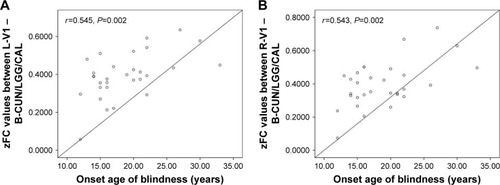
In the LB group, a positive correlation was observed between the onset age of blindness and FC values in the left V1 (r=0.545, P=0.002; ) and the right V1 (r=0.543, P=0.002) in LB ().
Figure 5 Significant correlation was observed between the onset age of blindness and zFC values in the (A) left V1 (r=0.545, P=0.002) and (B) right V1 (r=0.543, P=0.002) in LB individuals.
Discussion
To the best of our knowledge, the RSFC method used in this study provides a novel tool to assess correlation coefficients of BOLD signal time course between different brain regions. Our study was the first to investigate the effects of visual deprivation after key development periods on spontaneous functional organization between V1 and other brain areas. Compared with SCs, LB individuals exhibited decreased FC between the left V1 and the bilateral CUN/LGG/CAL (BA 18/19/30) as well as the left PreCG and PostCG (BA 2/3/4). Also, LB adults showed decreased FC between the right V1 and the bilateral CUN/LGG/CAL (BA 18/19/30) as well as the left PreCG and PostCG (BA 2/3/4/6). Moreover, compared with SCs, LB individuals showed decreased FC between the left V1 and the right V1 and increased FC between the left V1 and the right SC, the right V1, and the left Hipp. Finally, the onset age of blindness showed positive correlations between FC values of the left V1 and the left CUN/LGG/CAL (r=0.545, P=0.002), and FC values of the right V1 and the right CUN/LGG/CAL (r=0.543, P=0.002).
It is well known that the visual pathway consists of a ventral stream and a dorsal stream, which are the main routes for the processing of visual information. The ventral stream pathway originates from V1, goes through V2 and V4, and projects to the inferior temporal cortex, where identification of objects takes place. The dorsal stream starts from V1, goes through V2, V6, and V5, and finally projects to the posterior parietal cortex, which plays an important role in spatial information.Citation32 Visual signals are processed in visual stream, following top-down modulations through feedback connections. The feedback connection between these visual areas contributes to the comprehension of the visual scene, visual attention, and visual recall.Citation33,Citation34 A previous study provided evidence that V1 was closely associated with higher visual cortices related to visual imagery function in normal sighted individuals.Citation35 Neuroimaging studies have demonstrated that mental image function is involved in V1 and higher visual cortices activation.Citation36,Citation37 The degeneration of the visual pathway and the visual cortex is subsequent to visual deprivation in late life. A previous diffusion tensor imaging study revealed that reduced fractional anisotropy in optic radiations is observed in LB compared with normal sighted individuals.Citation38 Meanwhile, another study reported that late-blinded individuals induced by RP exhibited lower gray matter volume in the visual cortices.Citation39 Abnormal structural changes in visual cortices may be related to the spontaneous neural activity in the visual area. Alternatively, Qin et al demonstrated that LB showed a decreased FC density in V1.Citation14 Consistent with these findings, we observed decreased FC between the bilateral V1 and the bilateral CUN/LGG/CAL (BA 18/19/30) in LB individuals, indicating a disconnection in the visual network. Furthermore, a positive correlation was observed between the onset age of blindness and FC values between bilateral V1 and BA 18/19/30 in LB individuals, indicating that the duration of blindness is closely related to the FC within the visual network. Thus, we speculate that visual deprivation after critical development periods induces impairment of top-down modulations, visual imagery function, and visual attention.
PreCG is the location of the primary motor cortex, which plays an important role in motor control, especially in movement control. In normal sighted subjects, the coordination of visual and motor cortices is involved in a variety of tasks implying vision-motor function. Vision-motor function is critical in the integration of visual perception and motor skills.Citation40,Citation41 A previous study revealed that visual and motor cortices were associated with similar activation during a visual tracking task.Citation42 Meanwhile, PreCG showed a significant positive correlation with V1 without any task stimulation.Citation35 Thus, there is a robust correlation between the visual and motor cortices in normal sighted subjects. A previous fMRI study reported a significant decreased FC between V1 and the motor cortices in EB.Citation23 In support of these study findings, the reduced visual input in LB may also contribute to the decreased FC between the bilateral V1 and the left PreCG. Decreased FC between the bilateral V1 and the left PreCG was observed in our study, which might be due to the right-handed subjects in our study. Moreover, cross-modal plasticity occurs in visual cortices in blind subjects.Citation43 Since the visual cortex is involved in the motor function of LB individuals, we speculated that the reduced visual input and cross-modal plasticity might contribute to the decreased FC between motor cortices and V1.
PostCG is the site of the primary somatosensory cortex, which is involved in multiple sensory perceptions. PostCG is also responsible for the touch and pain sense.Citation44,Citation45 Previous studies have demonstrated that the visual cortex and PostCG showed robust correlation in SCs, which involved in combining processing of spatial visual and somatosensory information.Citation35,Citation46 In our study, our results revealed a significantly reduced FC between V1 and left somatosensory cortices in LB individuals compared to SCs. For one reason, the reduced visual input might lead to decreased FC between the V1 and somatosensory cortices in LB individuals. For another reason, the phenomenon might reflect the cross-modal plasticity in V1. In blind humans, tactile stimuli activate the visual cortex through the somatosensory cortex.Citation47 Indeed, Braille reading leads to the activation of the visual cortex in blind individuals.Citation48 Sadato et al found that the blind individuals had visual cortex activation during tactile tasks, whereas SC showed deactivation using the PET method.Citation5 The visual cortex might be activated by other sensory modalities. Ptito M et al demonstrated that visual deprivation from an early age could lead to the visual cortex being recruited to a role in somatosensory processing.Citation49 Thus, we speculated that the visual cortex shows a shift of visual information to somatosensory processing. These changes might lead to alterations of intrinsic connectivity between the visual cortices and somatosensory cortices in blind humans. A previous study also reported decreased FC between the V1 and somatosensory cortices in EB individuals.Citation23 Combined with these points, we concluded that the reduced visual input and visual cortices representations of sensory modalities might contribute to the decreased FC between somatosensory cortices and V1. Decreased FC between the bilateral V1 and the left PostCG was observed in our study, which might be due to the right-handed subjects.
Furthermore, decreased FC between the left V1 and the right V1 was observed in LB groups relative to SCs groups. Hou et al demonstrated decreased interhemispheric FC in V1 in EB individuals.Citation50 Another study reported that monocular blindness was associated with decreased interhemispheric FC in V1.Citation51 Consistent with these studies, we found that LB groups showed a significant decreased interhemispheric FC in V1, indicating abnormal interhemispheric coordination in V1. Interestingly, increased FC between the left V1 and the right superior colliculus was observed in LB groups relative to SCs groups. Superior colliculus plays an important role in visual spatial attention.Citation52 The increased FC between V1 and superior colliculus might reflect the reorganization of visual spatial attention in LB individuals.
Conclusion
In summary, our results highlighted that visual deprivation after sensitive development periods induces decreased FC between V1 and higher visual areas, motor cortices, and somatosensory cortices at rest. These results may provide some useful information for the understanding of the underlying reorganization of V1 occurring in LB individuals. Our findings indicate that LB adults might present with abnormal top-down modulations, visual imagery, and vision-motor function.
Acknowledgments
We acknowledge the assistance provided by the National Nature Science Foundation of China (grant no. 81470628 and 81800872), International Science & Technology Cooperation Program of China (2017YFE0103400), and Young Teachers’ Independent Research Funding of Wuhan University (no 2042018kf0178). This was not an industry supported study.
Disclosure
The authors report no conflicts of interest in this work.
References
- MowerGDChristenWGRole of visual experience in activating critical period in cat visual cortexJ Neurophysiol19855325725893981230
- DesaiNSCudmoreRHNelsonSBTurrigianoGGCritical periods for experience-dependent synaptic scaling in visual cortexNat Neurosci20025878378912080341
- FoxKDawNSatoHCzepitaDThe effect of visual experience on development of NMDA receptor synaptic transmission in kitten visual cortexJ Neurosci1992127267226841351937
- CollignonOVandewalleGVossPFunctional specialization for auditory-spatial processing in the occipital cortex of congenitally blind humansProc Natl Acad Sci U S A2011108114435444021368198
- SadatoNPascual-LeoneAGrafmanJActivation of the primary visual cortex by Braille reading in blind subjectsNature199638065745265288606771
- OfanRHZoharyEVisual cortex activation in bilingual blind individuals during use of native and second languageCereb Cortex20071761249125916861335
- De VolderAGBolABlinJBrain energy metabolism in early blind subjects: neural activity in the visual cortexBrain Res19977501–22352449098549
- LiuCLiuYLiWIncreased regional homogeneity of blood oxygen level-dependent signals in occipital cortex of early blind individualsNeuroreport201122419019421304328
- JiangJZhuWShiFThick visual cortex in the early blindJ Neurosci20092972205221119228973
- PtitoMSchneiderFCPaulsonOBKupersRAlterations of the visual pathways in congenital blindnessExp Brain Res20081871414918224306
- PanWJWuGLiCXLinFSunJLeiHProgressive atrophy in the optic pathway and visual cortex of early blind Chinese adults: a voxel-based morphometry magnetic resonance imaging studyNeuroimage200737121222017560797
- CollignonODormalGAlbouyGImpact of blindness onset on the functional organization and the connectivity of the occipital cortexBrain2013136Pt 92769278323831614
- BüchelCPriceCFrackowiakRSFristonKDifferent activation patterns in the visual cortex of late and congenitally blind subjectsBrain1998121Pt 34094199549517
- QinWXuanYLiuYJiangTYuCFunctional connectivity density in congenitally and late blind subjectsCereb Cortex20152592507251624642421
- BurtonHSnyderAZRaichleMEResting state functional connectivity in early blind humansFront Syst Neurosci201481595124778608
- HartongDTBersonELDryjaTPRetinitis pigmentosaLancet200636895491795180917113430
- TsujikawaMWadaYSukegawaMAge at onset curves of retinitis pigmentosaArch Ophthalmol2008126333734018332312
- JiangCYiLSuSDiurnal variations in neural activity of healthy human brain decoded with resting-state blood oxygen level dependent fMRIFront Hum Neurosci20161063428066207
- AuerDPSpontaneous low-frequency blood oxygenation level- dependent fluctuations and functional connectivity analysis of the “resting” brainMagn Reson Imaging20082671055106418657923
- FristonKJFrithCDLiddlePFFrackowiakRSFunctional connectivity: the principal-component analysis of large (PET) data setsJ Cereb Blood Flow Metab19931315148417010
- OgawaSLeeTMKayARTankDWBrain magnetic resonance imaging with contrast dependent on blood oxygenationProc Natl Acad Sci U S A19908724986898722124706
- WittenbergGFWerhahnKJWassermannEMHerscovitchPCohenLGFunctional connectivity between somatosensory and visual cortex in early blind humansEur J Neurosci20042071923192715380014
- YuCLiuYLiJAltered functional connectivity of primary visual cortex in early blindnessHum Brain Mapp200829553354317525980
- BurtonHSnyderAZRaichleMEResting state functional connectivity in early blind humansFront Syst Neurosci201485124778608
- YanCGWangXDZuoXNZangYFDPABI: data processing & analysis for (Resting-State) brain imagingNeuroinformatics201614333935127075850
- GotoMAbeOAokiSDiffeomorphic Anatomical Registration Through Exponentiated Lie Algebra provides reduced effect of scanner for cortex volumetry with atlas-based method in healthy subjectsNeuroradiology201355786987523619702
- MurphyKBirnRMHandwerkerDAJonesTBBandettiniPAThe impact of global signal regression on resting state correlations: are anti-correlated networks introduced?Neuroimage200944389390518976716
- DaiHMorelliJNAiFResting-state functional MRI: functional connectivity analysis of the visual cortex in primary open-angle glaucoma patientsHum Brain Mapp201334102455246322461380
- KrebsRMWoldorffMGTempelmannCHigh-field FMRI reveals brain activation patterns underlying saccade execution in the human superior colliculusPLoS One201051e869120084170
- GiovanelloKSSchnyerDMVerfaellieMA critical role for the anterior hippocampus in relational memory: evidence from an fMRI study comparing associative and item recognitionHippocampus20041415815058477
- SongXWDongZYLongXYREST: a toolkit for resting-state functional magnetic resonance imaging data processingPLoS One201169e2503121949842
- WangJZhouTQiuMRelationship between ventral stream for object vision and dorsal stream for spatial vision: an fMRI + ERP studyHum Brain Mapp19998417018110619412
- GilbertCDLiWTop-down influences on visual processingNat Rev Neurosci201314535036323595013
- LuKHJeongJYWenHLiuZSpontaneous activity in the visual cortex is organized by visual streamsHum Brain Mapp20173894613463028608643
- WangKJiangTYuCSpontaneous activity associated with primary visual cortex: a resting-state FMRI studyCereb Cortex200818369770417602140
- KosslynSMThompsonWLKimIJAlpertNMTopographical representations of mental images in primary visual cortexNature199537865564964987477406
- D’EspositoMDetreJAAguirreGKA functional MRI study of mental image generationNeuropsychologia19973557257309153035
- DietrichSHertrichIKumarVAckermannHExperience-related structural changes of degenerated occipital white matter in late-blind humans – a diffusion tensor imaging studyPLoS One2015104e012286325830371
- MachadoARPereiraACFerreiraFStructure-function correlations in Retinitis Pigmentosa patients with partially preserved vision: a voxel-based morphometry studySci Rep2017711141128900214
- DalyCJKelleyGTKraussARelationship between visual-motor integration and handwriting skills of children in kindergarten: a modified replication studyAm J Occup Ther200357445946212911088
- PelzJHayhoeMLoeberRThe coordination of eye, head, and hand movements in a natural taskExp Brain Res2001139326627711545465
- KruseWDannenbergSKleiserRHoffmannKPTemporal relation of population activity in visual areas MT/MST and in primary motor cortex during visually guided tracking movementsCereb Cortex200212546647611950764
- GizewskiERGasserTde GreiffABoehmAForstingMCross-modal plasticity for sensory and motor activation patterns in blind subjectsNeuroimage200319396897512880825
- PlonerMSchmitzFFreundHJSchnitzlerADifferential organization of touch and pain in human primary somatosensory cortexJ Neurophysiol20008331770177610712498
- WrigleyPJPressSRGustinSMNeuropathic pain and primary somatosensory cortex reorganization following spinal cord injuryPain20091411–2525919027233
- NirYHassonULevyIYeshurunYMalachRWidespread functional connectivity and fMRI fluctuations in human visual cortex in the absence of visual stimulationNeuroimage20063041313132416413791
- CunninghamSIWeilandJDBaoPTjanBSVisual cortex activation induced by tactile stimulation in late-blind individuals with retinitis pigmentosaConf Proc IEEE Eng Med Biol Soc201120112841284422254933
- BurtonHSnyderAZConturoTEAkbudakEOllingerJMRaichleMEAdaptive changes in early and late blind: a fMRI study of Braille readingJ Neurophysiol200287158960711784773
- PtitoMKupersRCross-modal plasticity in early blindnessJ Integr Neurosci20054447948816385642
- HouFLiuXZhouZZhouJLiHReduction of interhemispheric functional brain connectivity in early blindness: a resting-state fMRI StudyBiomed Res Int20172017675692728656145
- ShaoYBaoJHuangXComparative study of interhemispheric functional connectivity in left eye monocular blindness versus right eye monocular blindness: a resting-state functional MRI studyOncotarget2018918142851429529581843
- KrauzlisRJLovejoyLPZénonASuperior colliculus and visual spatial attentionAnnu Rev Neurosci20133616518223682659