
Abstract
Background
Diffusion tensor imaging (DTI) is a powerful tool for investigating brain anatomical connectivity. The aim of our study was to compare brain connectivity among children with autism spectrum disorders (ASD), developmental dysphasia (DD), and healthy controls (HC) in the following tracts: the arcuate fasciculus (AF), inferior frontal occipital fasciculus (IFOF), inferior longitudinal fasciculus (ILF), and uncinate fasciculus (UF).
Methods
Our sample consisted of 113 children with a mean age 8.7±2.2 years (77 boys, 36 girls), divided into three subgroups: ASD (n=39), DD (n=36), and HC (n=38). The International Classification of Diseases, 10th ed. was used to make clinical diagnoses. DTI images were collected using a 1.5 T Phillips Achieva MR imaging system.
Results
Detailed analyses of fractional anisotropy (FA) revealed significant differences among the ASD, DD, and HC groups in the left AF (p=0.014) and right AF (p=0.001), the left IFOF (p<0.001) and right IFOF (p<0.001), the left ILF (p<0.001) and right ILF (p<0.001), but not in the UF. Post-hoc analyses revealed three patterns of FA differences among the groups: (1) in the right AF, right IFOF, and right ILF, FA was significantly lower in the ASD group compared to the DD and HC groups; however, there was no difference in FA between DD and HC; (2) in the left AF and left IFOF, FA was significantly lower in the ASD than in the HC group, but there were no differences between DD vs HC nor DD vs ASD; and (3) in the left ILF, no difference in FA was seen between ASD and DD, but FA in both was significantly lower than in the HC.
Conclusion
Microstructural white matter properties differed between ASD vs DD and HC subjects. The tract where FA impairment in ASD and DD subjects was the most similar was the left ILF.
Introduction
Diffusion tensor imaging (DTI) is a sensitive, noninvasive method of mapping and characterizing the microstructural properties and macroscopic organization of white matter tissues in the brain.Citation1 Since the first DTI study in autism spectrum disorders (ASD) published by Barnea-Goraly et al,Citation2 the number of studies has quickly increased. A meta-analysis by Aoki et alCitation3 found 39 DTI studies and a systematic review by Ameis and CataniCitation4 found 72 studies in ASD.
The majority of DTI studies in ASD subjects have reported reduced white matter integrity, resulting in lower fractional anisotropy (FA) and/or higher mean diffusivity (MD) values in long-range anterior-posterior and interhemispheric fiber tracts.Citation5 The most commonly reported areas for decreased FA values were the corpus callosum (CC) and association fibers including the superior longitudinal fasciculus (SLF), inferior longitudinal fasciculus (ILF), inferior frontal occipital fasciculus (IFOF), uncinate fasciculus (UF), and cingulum.Citation3,Citation5,Citation6 The FA results regarding the arcuate fasciculus (AF) are inconsistent.Citation1 The SLF, CC, and corticospinal tracts were the most commonly mentioned structures associated with increased MD.Citation5
DTI research in developmental dysphasia (DD) has been limited. Verhoeven et alCitation7 focused on the superior longitudinal fasciculus and reported reduced FA in DD but not in ASD (with language impairment) compared to controls. Roberts et alCitation8 focused on the AF and demonstrated increased MD of the left AF in DD as well as in ASD; however, MD of the right AF and FA of the AF bilaterally could not differentiate either diagnosis from controls. Vydrova et alCitation9 found that children with DD compared to controls showed a bilaterally decreased FA in the AF, IFOF, ILF, and UF.
As has been shown in the literature, DTI has frequently been used in separate studies of individuals with autism spectrum disorders (ASD) as well as those with developmental dysphasia (DD). The aim of our study was to compare brain connectivity among children with ASD, DD, and healthy controls (HC) in a single study. We believe that to identify similarities and differences at the microstructural level between two neurodevelopmental disorders (ASD and DD) can facilitate future investigations seeking to classify individual developmental disorders. We focused on four tracts that have been strongly implicated in the pathogenesis of both ASD and DD: the AF, IFOF, ILF, and UF. The AF has long been considered to connect brain areas involved in language understanding and production.Citation1 Research into the IFOF has revealed its role in semantic processing and perception of facial expression.Citation10 The ILF is involved in processing and modulating visual cues including facial recognition, and its disruption is associated with emotional difficulties in ASD.Citation11,Citation12 Recent research suggests that the UF may be involved in proper name retrieval, emotion recognition, and self-awareness.Citation1
Methods
Sample
Our sample was comprised of 113 children with a mean age of 8.7 ± 2.2 years (range 5.0–13.2 years; 77 boys, 36 girls), divided into three subgroups: ASD (n=39), DD (n=36), and HC (n=38). Descriptive characteristics of the subgroups are given in . The subgroups did not differ in age or handedness but there were significantly more girls in the DD and HC groups than in the ASD group.
Table 1 Descriptive Characteristics Of The Sample Subgroups
Clinical examinations, based on the International Classification of Diseases, 10th ed. (ICD-10),Citation13 were used to make clinical diagnoses. A diagnosis of autism in the ASD group was confirmed using the Autism Diagnostic Observation Schedule-Generic (ADOS)Citation14 and/or the Autism Diagnostic Interview-Revised (ADI-R);Citation15 there were 25 children with childhood autism, 9 children with Asperger syndrome, and 5 children with atypical autism. The diagnosis of DD was supported by the Token Test for ChildrenCitation16 and the subtest Word List Recall from Working Memory Test Battery for Children.Citation17 In the HC group, ASD was excluded using the Childhood Autism Spectrum Test (CAST),Citation18 and in the DD group using clinical examinations.
Subjects with any psychiatric diagnosis (other than the ASD or DD), mental retardation, and/or genetic syndrome were excluded.
Procedure
The study was approved by the Multicenter Ethics Committee of the University Hospital Motol under Reference No. EK-860/15. All procedures performed in the study involving human participants were in accordance with the 1964 Helsinki declaration and its later amendments. A signed informed consent was obtained from parents who agreed to have their child participate in the study.
In the Czech Republic, some hospitals (including ours) perform routine brain magnetic resonance imaging (MRI) (most of which are done under general anesthesia) as part of autism diagnostic procedures. Therefore, parents of ASD children who had agreed with the routine MRI needed only to agree to supplementation of the routine MRI using the DTI protocol. The DD and HC group underwent MRI without general anesthesia.
IQ testing was also performed to exclude individuals with mental retardation. The Wechsler Preschool and Primary Scale of Intelligence, Fourth UK edition (WPPSI-IV) and the Wechsler Intelligence Scale for Children, Fourth UK edition (WISC-IV) were used for most children. For some autistic children, the Snijders-Oomen Nonverbal Intelligence Test, Revision 2, 5–7 (SON-R 2, 5–7) and the Bayley Scales of Infant and Toddler Development, Third Edition (Bayley III) were alternatively used.
Data Acquisition
Diffusion-weighted images were collected using a 1.5 T Philips Achieva and the spin-echo echo-planar imaging sequence PHILIPS DTI_HIGH (echo time TE = 80 ms, repetition time TR = 11.854 ms with 32 diffusion directions with the diffusion weighting of b = 800 s/mm2 and one b0 volume, 2 x 2 x 2 mm voxels, acquisition matrix = 112 x 112, number of averages 2. 75 slices per volume.
Phase-Encode-Reversed pairs (blip-up-blip-down) of images were measured to perform distortion correction, which allows better registration of diffused data to structural images. The set of images contains the single-diffusion-weighted volume from the main diffusion acquisition (b=0) and the same volume measured with the opposite direction of phase encoding (b=0).
A T1-weighted 3D gradient recalled (GR) morphological sagittal scan was performed for each subject for anatomical localization of fiber tracts (repetition time TR = 25 ms, echo time TE = 4.6 ms, matrix = 480 x 323, slice thickness = 1 mm). An eight-channel, sensitivity encoding SENSE head coil was used. The imaging sections were positioned to make the section perpendicular to the anterior commissure-posterior commissure line. Total scanning time was approximately 25 min per subject.
Data Processing
Images were processed using FSL tools (FMRIB Software Library v5.0.8).Citation19–Citation21 Raw diffusion data were converted from the DICOM format to NIfTI using the dcm2nii tool and b-values (bvals), and diffusion vectors (bvecs) were extracted. All diffusion-weighted images passed the FSL TOPUP and EDDY pre-processing steps for estimating and correcting susceptibility-induced distortions caused by susceptibility distribution of the subject’s head and by eddy currents from the rapid switching of the gradient coils during diffusion measurement.Citation22 A set of two anterior-posterior and posterior-anterior phase-encoded b0 images were used to estimate the field of distribution of image distortions. Diffusion-weighted images, as well as the structural images, underwent visual observation and those with evident head motion artifacts were removed from further processing. Data of subjects that passed visual observation were corrected for possible head motion; the affected brain tissue was extracted from corrected data using FMRIB’s Diffusion Toolbox (FDT) and BET FSL-utilities.Citation23
Then the b0 corrected diffusion image from each subject was registered to the corresponding structural T1-weighted image with higher resolution and normalized to the standard MNI152 space using an affine linear transformation FLIRTCitation24–Citation26 and a non-linear transformation FNIRTCitation27–Citation29 to provide forward and reverse transformation matrices and a deformation warp-field.
The DTIFITCitation30,Citation31 tool was used on pre-processed and corrected data to fit a diffusion tensor model for each voxel. Volumes of three eigenvectors (V1–V3) and three eigenvalues (λ1–λ3) were estimated from the input gradient vectors, b-values, and diffusion-weighted data. Next, scalar maps were estimated, such as fractional anisotropy (FA), mean diffusivity (MD), and mode of the anisotropy (MO). The axial diffusivity map (AD) was calculated from eigenvalue λ1 (AD = λ1) and the radial diffusivity (RD) map was an arithmetic mean of the second and third eigenvalue RD = (λ2 + λ3)/2.
The Bayesian estimation of diffusion parameters was obtained using BEDPOSTX sampling techniques. The BEDPOSTX tool runs Markov Chain Monte Carlo sampling, which is used to build distributions based on diffusion parameters. It can also model the number of crossing fibers at each voxel. Additionally, the tool creates all the necessary data for running probabilistic tractography. In our study, the number of possible crossing fibers per one voxel was set to 2.
Probabilistic tractography analysis was then performed using the FLS implemented algorithm. PROBTRACKX repetitively samples from the distributions of voxel-wise principal diffusion directions, each time computing a streamline through these local samples to generate a probabilistic streamline or a sample from the distribution at the location of the true streamline. By taking many such samples, FDT can build up the histogram of the posterior distribution on the streamline location or the connectivity distribution.Citation31
Predefined parameters of the algorithm were set to 5,000 fiber streamlines, and the curvature threshold was set at 0.2, which means a minimal angle, approximately 80 degrees. The minimum length threshold was not applied, and the length of each step was set to 0.5 mm. Multiple masks were used as seed regions to generate a connectivity distribution between these regions of interest (ROI); the target set or exclusion mask was used to lead or reduce the generated pathways. The system of ROIs for each particular tract was predefined and standardized in MNI152 (Montreal Neurological Institute) space (Mazziotta et al, Collins et al).Citation32,Citation33 The ROI system for arcuate fascicle (AF) tracking was identical to the one implemented by Giorgio et alCitation34 and Chen et al.Citation35 In order to delineate the other tracts, we used the seed ROI system with respect to Catani’s imaging tractography atlas.Citation36,Citation37 The same ROI system for all tracts was used in the Vydrova et al study.Citation9
In the obtained connectivity map, diffusion parameters and volumes were calculated for each tract using FSLMATS and FSLSTATS tools. Weighted averages of all diffusion parameters were calculated for each tract using the weighting of diffusion probability as an output of the PROBTRACKX calculation. The weighted average reduces partial volume effects and better describes the means of detected tracts. Connectivity maps were transformed to the MNI space and normalized. The intensity threshold was defined as 10% of the maximal image intensity. All voxels with the intensity under this established threshold were removed from the map. Tract volumes were calculated from non-zero voxels in the reduced connectivity map, and all diffusion parameters were obtained from scalar maps.
Tract-Based Spatial Statistics
Tract-Based Spatial Statistics (TBSS)Citation38 for the whole brain was performed. In short, the mean fractional anisotropy image was calculated for each pair of compared groups. With regard to the age of the examined pediatric subjects and the size of the brains, a study-specific template was used. The study-specific template was created by co-registration of FA images to every other image, and each subject to the other subjects, and the “most representative” one was chosen as the target. All FA images across the two groups were aligned using non-linear registration to the target, ie, the most “typical” subject. The mean FA image was then skeletonized with a threshold of FA > 0.2 to exclude peripheral tracts. Next, a “distance map” was created from the skeleton mask for each subject and was used for the projection of FA onto the skeleton. Voxelwise statistics on the skeletonized FA data was performed. A general linear model (GLM) was predefined for each compared set of groups; data were randomized with a threshold-free cluster enhancement option. Independent samples t-tests were used on FA skeletonized images, across all subject in the compared groups, to find which FA skeleton voxels were significantly different. A similar procedure was performed for other diffusion maps, such as MD. Results of the TBSS analysis were then displayed using the FSLEYES viewer.
Based on the tractography results of our study (see the Results section) and in order to specify the similarities which had been seen in the ASD and DD groups, TBSS analysis was only performed on the left ILF. The mask of mean left ILF was calculated as the average of all previously detected left ILFs of the particular subject. A study-specific left ILF mask, which was transformed to MNI space, was compared with the probability map of the left ILF from the JHU White Tractography Atlas implemented in the FSLEYES viewer. The previously detected whole brain skeleton and all skeletonized data were masked by multiplication using the study mask for the specific left ILF so that only the left ILF is shown.
Data Analysis
Statistical analysis was performed using the Statistical Package for the Social Sciences version 22.0 software (IBM Corporation, Armonk, NY, USA) and statistical software R.Citation39 Descriptive statistics for the sample was used. For analysis of the age differences among the subgroups, a one-way ANOVA was used. For analysis of gender and handedness differences among the subgroups, the chi-square test was used. The Kruskal-Wallis test was used for comparing the three research subgroups relative to diffusivity and volume measurements, and the Tukey correction was applied for multiple testing. For post-hoc analyses, which were performed on tracts with significant subgroups´ differences as measured using the Kruskal-Wallis test, the Nemenyi test was used.
Results
Diffusivity Measurements
Detailed analyses of FA showed significant differences among the ASD, DD, and HC groups in the left AF (P=0.014) and right AF (P =0.001), the left IFOF (P<0.001) and right IFOF (P<0.001), the left ILF (P<0.001) and right ILF (P <0.001), but not in the UF (for details, see ).
Table 2 Diffusivity Measures And Volumes Of The Investigated Tracts
Post-hoc analyses revealed three patterns of FA differences among the groups: (1) in the right AF, right IFOF, and right ILF, FA differed significantly between the ASD group and the DD and HC groups; however, there was no difference in FA between DD and HC; (2) in the left AF and left IFOF, FA differed significantly between ASD and HC, but there were no differences between DD vs HC or DD vs ASD; and (3) in the left ILF, no difference was seen between ASD and DD, but both were significantly different from HC (for details, see ).
Detailed analyses of MD revealed significant differences among the ASD, DD, and HC groups in all four tracts bilaterally: in the left AF (P<0.001) and right AF (P=0.012), the left IFOF (P<0.001) and right IFOF (P <0.001), the left ILF (P<0.001) and right ILF (P=0.001), and in the left UF (P<0.001) and right UF (P<0.001). For details, see . Post-hoc analyses showed that MD in the left AF, right IFOF, and left ILF differed significantly between the ASD group and the DD and HC groups; however, there was no difference in MD between DD and HC. In the right AF and right ILF, MD differed significantly between ASD and HC, but there were no differences between DD vs HC or DD vs ASD. In the left IFOF, no difference was seen between ASD and DD, but both were significantly different from HC. Finally, in both the left and right UF, MD differed significantly between ASD and HC and between DD and HC; however, there was no difference in MD between ASD and DD (for details, see ).
Volumes Of The Tracts
Regarding volumes, differences among the subgroups were only detected in the left AF (P=0.003) and right AF (P=0.002), right IFOF (P=0.017), and right UF (P=0.007). Post-hoc analyses showed that in the left AF, volumes differed significantly between ASD and HC, but there were no differences between DD vs HC or DD vs ASD. In the right AF and right IFOF, volumes differed significantly between the ASD group and the DD and HC groups; however, there was no difference between DD and HC. In the right UF, volumes differed significantly only between the DD and HC groups (for details, see ).
TBSS Results Focused On The Left ILF
TBSS statistics focused on the left ILF, the only tract where the FA findings in the ASD and DD groups were similar, and both differed from controls in the general statistics. The TBSS enabled us to specify and localize the differences in FA between the groups in a pair-wise manner. The TBSS results confirmed that the differences between the ASD and control group included the whole ILF. The differences between the DD and HC groups were mostly localized to the anterior and central parts of the ILF, while the differences between the ASD and DD group were most prominent in the posterior part of the tract ().
Figure 1 Tract-Based spatial statistics for the left inferior longitudinal fasciculus. Voxels without differences between the two groups are in green. Voxels with the most significant differences between the two groups are coded using a red-to-yellow color map.
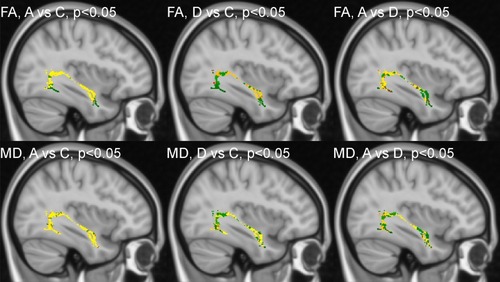
Regarding MD, the TBSS results also confirmed that the differences between the ASD and control group included the whole ILF. The MD differences between the DD and HC groups were mostly localized to the anterior part of the tract, while the differences between the ASD and DD group were most obvious in the central part of the ILF ().
To summarize the TBSS results from FA as well as MD, showed that the left ILF was the most similar between ASD and DD in the anterior part.
Discussion
In our study, we observed a significant bilateral decrease in the FA in the ASD group compared to the HC group in the AF, IFOF, and ILF. This observation agrees with a number of previous studies.Citation40–Citation49 However, observations suggesting a significant increase in FACitation50–Citation52 or no change in FACitation53 also exist.
Our study cannot confirm the findings of Roberts et alCitation8 that MD of the left AF was increased in both ASD and DD; in fact, we found it to only be true for ASD. Unlike Roberts et al, we found decreased FA in the left AF for ASD, but not for DD, compared to controls. Our results also disagree with the study by Vydrova et alCitation9 who found significant changes between the DD and HC groups in all investigated tracts. We did not study the superior longitudinal fasciculus; therefore, our results are not fully comparable with the Verhoeven et al study.Citation7
In particular, FA and MD differences between the ASD and control group have been more consistently reported in child populations, as opposed to adult populations.Citation54 Most importantly, recent reports have highlighted the lack of specificity of DTI metrics as one of their main limitations.Citation1 Both FA and MD differences may arise from a variety of factors including differences in myelination, axonal fiber density and caliber, and fiber tract homogeneity, all of which can make it difficult to interpret the underlying pathology of the observed differences.Citation54
Tract volumes have been less frequently investigated, and the results have been inconsistent. We reported a bilateral volume increase of AF in ASD compared to HC; however, in contrast, we also observed a volume decrease in the right IFOF in ASD compared to both DD and HC. In the right UF, volumes differed significantly between the DD and HC groups with larger volumes being seen in the DD group. Pugliese et alCitation55 studied adolescents and young adults with Asperger syndrome and found that Asperger patients had a significantly higher number of bilateral streamlines in the ILF compared to controls (also after co-varying for brain volume), which may indicate larger tract volumes. Vydrova et alCitation9 reported an increased volume for the left and right ILF in the DD group compared to controls.
The general finding from our study was a consistent trend in the right-sided tracts of AF, IFOF, and ILF in which the FA in DD did not differ from HC, and the FA in both subgroups (DD and HC) was significantly higher than in the ASD subgroup. In the equivalent left-sided tracts, there was no consistent trend. In the left AF and left IFOF, group differences in FA were driven mainly by differences between ASD and HC, whereas differences between subgroups, ie, DD vs HC and ASD vs HC, were not significant. A different situation was seen in the left ILF; the FA between the ASD and DD subgroups did not differ, and FA in both subgroups (ie, DD and ASD) was significantly lower compared to the HC subgroup. This implies that the tract, where impairments in ASD and DD subjects are the most similar, is the left ILF.
While the right ILF seems to be crucial for efficient face and emotion recognition, abnormalities in the left ILF have been connected with poor decoding in reading and impaired lexical retrieval.Citation11 ASD individuals with poor language skills display lower FA in the posterior part of the left ILF compared to ASD individuals with moderate to strong language skills.Citation56 In a non-clinical population, FA values of the left ILF positively correlated with the autism-spectrum quotient.Citation57
The reproducibility of connectivity studies in ASD is generally limited by a growing body of evidence that autism is not a unitary disorder but rather a group of conditions that are heterogeneous in etiology and clinical manifestation.Citation58–Citation60 On the other hand, emergent DTI research includes new promising techniques that involve machine learningCitation61 as well as research into understudied regions of the brain, eg the cerebellum.Citation62
The limitation of our study was that the research subgroups were not fully balanced regarding gender. However, we previously performed an exploratory analysis in order to determine if the diffusivity measures and volumes of the investigated tracts differed between boys and girls. We found that no significant gender differences, which would survive the Tukey correction for multiple comparisons (P<0.01797), existed in either tract or in either subgroup.
A further limitation was that the MRI scanning in ASD subgroup was done with anesthesia, whereas in DD and HC subgroups it was done without anesthesia, which had a slight influence on the frequency of mild motion artifacts in the subgroups (0 vs 3 vs 2 subjects). We also used a 1.5 T MRI scanner, which was what was available to us, whereas many other studies have used more advanced 3 T scanners. The b-values b = 800 s/mm2 used in diffusion scans in this study was chosen with respect to MR scanner limitations and the type of gradient coils used. Use of higher b-values allowed us to get better diffusion sensitivity but increased the number of unwanted image distortions.
Conclusion
In this paper, we used DTI to measure microstructural white matter differences between children with ASD and DD, and healthy controls. In the left ILF, a significantly reduced FA was observed in both ASD and DD subgroups compared to HC subgroup. This finding was supported by TBSS, which showed that the similarities between the ASD and DD subgroups were primarily localized in the anterior part of the left ILF.
Acknowledgments
Supported by the Ministry of Health of the Czech Republic, grant nr. 16-31754A. The authors would like to thank Thomas Secrest, MSc., for his assistance with the English version of the manuscript. We also thank Hana Sihelska and Jana Maslova for their technical and administrative support of our research. The abstract of this paper was presented at the 19th WPA World Congress of Psychiatry (Lisbon, 21-24 August 2019) as a poster presentation. The poster’s abstract was published online: https://2019.wcp-congress.com/scientific-program/.
Disclosure
Michal Hrdlicka, Jan Sanda, Tomas Urbanek, Martin Kudr, Iva Dudova, Lenka Pospisilova, Marketa Mohaplova, Alice Maulisova, Pavel Krsek, Marek Blatny, and Vladimir Komarek report grants, personal fees from Ministry of Health, Czech Republic, during the conduct of the study. The authors report no other conflicts of interest in this work.
References
- Travers BG, Adluru N, Ennis C, et al. Diffusion tensor imaging in autism spectrum disorder: a review. Autism Res. 2012;5:289–313. doi:10.1002/aur.124322786754
- Barnea-Goraly N, Kwon H, Menon V, Eliez S, Lotspeich L, Reiss AL. White matter structure in autism: preliminary evidence from diffusion tensor imaging. Biol Psychiatry. 2004;55:323–326. doi:10.1016/j.biopsych.2003.10.02214744477
- Aoki Y, Abe O, Nippashi Y, Yamasue H. Comparison of white matter integrity between autism spectrum disorder subjects and typically developing individuals: a meta-analysis of diffusion tensor imaging tractography studies. Mol Autism. 2013;4:24. doi:10.1186/2040-2392-4-2123915495
- Ameis SH, Catani M. Altered white matter connectivity as a neural substrate for social impairment in autism spectrum disorder. Cortex. 2015;62:158–181. doi:10.1016/j.cortex.2014.10.01425433958
- Yamasaki T, Maekawa T, Fujita T, Tobimatsu S. Connectopathy in autism spectrum disorders: a review of evidence from visual evoked potentials and diffusion magnetic resonance imaging. Front Neurosci. 2017;11:627. doi:10.3389/fnins.2017.0062729170625
- Hoppenbrouwers M, Vandermosten M, Boets B. Autism as a disconnection syndrome: a qualitative and quantitative review of diffusion tensor imaging studies. Res Autism Spectr Disord. 2014;8:387–412. doi:10.1016/j.rasd.2013.12.018
- Verhoeven JS, Rommel N, Prodi E, et al. Is there a common neuroanatomical substrate of language deficit between autism spectrum disorder and specific language impairment? Cereb Cortex. 2012;22:2263–2271. doi:10.1093/cercor/bhr11522047968
- Roberts TPL, Heiken K, Zarnow D, et al. Left hemisphere diffusivity of the arcuate fasciculus: influences of autism spectrum disorder and language impairment. AJNR Am J Neuroradiol. 2014;35:587–592. doi:10.3174/ajnr.A375424335547
- Vydrova R, Komarek V, Sanda J, et al. Structural alterations of the language connectome in children with specific language impairment. Brain Lang. 2015;151:35–41. doi:10.1016/j.bandl.2015.10.00326609941
- Hirose K, Miyata J, Sugihara G, et al. Fiber tract associated with autistic traits in healthy adults. J Psychiatr Res. 2014;59:117–124. doi:10.1016/j.jpsychires.2014.09.00125266474
- Boets B, Van Eylen L, Sitek K, et al. Alterations in the inferior longitudinal fasciculus in autism and associations with visual processing: a diffusion-weighted MRI study. Mol Autism. 2018;9:10. doi:10.1186/s13229-018-0188-629449909
- Herbet G, Zemmoura I, Duffau H. Functional anatomy of the inferior longitudinal fasciculus: from historical reports to current hypotheses. Front Neuroanat. 2018;12:77. doi:10.3389/fnana.2018.0007730283306
- World Health Organization. International Classification of Diseases. (10th Ed.). Geneva: WHO; 1992.
- Lord C, Risi S, Lambrecht L, et al. The autism diagnostic observation schedule-generic: a standard measure of social and communication deficits associated with the spectrum of autism. J Autism Dev Disord. 2000;30:205–223.11055457
- Lord C, Rutter M, LeCouteur A. Autism diagnostic interview - revised: a revised version of a diagnostic interview for caregivers of individuals with possible pervasive developmental disorders. J Autism Dev Disord. 1994;24:659–685.7814313
- McGhee R, Ehrler DJ, DiSimoni F. Token Test for Children. Examiner’s Manual. 2nd ed. Austin, TX: Pro-Ed; 2007.
- Pickering SJ, Gathercole SE. Working Memory Test Battery for Children. London: Psychological Corporation UK; 2001.
- Williams J, Scott F, Stott C, et al. The CAST (childhood asperger syndrome test). Autism. 2005;9:45–68. doi:10.1177/136236130504902915618262
- Smith SM, Jenkinson M, Woolrich MW, et al. Advances in functional and structural MR image analysis and implementation as FSL. NeuroImage. 2004;23(S1):208–219. doi:10.1016/j.neuroimage.2004.07.051
- Woolrich MW, Jbabdi S, Patenaude B, et al. Bayesian analysis of neuroimaging data in FSL. NeuroImage. 2009;45:S173–186. doi:10.1016/j.neuroimage.2008.10.05519059349
- Jenkinson M, Beckmann CF, Behrens TE, Woolrich MW, Smith SM. FSL. NeuroImage. 2012;62:782–790. doi:10.1016/j.neuroimage.2011.09.01521979382
- Andersson JLR, Skare S, Ashburner J. How to correct susceptibility distortions in spin-echo echo-planar images: application to diffusion tensor imaging. NeuroImage. 2003;20:870–888. doi:10.1016/S1053-8119(03)00336-714568458
- Smith SM. Fast robust automated brain extraction. Hum Brain Mapp. 2002;17:143–155. doi:10.1002/hbm.1006212391568
- Jenkinson M, Smith SM. A global optimisation method for robust affine registration of brain images. Med Image Anal. 2001;5:143–156.11516708
- Jenkinson M, Bannister P, Brady JM, Smith SM. Improved optimisation for the robust and accurate linear registration and motion correction of brain images. NeuroImage. 2002;17:825–841.12377157
- Greve DN, Fischl B. Accurate and robust brain image alignment using boundary-based registration. NeuroImage. 2009;48:63–72. doi:10.1016/j.neuroimage.2009.06.06019573611
- Rueckert D, Sonoda LI, Hayes C, Hill DLG, Leach MO, Hawkes DJ. Non-rigid registration using free-form deformations: application to breast MR images. IEEE Trans Med Imaging. 1999;18:712–721. doi:10.1109/42.79628410534053
- Andersson JLR, Jenkinson M, Smith S. Non-linear optimisation. FMRIB technical report TR07JA1; 2007 Available from: www.fmrib.ox.ac.uk/analysis/techrep. Accessed 912, 2019.
- Andersson JLR, Jenkinson M, Smith S. Non-linear registration, aka spatial normalisation FMRIB technical report TR07JA2; 2007, Available from: www.fmrib.ox.ac.uk/analysis/techrep. Accessed 912, 2019.
- Behrens TEJ, Woolrich MW, Jenkinson M, et al. Characterization and propagation of uncertainty in diffusion-weighted MR imaging. Magn Reson Med. 2003;50:1077–1088. doi:10.1002/mrm.1060914587019
- Behrens TEJ, Johansen-Berg H, Jbabdi S, Rushworth MFS, Woolrich MW. Probabilistic diffusion tractography with multiple fibre orientations. What can we gain? NeuroImage. 2007;23:144–155. doi:10.1016/j.neuroimage.2006.09.018
- Mazziotta JC, Toga AW, Evans A, Fox P. Lancaster JA probabilistic atlas of the human brain: theory and rationale for its development. NeuroImage. 1995;2:89–101.9343592
- Collins DL, Holmes CJ, Peters TM, Evans AC. Automatic 3-D model-based neuroanatomical segmentation. Hum Brain Mapp. 1995;3:190–208. doi:10.1002/hbm.v3:3
- Giorgio A, Watkins KE, Chadwick M, et al. Longitudinal changes in grey and white matter during adolescence. NeuroImage. 2010;49:94–103. doi:10.1016/j.neuroimage.2009.08.00319679191
- Chen JL, Kumar S, Williamson VJ, Scholz J, Griffiths TD, Stewart L. Detection of the arcuate fasciculus in congenital amusia depends on the tractography algorithm. Front Psychol. 2015;6:9. doi:10.3389/fpsyg.2015.0000925653637
- Jones DK, Griffin LD, Alexander DC, et al. Spatial normalization and averaging of diffusion tensor MRI data sets. NeuroImage. 2002;17:592–617.12377137
- Catani M, Thiebaut de Schotten M. A diffusion tensor imaging tractography atlas for virtual in vivo dissections. Cortex. 2008;44:1105–1132. doi:10.1016/j.cortex.2008.05.00418619589
- Smith SM, Jenkinson M, Johansen-Berg H, et al. Tract-based spatial statistics: voxelwise analysis of multi-subject diffusion data. NeuroImage. 2006;31:1487–1505. doi:10.1016/j.neuroimage.2006.02.02416624579
- R Core Team. R: A Language and Environment for Statistical Computing. Vienna, Austria: R Foundation for Statistical Computing; 2019 Available from: http://www.R-project.org/. Accessed 912, 2019.
- Kumar A, Sundaram SK, Sivaswamy L, et al. Alterations in frontal lobe tracts and corpus callosum in young children with autism spectrum disorder. Cereb Cortex. 2010;20:2103–2113. doi:10.1093/cercor/bhp27820019145
- Barnea-Goraly N, Lotspeich LJ, Reiss AL. Similar white matter aberrations in children with autism and their unaffected siblings. Arch Gen Psychiatry. 2010;67:1052–1060. doi:10.1001/archgenpsychiatry.2010.12320921121
- Bloemen OJ, Deeley Q, Sundram F, et al. White matter integrity in asperger syndrome: a preliminary diffusion tensor magnetic resonance imaging study in adults. Autism Res. 2010;3:203–213. doi:10.1002/aur.14620625995
- Noriuchi M, Kikuchi Y, Yoshiura T, et al. Altered white matter fractional anisotropy and social impairment in children with autism spectrum disorder. Brain Res. 2010;1362:141–149. doi:10.1016/j.brainres.2010.09.05120858472
- Sahyoun CP, Belliveau JW, Mody M. White matter integrity and pictorial reasoning in high-functioning children with autism. Brain Cogn. 2010;73:180–188. doi:10.1016/j.bandc.2010.05.00220542370
- Groen WB, Buitelaar JK, van der Gaag RJ, Zwiers MP. Pervasive microstructural abnormalities in autism: a DTI study. J Psychiatry Neurosci. 2011;36:32–40. doi:10.1503/jpn.09010020964953
- Jou RJ, Jackowski AP, Papademetris X, Rajeevan N, Staib LH, Volkmar FR. Diffusion tensor imaging in autism spectrum disorders: preliminary evidence of abnormal neural connectivity. Aust N Z J Psychiatry. 2011;45:153–162. doi:10.3109/00048674.2011.62366021128874
- Jou RJ, Mateljevic N, Kaiser MD, Sugrue DR, Volkmar FR, Pelphrey KA. Structural neural phenotype of autism: preliminary evidence from a diffusion tensor imaging study using tract-based spatial statistics. AJNR Am J Neuroradiol. 2011;32:1607–1613. doi:10.3174/ajnr.A255821799040
- Shukla DK, Keehn B, Smylie DM, Muller RA. Microstructural abnormalities of short-distance white matter tracts in autism spectrum disorder. Neuropsychologia. 2011;49:1378–1382. doi:10.1016/j.neuropsychologia.2011.05.02221333661
- Itahashi T, Yamada T, Nakamura M, et al. Linked alterations in gray and white matter morphology in adults with high-functioning autism spectrum disorder: a multimodal brain imaging study. Neuroimage Clin. 2015;7:155–169. doi:10.1016/j.nicl.2014.11.01925610777
- Cheng Y, Chou KH, Chen IY, Fan YT, Decety J, Lin CP. Atypical development of white matter microstructure in adolescents with autism spectrum disorders. NeuroImage. 2010;50:873–882. doi:10.1016/j.neuroimage.2010.01.01120074650
- Cheung C, Chua SE, Khong PL, et al. White matter fractional anisotrophy differences and correlates of diagnostic symptoms in autism. J Child Psychol Psychiatry. 2009;50:1102–1112. doi:10.1111/j.1469-7610.2009.02086.x19490309
- Billeci L, Calderoni S, Tosetti M, Catani M, Muratori F. White matter connectivity in children with autism spectrum disorders: a tract-based spatial statistics study. BMC Neurol. 2012;12:148. doi:10.1186/1471-2377-12-14823194030
- Kirkovski M, Enticott PG, Maller JJ, Rossell SL, Fitzgerald PB. Diffusion tensor imaging reveals no white matter impairments among adults with autism spectrum disorder. Psychiatry Res. 2015;233:64–72. doi:10.1016/j.pscychresns.2015.05.00326032898
- Lazar M, Miles LM, Babb JS, Donaldson JB. Axonal deficits in young adults with high functioning autism and their impact on processing speed. Neuroimage Clin. 2014;4:417–425. doi:10.1016/j.nicl.2014.01.01424624327
- Pugliese L, Catani M, Ameis S, et al. The anatomy of extended limbic pathways in asperger syndrome: a preliminary diffusion tensor imaging tractography study. NeuroImage. 2008;47:427–434. doi:10.1016/j.neuroimage.2009.05.014
- Naigles LR, Johnson R, Mastergeorge A, et al. Neural correlates of language variability in preschool-aged boys with autism spectrum disorder. Autism Res. 2017;10:1107–1119. doi:10.1002/aur.175628301102
- Bradstreet LE, Hecht EE, King TZ, Turner JL, Robins DL. Associations between autistic traits and fractional anisotropy values in white matter tracts in a nonclinical sample of young adults. Exp Brain Res. 2017;235:259–267. doi:10.1007/s00221-016-4791-527699442
- Happe F, Ronald A, Plomin R. Time to give up on a single explanation for autism. Nat Neurosci. 2006;9:1218–1220. doi:10.1038/nn177017001340
- Hrdlicka M, Dudova I. Controversies in autism: is a broader model of social disorders needed? Child Adolesc Psychiatry Ment Health. 2013;7:9. doi:10.1186/1753-2000-7-923506384
- Johnson MH. Autism as an adaptive common variant pathway for human brain development. Dev Cogn Neurosci. 2017;25:5–11. doi:10.1016/j.dcn.2017.02.00428233663
- Zhang F, Savadjiev P, Cai W, et al. Whole brain white matter connectivity analysis using machine learning: an application to autism. NeuroImage. 2018;172:826–837. doi:10.1016/j.neuroimage.2017.10.02929079524
- Catani M, Jones DK, Daly E, et al. Altered cerebellar feedback projections in asperger syndrome. NeuroImage. 2008;41:1184–1191. doi:10.1016/j.neuroimage.2008.03.04118495494