
Abstract
Aim
Post-stroke depression (PSD) is one of the most frequent neuropsychiatric disorders associated with stroke characterized by depression. The neuroplasticity hypothesis postulates that loss of brain-derived neurotrophic factor (BDNF) plays a major role in pathophysiology of PSD, and restoration of it may represent a critical mechanism underlying antidepressant efficacy.
Methods
In previous studies, we designed a new fusion gene, HA2TAT-BDNF, and cloned it into adenovirus associated virus (AAV) to construct the BDNF-HA2TAT/AAV for the delivery of BDNF to central nervous system (CNS) via nose-brain pathway. In this study, we used it to explore the antidepressant effects on PSD rats through behavioral and various histological methods, and try to find out its specific mechanism.
Results
Compared with the control group, the PSD+AAV group showed decreased sucrose consumption percentage in the sucrose preference test (SPT) (P < 0.001) and prolonged immobility in the forced swimming test (FST) (P=0.000). However, the nasal administration of BDNF-HA2TAT/AAV reversed results of these two behavioral tests (P>0.05, P >0.05), showing an adequate antidepressant effect. Compared with the control group, the concentrations of BDNF mRNA and protein in the hippocampus (P< 0.05, P < 0.01) and prefrontal cortex (P < 0.01, P < 0.01) of PSD rats both decreased. Increased BDNF mRNA and protein expression was observed in the prefrontal cortex (P > 0.05, P < 0.05), without notable change in the hippocampus (P < 0.05, P < 0.001) of PSD+BDNF rats.
Conclusion
These results suggest that BDNF reductions in the prefrontal cortex and hippocampus are associated with the development of post-stroke depression, and that increased levels of BDNF in the prefrontal cortex could be used as a therapeutic target to treat PSD. However, the exact mechanism of BDNF action remains unclear in this regard, hindering the wider application of our method. We expect that our research could facilitate the exploration of pathogenesis and the new treatment method of PSD.
Introduction
In 2010, the Global Burden of Disease estimated that stroke was the second most common cause of death and the third most common cause of disability-adjusted life-years worldwide.Citation1 Post-stroke depression (PSD) is the most frequent neuropsychiatric consequence of stroke, accounting for 60% of all mental disorder complications. Moreover, 19% of PSD cases involve major depressive disorder, which is linked to high mortality and low recovery of mental function.Citation2,Citation3 The pathogenesis of PSD is complex and largely unclear, with both biological and social-psychological factors believed to be involved. Among the biological models of PSD pathogenesis, there are four major hypothetical categories: stroke location, neurobiological pathways, inflammation, and gene polymorphism. Current studies on PSD pathogenesis at the molecular level are focused on neurotrophins: a family of proteins that regulate multiple neuronal functions.Citation4
As a member of the neurotrophin family, brain-derived neurotrophic factor (BDNF) plays an important role in neocortex development, as well as in the survival, growth, proliferation, and differentiation of neurons. It is expressed in both the central and peripheral nervous systems in mammals, but especially in the cortex and hippocampus.Citation5,Citation6 Previous clinical research has suggested that the serum BDNF concentration might be an early indicator of depression in patients with stroke.Citation7,Citation8 In one study, the serum BDNF concentration doubled in the first 7 days after stroke in patients with PSD. It then decreased after 3–6 months.Citation9 In a rat model of PSD, decreased BDNF expression in the hippocampus aggravated cognitive impairment.Citation10 In a study by Chen et al involving a rat PSD model, a lentiviral vector for BDNF was injected into the hippocampus to induce overexpression; the treatment appeared to alleviate depression-like behaviors in PSD rats.Citation11
The effectiveness of BDNF depends on its local concentration in the central nervous system (CNS), and both peripheral and central administration of BDNF into the brain have proved effective in Central protection.Citation12 However, previous studies have shown that peripheral administration, microinjection,Citation13 and intracerebroventricular injectionCitation14 of BDNF lead to low bioavailabilityCitation15 or even brain tissue damage.
In recent years, the nose-brain pathway has gained increased attention, and the route has been used to administer BDNF and other nerve growth factors into the CNS.Citation16–Citation19 In the present study, we used Adeno-associated virus (AAV) as the vector of gene transfer and combined it with the hydrophobic peptide HA2 and the transmembrane peptide TAT into the fusion vector package HA2-TAT-BDNF/AAV to ensure efficient delivery of BDNF to the CNS via the nose-brain pathway. In previous studies, we found that intranasal administration of constructed BDNF-HA2TAT/AAV exerted anti-depressant effects in mice with chronic mild stress by increasing hippocampal BDNF, suggesting that the BDNF-HA2TAT/AAV did reach the CNS.Citation20 In the present study, we proposed that BDNF-HA2TAT/AAV, delivered via the nasal pathway, has a similar antidepressant effect in PSD rats, and that the specific mechanisms of this effect occur in mood-related brain regions, such as the hippocampus and prefrontal cortex.
Materials and Methods
Animals
Specific-pathogen-free adult male Sprague–Dawley rats (n=83) weighing 220 ± 10 g were purchased from the Experimental Animal Center at Xi’an Jiao Tong University and housed individually under controlled conditions (12:12 hrs light/dark cycle, temperature: 22 ± 2ºC, humidity: 65% ± 5%). The rats had free access to food and tap water. All experimental procedures were approved by the Animal Care and Use Committee of Xi’an Jiaotong University, and the animals were kept and the experiments were performed in accordance with the European community guidelines for the use of experimental animals.
Behavioral Assessment
Open Field Test (OFT)
Between 8:00 and 13:00, the rats were placed individually into an open field chamber (100 × 100 × 45 cm) under a dim light (25 lx) for 1 hr and tracked using a video tracking system (SMART; Panlab SL, Barcelona, Spain). Before each experiment, the box was completely cleaned. The total distance was recorded as locomotion activity.
Forced Swimming Test (FST)
Each rat was placed into a plexiglas barrel (25 cm diameter × 35 cm height) filled with water (depth: 25 cm, temperature: 22 ± 1ºC). This test was carried out twice: 10 mins on the first day and 6 mins on the second day. The animals’ movements were tracked using a video tracking system (SMART; Panlab SL, Barcelona, Spain). The rats were dried immediately after swimming and returned to their home cage. On the second day, the immobility time was recorded.
Sucrose Preference Test (SPT)
To determine anhedonia after the middle cerebral artery occlusion (MCAO) and chronic unpredictable mild stress (CUMS) procedures were completed, we used the SPT as described by Willner.Citation21 It was divided into two parts: (1) A training period, during which the rats were given two drinking bottles for 48 hrs, one containing 1% (w/v) sucrose solution and the other containing tap water; (2) A testing period, before which the rats were deprived of water for 20 hrs. During the test, animals were allowed to consume from both bottles for 1 hr. The baseline measurement period contains the above two parts, including five times of testing. However, during the CUMS period, testing phase only was conducted weekly throughout the CUMS period. The sucrose preference index was calculated using the following formula: sucrose preference = sucrose intake (g)/(sucrose intake (g) + water intake (g).
Animal Experimental Scheme
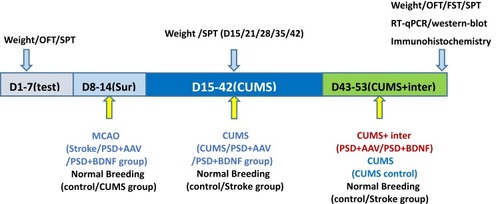
The design of the current study is depicted in . On the basis of baseline weight, total distance in the OFT, and SPT, the 83 rats were randomly assigned into the following five groups: control (n = 16), CUMS (n = 16), and three surgery groups (stroke, PSD+AAV, PSD+BDNF, n = 51). In the second week, right MCAO was performed to establish the stroke model in the surgery groups. During this period, the control and CUMS groups were subjected to normal breeding. In the following 38 days, CUMS, PSD+AAV, and PSD+BDNF groups underwent social isolation followed by the CUMS procedure. In the final 10 days of this period, PSD+AAV and PSD+BDNF groups were administered, respectively, the AAV and BDNF-HA2TAT/AAV viruses (20 µL/day, each side twice, 5ul/times) via the nasal route. During these 38 days, the control and stroke groups were fed normally. Finally, the OFT, FST, and SPT were used to observe depression-like behavior. Eight animals in each group were anesthetized using 10% chloral hydrate (0.4 mL/100 g), delivered via intraperitoneal (ip) injection. BDNF mRNA and protein expression in the hippocampus and prefrontal cortex tissue were then detected in these animals using RT-qPCR and Western-blotting. In all other animals, BDNF protein expression was detected in the hippocampus tissue using immunohistochemistry.
Figure 1 Experimental design.
Modeling Method
In the present study, we adopted right MCAO combined with isolation and CUMS to model PSD. The MCAO protocol was created based on a method described in a previous study.Citation22 Briefly, rats were anesthetized using 10% chloral hydrate (0.4 mL/100 g; ip), a ventral neck incision was made, and the common carotid artery (CCA), external carotid artery (ECA), and internal carotid artery (ICA) were exposed and carefully separated. A small incision was made in the CCA near its bifurcation to allow a 3/0-gauge nylon suture, blunt at its head-end (1 mm), to be advanced from the CCA to the ICA and into the origin of the MCA. The length of the suture entering the ICA from the bifurcation was approximately 18 ± 0.5 mm. The wound was closed immediately after the surgery was completed. Rats with postoperative neurological impairment after 4, 8, and 12 hrs were selected based on the Longa 5-point scoring scale,Citation23 which categorizes neurological damage as follows: (1) normal activities, (2) disorder of upper limbs when hanging upside down by the tail, (3) circling to the left, (4) falling to the left when walking, (5) unconsciousness or death. Rats with a score of 2–4 were chosen at each time point.
One week after surgery, the CUMS procedures were performed using a modified form of the protocol by Willner.Citation24 Nine different stressors were randomly and successively arranged over 6 weeks. The specific contents of this test are shown in (week 1 and week 2 are shown as examples). During the CUMS program, control animals were placed in a separate room and had no contact with the stressed animals.
Table 1 Schedule of the CUMS Procedure
Based on both the literature and our own study, we adopted the approach of intranasal administration. The procedure was as follows: (1) Anesthesia. We anesthetized the rat by placing it in a beaker filled with cotton soaked in diethyl ether. We observed the animal for 20–40 seconds. When it collapsed, we immediately removed it from the beaker and put its head in a backward supine position 45º to the ground; (2) Dripping the virus into the nose. We dripped 5 µL of prepackaged virus into the right and left nostrils of the rat. After 1 min, we assumed that the virus had been absorbed, and we dripped the virus into its nose for a second time. We repeated this procedure until 20 µL of virus solution had been used per day.
Western-Blotting Analysis
After 6 weeks of CUMS, the rats were anesthetized and rapidly decapitated. The prefrontal cortex and hippocampus were quickly separated and stored at ‒80°C until use. Western-blotting was performed as described in a previous study.Citation25 The primary antibodies for rabbit polyclonal anti-BDNF (1:1000 dilution) and mouse polyclonal anti-β-actin (1:5000 dilution) were purchased from Abcam (catalog number: ab108319) and Protein Tech Group (catalog number: 660091lg), respectively. Quantity One software (Bio-Rad, Hercules, CA, USA) was used to analyze the gray values of protein bands.
Real-Time qPCR (RT-qPCR)
Prefrontal cortex and hippocampus tissues were obtained as described above. The RT-qPCR was performed as previously described.Citation26 Specific primers for rat BDNF and GAPDH (control) were designed by Primer Premier 6 and synthesized by Aoke prosperous biotechnology company (Beijing, China). The primer sequences are given in . According to RT-qPCR results, as interpreted using the relative quantitative calculation formula (2–ΔΔCt), we obtained relative expression of BDNF mRNA.
Table 2 Primer Sequences and Lengths of PCR Products
Statistical Analysis
All quantitative data were analyzed using SPSS 22.0 software (SPSS, Tokyo, Japan) and represented as mean ± standard error of mean (SEM). All data were analyzed using one-way analysis of variance (ANOVA), except for the SPT data, which were analyzed using the repeated measures test. P-values <0.05 were considered to indicate a significant difference.
Results
The General Situation
A total of 74 rats conformed with the required deficits in neurological function score after surgery. During the course of the CUMS regimen, a total of 9 rats died. At the end of the experiment, the group numbers were as follows: control group (n = 16), CUMS group (n = 16), stroke group (n = 14), PSD+AAV group (n = 14), and PSD+BDNF group (n = 14).
Neurological Function Assessment
The neurological function of each group was estimated 4, 8, and 12 hrs after MCAO surgery using the Longa 5-point scoring scale. The results are shown in , and there was no significant difference among the three groups.
Table 3 Neurological Function Assessment
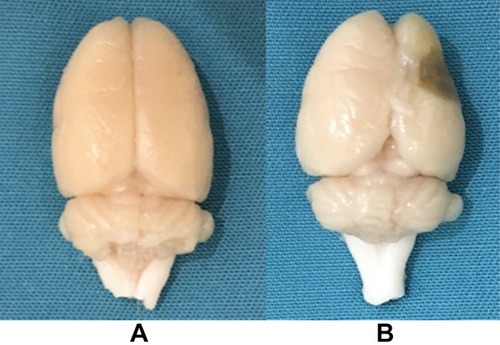
After perfusion with 4% paraformaldehyde, the brain tissue had a largely normal shape in the control, CUMS, and stroke groups (). However, in the PSD group, the brain tissue appeared to atrophy, showing soft lesions and vacuolation in the right side (operated side) ().
Figure 2 (A) The brain tissue of the control group; (B) The brain tissue of the post-stroke depression group.
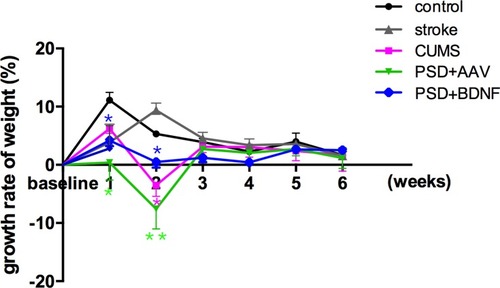
The Effect of PSD and BDNF-HA2TAT/AAV Treatment on Body Weight Gain
Statistical analyses showed no significant difference in the weight of each group before stress. ANOVA analysis with Fisher’s least significant difference (LSD) test showed that, compared with the control group, difference of weight values in the CUMS group (P = 0.00), PSD + AAV group (P = 0.00) and PSD + BDNF group (P = 0.00), and difference of body weight growth rate in the stroke group (P = 0.001), CUMS group (P = 0.015), PSD + AAV group (P = 0.038) and the PSD + BDNF group (P = 0.01) which are negative, both were statistically significant. Subsequent Bonferroni post hoc tests confirmed that compared with the control group, the CMS group (P< 0.01), PSD+AAV group (P < 0.01) and PSD+BDNF group (P < 0.01) showed statistically significant differences in body weight from week 2 of stress. From week 3 to week 5 of stress, the difference in body weight of the above three groups (P < 0.001) was more significant than that of the control group. BDNF-HA2TAT/AAV did not increase body weight in the PSD+BDNF group at week 6 (P < 0.05). All these results are described in and .
Figure 3 Effects of PSD and BDNF-HA2TAT/AAV on body weight. In the first week, CUMS began to cause weight loss; this effect continued until the end of the stress tests. There was no effect on weight after a BDNF-HA2TAT/AAV intervention of 10 days. Error bars represent one standard error of the mean. All data from animal groups: control (n=16), stroke (n=14), CUMS (n=16), PSD+AAV (n=14), PSD+BDNF (n=14). Other groups compared with control: *P<0.05, **P<0.01, ***P<0.001.
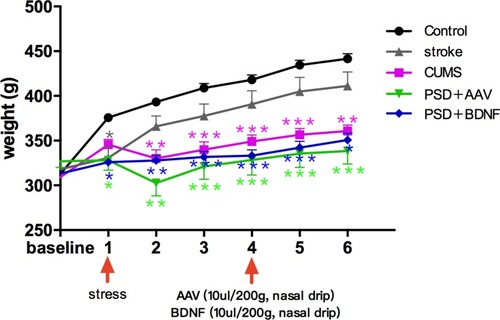
Figure 4 Effects of PSD and BDNF-HA2TAT/AAV on body weight gain. From the first week of CUMS, body weight reduced in each stress group; from the third week, body weight loss had stabilized; BDNF-HA2TAT/AAV intervention had no effect on the rate of body weight change. Error bars represent one standard error of the mean. All data from the animal groups: control (n=16), stroke (n=14), CUMS (n=16), PSD+AAV (n=14), PSD+BDNF (n=14). Other groups were compared with the control group: *P<0.05, **P<0.01.
The Effect of PSD and BDNF-HA2TAT/AAV Treatment on SPT
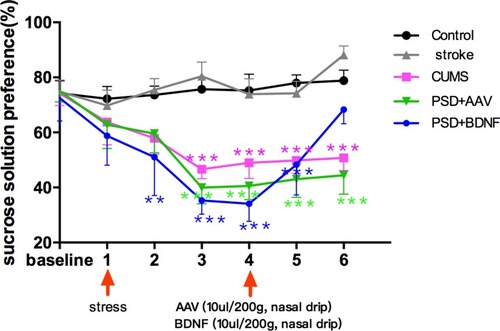
According to the results of the single factor variance analysis and Fisher’s LSD, no significant difference in sucrose solution consumption was found between the control and other groups before surgery (P > 0.05). Starting from the stress at week 1, the sucrose consumption percentage in stress groups (CUMS group, PSD+AAV group, PSD+BDNF group) gradually declined which reached statistical significance until week 3 (all P < 0.001, compared with control group) and persisted week 4 (all P < 0.001). BDNF-HA2TAT/AAV was able to reverse this decrease in sucrose preference of the PSD rats at weeks 6 (P >0.05). These results are shown in .
Figure 5 Effects of PSD and BDNF-HA2TAT/AAV on SPT. In week 3, the sucrose consumption percentage of the rats in the stress groups was significantly lower than in the control group; This gradually reversed over 10 days of BDNF intervention. Error bars represent one standard error of the mean. All data from animal groups: control (n=16), stroke (n=14), CUMS (n=16), PSD+AAV (n=14), PSD+BDNF (n=14). Other groups compared with control group: *P<0.05, **P<0.01, ***P<0.001.
The Effect of PSD and BDNF-HA2TAT/AAV Treatment on OFT and FST
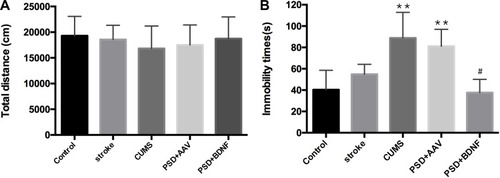
Both before and after the stress, OFT showed no significant difference between the control and other groups (; p > 0.05). As shown, compared with the control group, the immobile time of CUMS (P=0.000) and PSD+AAV group (P=0.000) increased significantly, with statistically significant difference. However, there was no significant difference between the PSD+BDNF group and the control group. Further, compared with the PSD+AAV group, BDNF-HA2TAT/AAV treatment decreased the FST immobility time in week 6 after the last nasal administration (; P< 0.05).
Figure 6 (A) Open field test (OFT). Total distance moved in 1 hr. (B) Forced swimming test (FST): Immobility time in 6 mins. Error bars represent one standard error of the mean. All data from animal groups: control (n=16), stroke (n=14), CUMS (n=16), PSD+AAV (n=14), PSD+BDNF (n=14). Other groups compared with control group: **P<0.01; PSD+BDNF group compared with PSD+AAV group: #P<0.05.
The mRNA Expression Levels of BDNF in the Prefrontal Cortex and Hippocampus of the Rats
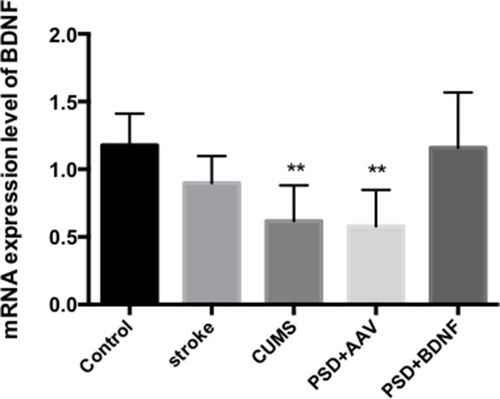
According to the results of single factor variance analysis and Fisher’s LSD inspection, BDNF mRNA levels in the hippocampus were lower in the CUMS (P = 0.01), PSD+AAV (P = 0.01) and PSD+BDNF-HA2TAT/AAV (P = 0.01) groups than in the control group after 10 days of nasal administration (). The BDNF mRNA expression levels in the frontal cortex tissue of the CUMS (P = 0.004) and PSD+AAV (P = 0.002) rats were significantly lower than in the control group. BDNF mRNA levels were higher in the PSD+BDNF group than in the control group, with no significant difference (P > 0.05; ).
Figure 7 BDNF mRNA expression in the hippocampus of PSD rats 10 days after BDNF-HA2TAT/AAV nasal administration (real-time quantitative PCR). Error bars represent one standard error of the mean. All data from animal groups: control (n=8), stroke (n=7), CUMS (n=8), PSD+AAV (n=7), PSD+BDNF (n = 7). Other groups compared with control group: *P<0.05.
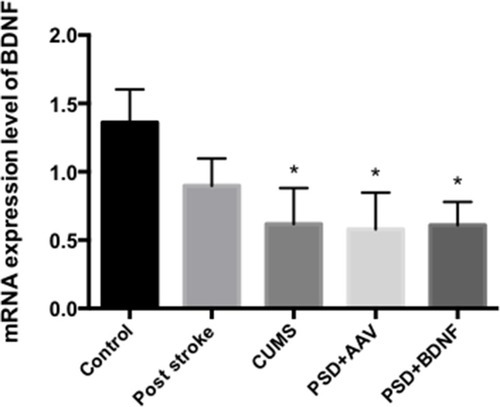
Figure 8 BDNF mRNA expression in the frontal cortex of PSD rats 10 days after BDNF-HA2TAT/AAV nasal administration (real-time quantitative PCR). Error bars represent one standard error of the mean. All data from animal groups: control (n=8), stroke (n=7), CUMS (n=8), PSD+AAV (n=7), BDNF+BDNF (n=7). Other groups compared with control group: **P<0.01.
Effects of PSD and BDNF-HA2TAT/AAV on the Expression of BDNF in the Hippocampus and Prefrontal Cortex
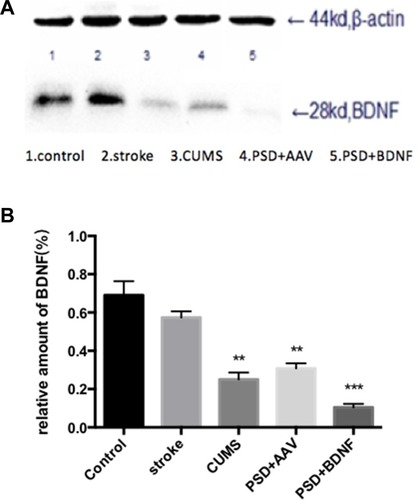
The expression of BDNF protein in the hippocampus and prefrontal cortex are illustrated in and ) and ( and ). In the prefrontal cortex, the BDNF protein expression levels in the CUMS and PSD+AAV group were significantly lower than in the control group (P < 0.01; ). Subsequently, the same analysis was performed on the hippocampal tissue (P < 0.01; ). After nasal administration of BDNF-HA2TAT/AAV, BDNF expression in the prefrontal cortex was higher in rats receiving PSD procedures than in the control group (P < 0.05; ). This effect was not seen in the hippocampus (P < 0.001; ), suggesting that the effects of BDNF-HA2TAT/AAV on BDNF expression are brain region-specific.
Figure 9 (A, B) BDNF protein expression levels in the frontal cortex 10 days after BDNF-HA2TAT/AAV nasal administration (Western blot). Lanes 1–5 represent a single individual in the same group. Error bars represent one standard error of the mean. All data from animal groups: Control (n=8), Stroke (n=7), CUMS (n=8), PSD+AAV (n=7), PSD+BDNF (n = 7). Other groups compared with control group: *P<0.05, **P<0.01.
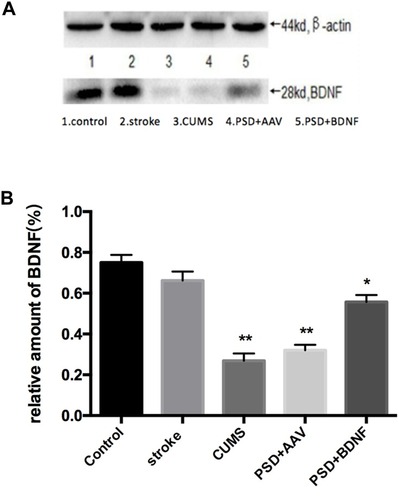
Figure 10 (A, B) BDNF protein expression levels in the hippocampus 10 days after BDNF-HA2TAT/AAV nasal administration (Western blot). Lanes 1–5 represent a single individual in the same group. Error bars represent one standard error of the mean. All data from animal groups: Control (n=8), Stroke (n=7), CUMS (n=8), PSD+AAV (n=7), PSD+BDNF (n=7). Other groups compared with control group: **P<0.01, ***P<0.001.
Effects of PSD on the Expression of BDNF in the Hippocampus
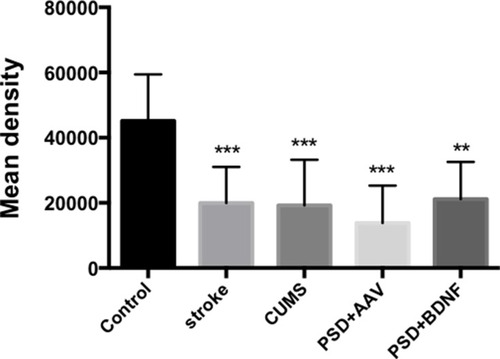
In the present study, immunohistochemistry was used to assess BDNF expression in hippocampal neurons (CA1, CA2, and CA3). As shown in , under the light microscope, cells expressing BDNF showed brown coloration, mainly in the cytoplasm and outside the cells. In the CA1 of the hippocampus, BDNF protein expression levels in the PSD+AAV (P = 0.001) and PSD+BDNF (P = 0.013) groups were significantly lower than in the control group. In the CA2 and CA3 regions, BDNF expression was lower in the stroke group than in the control group (P = 0.001, P = 0.007), CUMS group (P = 0.000, P = 0.002), PSD+AAV group (P = 0.001, P = 0.004), and PSD+BDNF group (P = 0.021, P = 0.042) ( and ). In summary, BDNF expression in the stroke (P = 0.001), CUMS (P = 0.000), PSD+AAV (P = 0.001), and PSD+BDNF group (P = 0.001) was lower than in the control group, as shown in .
Figure 11 (A, B) BDNF protein expression levels in the CA1 region of the hippocampus 10 days after BDNF-HA2TAT/AAV nasal administration (immunohistochemistry). Error bars represent one standard error of the mean. All data from animal groups: control (n=8), stroke (n=7), CUMS (n=8), PSD+AAV (n=7), PSD+BDNF (n=7). Other groups compared with control group: *P<0.05, **P<0.01.
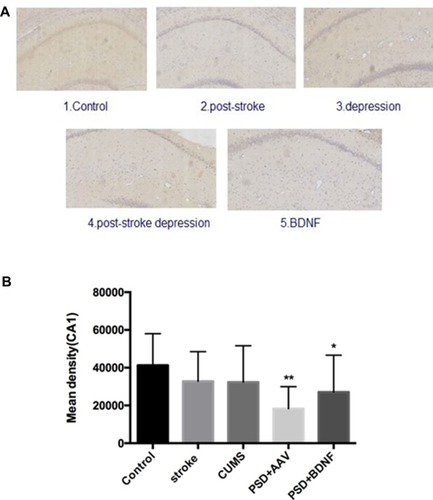
Figure 12 (A, B) BDNF protein expression levels in the CA2 region of the hippocampus 10 days after BDNF-HA2TAT/AAV nasal administration (immunohistochemistry). Error bars represent one standard error of the mean. All data from animal groups: control (n=8), stroke (n=7), CUMS (n=8), PSD+AAV (n=7), BDNF+BDNF (n=7). Other groups compared with control group: *P<0.05, **P<0.01, ***P<0.001.
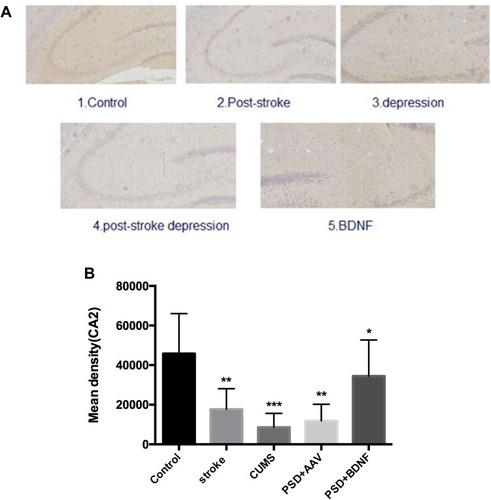
Figure 13 (A, B) BDNF protein expression levels in the CA3 region of the hippocampus 10 days after BDNF-HA2TAT/AAV nasal administration (immunohistochemistry). Error bars represent one standard error of the mean. All data from animal groups: Control (n=8), Stroke (n=7), CUMS (n=8), PSD+AAV (n=7), PDS+BDNF (n=7). Other groups compared with control group: *P<0.05, **P<0.01.
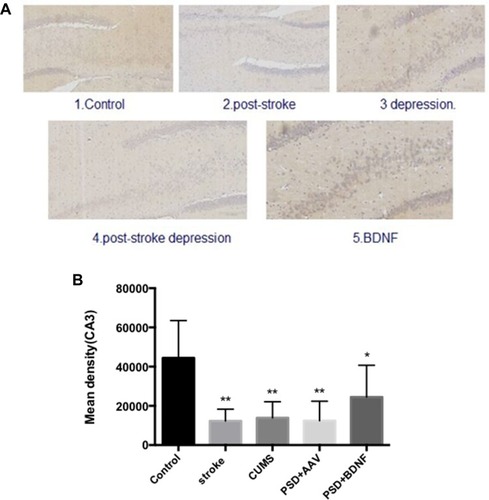
Figure 14 BDNF protein expression levels in the hippocampus 10 days after BDNF-HA2TAT/AAV nasal administration (immunohistochemistry). Error bars represent one standard error of the mean. All data from animal groups: Control (n=8), Stroke (n=7), CUMS (n=8), PSD+AAV (n=7), PSD+BDNF (n=7). Other groups compared with control group: **P<0.01, ***P<0.001.
Discussion
The animal model used in the present study is widely recognized in studies of pathogenesis and mechanisms of drug action in PSD. The model involves cerebral ischemia induced by right MCAO followed by exposure to CUMS combined with single housing. The current protocol caused extensive behavioral changes in rats that resembled depression-like symptoms seen in humans after a stroke, including (1) impaired neurological function that was similar to the clinical symptoms of patients with stroke, (2) reduced preference for sucrose consumption, an indicator of anhedonia,Citation24 (3) increased immobility time in the FST, an indicator of behavioral despair, and (4) decreased body weight gain, which is a correlate of stress in rats.
The weight of the rats in the stressed group was significantly decreased. Willner et al speculated that this weight decline is due to loss of appetite,Citation21 a conclusion that was corroborated by clinical trials.Citation27 In the present study, we confirmed that venlafaxine did not effectively reverse this weight lost in an animal model, similar to previous literature.Citation28 Progressive decline in dynamic sucrose preference, as seen in the CUMS and PSD groups in the present study, is an indication of anhedonia: the core symptom of depression. This suggested that the PSD rats suffered longer-lasting and more severe anhedonia after exposure to surgery and stress than the CUMS rats. It follows that, in addition to chronic stressors, MCAO ischemia may directly affect the neural circuits involved in mood regulation in PSD models.Citation29 Administration of BDNF-HA2TAT/AAV reversed the degree of sucrose preference in PSD rats to alleviate their anhedonia. CUMS and PSD application in the present study did not modify the rats’ activity in the OFT, which corroborates studies reporting unchanged motor activity after exposure of male rodents to CUMS and PSD.Citation30–Citation32 As expected, the FST showed an immobility time-decreasing effect in PSD rats after BDNF-HA2TAT/AAV intranasal delivery, an indicator of anti-depressive behavior.
In recent years, intranasal administration has offered a non-invasive method of drug delivery that bypasses the blood-brain barrier and directly targets the CNS. Thus, we enriched two cell-penetrating peptides (TAT and HA2) with the BDNF gene then packaged these into AAV: a promising vector for in vivo gene transfer.Citation33,Citation34 The resulting BDNF-HA2TAT/AAV could deliver BDNF to the CNS via the nose-brain pathway. Our previous studies showed that intranasal administration of BDNF-HA2TAT/AAV increased hippocampal BDNF expression and reversed anhedonia in CUMS mice with behavioral despair and depression-like symptoms.Citation20
Most previous studies have shown that the prefrontal cortex and hippocampus are involved in emotion, learning, and memory, and that there are cortex-cortical loop neural connections between them.Citation35,Citation36 Relevant animal experiments have shown that enhancement of BDNF signaling may be a key mechanism by which cognitive stimulation and antidepressant drugs preserve brain function in PSD rats.Citation11,Citation37,Citation38 Few PSD studies have investigated the prefrontal cortex, although one animal model study showed that PSD rats exhibited depression-like behavior and decreased BDNF expression in the prefrontal cortex and hippocampus, and that these symptoms were reversed and ameliorated after treatment with increasing doses of a natural polyphenol (trans-resveratrol).Citation39
The present study found that mRNA and protein expression of BDNF in the hippocampus and prefrontal cortex decreased in the CUMS and PSD+AAV groups, while intranasal administration of BDNF-HA2TAT/AAV increased BDNF mRNA and protein expression in the prefrontal cortex only. This indicates that the reduction of BDNF expression in both the hippocampus and prefrontal cortex may work synergistically in the pathogenesis of PSD in rats. Conversely, the increase in BDNF levels in the prefrontal cortex may underlie the antidepressant mechanism of BDNF-HA2TAT/AAV intranasal administration in the PSD model. Studies have shown that this mechanism is likely to be increased before the antidepressant frontal cortex neurons cAMP signal transduction, so CREB (responsive element binding protein) expression and regulation function, and promote the expression of BDNF and achieve nerve plasticity, play an effective anti-depressant effect.Citation40
On the other hand, it may be that BDNF is not elevated in the hippocampus because of irreversible damage in neural circuits from the olfactory nerve to the hippocampus after stroke. Such damage would prevent the BDNF from reaching the hippocampus in the present model. Nonetheless, the mechanisms of BDNF-HA2TAT/AAV nasal administration in the prefrontal cortex of PSD rats should be investigated further.
Conclusions
In the present study, BDNF-HA2TAT/AAV nasal administration improved depression-like behavior in PSD model rats with significant anhedonia and behavioral despair. The concentrations of BDNF mRNA and protein in the hippocampus and prefrontal cortex of PSD rats both decreased. Increased BDNF-HA2TAT mRNA and protein expression was observed in the prefrontal cortex, without notable change in the hippocampus. These results suggest that BDNF reductions in the prefrontal cortex and hippocampus are associated with the development of post-stroke depression, and that increased levels of BDNF in the prefrontal cortex could be used as a therapeutic target to treat PSD. However, the exact mechanism of BDNF action remains unclear in this regard, hindering the wider application of our method. Future studies using more sophisticated protein tracking and quantification would shed further light in this area.
Abbreviations
AAV, Adenovirus associated virus; ANOVA, Analysis of variance; BDNF, Brain-derived neurotrophic factor; CNS, Central nervous system; CUMS, Chronic unpredictable mild stress; CCA, Common carotid artery; CREB, CAMP-response element binding protein; ECA, External carotid artery; FST, Forced swimming test; LSD, Fisher’s least significant difference; MCAO, Middle cerebral artery occlusion; OFT, Open field test; PSD, Post-stroke depression; RT-qPCR, Real-time qPCR; SD, Sprague–dawley; SPT, Sucrose preference test; ICA, Internal carotid artery.
Ethics Approval
All animals were kept and the experiments were performed in accordance with the European Community guidelines for the use of experimental animals.
Acknowledgments
The project was supported by research funds from the National Science Foundation of China (NSFC No.81171256, 81271487).
Disclosure
The authors report no conflicts of interest in this work.
Additional information
Funding
References
- Feigin VL, Forouzanfar MH, Krishnamurthi R, et al. Global and regional burden of stroke during 1990–2010: findings from the Global Burden of Disease Study 2010. Lancet. 2014;383(9913):245–255. doi:10.1016/S0140-6736(13)61953-424449944
- Starkstein SE. The Clinical Neuropsychiatry of Stroke. BMJ Publishing Group Ltd; 2007.
- Angelelli P, Paolucci S, Bivona U, et al. Development of neuropsychiatric symptoms in poststroke patients: a cross-sectional study. Acta Psychiatr Scand. 2004;110(1):55–63. doi:10.1111/acp.2004.110.issue-115180780
- Numakawa T, Adachi N, Richards M, et al. Brain-derived neurotrophic factor and glucocorticoids: reciprocal influence on the central nervous system. Neuroscience. 2013;239:157–172. doi:10.1016/j.neuroscience.2012.09.07323069755
- Murer MG, Yan Q, Raisman-Vozari R. Brain-derived neurotrophic factor in the control human brain, and in alzheimer’s disease and parkinson’s disease. Prog Neurobiol. 2001;63(1):71–124. doi:10.1016/S0301-0082(00)00014-911040419
- Wetmore C, Ernfors P, Persson H, et al. Localization of brain-derived neurotrophic factor mRNA to neurons in the brain by in situ hybridization. Exp Neurol. 1990;109(2):141–152. doi:10.1016/0014-4886(90)90068-42379553
- Yang L, Zhang Z, Sun D, et al. Low serum BDNF may indicate the development of PSD in patients with acute ischemic stroke. Int J Geriatr Psychiatry. 2011;26(5):495–502. doi:10.1002/gps.255220845405
- Hu Y, Russek SJ. BDNF and the diseased nervous system: a delicate balance between adaptive and pathological processes of gene regulation. J Neurochem. 2008;105(1):1–17. doi:10.1111/j.1471-4159.2008.05237.x18208542
- Zhou Z, Lu T, Xu G, et al. Decreased serum brain-derived neurotrophic factor (BDNF) is associated with post-stroke depression but not with BDNF gene Val66Met polymorphism. Clin Chem Lab Med. 2011;49(2):185–189. doi:10.1515/CCLM.2011.03921143020
- Zhang Z-H, WU L-N, SONG J-G, et al. Correlations between cognitive impairment and brain-derived neurotrophic factor expression in the hippocampus of post-stroke depression rats. Mol Med Rep. 2012;6(4):889–893. doi:10.3892/mmr.2012.100922842820
- Chen -H-H, Zhang N, Li W-Y, et al. Overexpression of brain-derived neurotrophic factor in the hippocampus protects against post-stroke depression. Neural Regen Res. 2015;10(9):1427–1432. doi:10.4103/1673-5374.16551026604903
- Schabitz W-R, Schwab S, Spranger M, et al. Intraventricular brain-derived neurotrophic factor reduces infarct size after focal cerebral ischemia in rats. J Cereb Blood Flow Metab. 1997;17(5):500–506. doi:10.1097/00004647-199705000-000039183287
- Zhang Z, Wang X, Wang W, et al. Brain-derived neurotrophic factor-mediated downregulation of brainstem K+-Cl- cotransporter and cell-type-specific GABA impairment for activation of descending pain facilitation. Mol Pharmacol. 2013;84(4):511–520. doi:10.1124/mol.113.08649623847084
- Burke MA, Mobley WC, Cho J, et al. Loss of developing cholinergic basal forebrain neurons following excitotoxic lesions of the hippocampus: rescue by neurotrophins. Exp Neurol. 1994;130(2):178–195. doi:10.1006/exnr.1994.11977867749
- Vaka SRK, Murthy SN, Balaji A, et al. Delivery of brain-derived neurotrophic factor via nose-to-brain pathway. Pharm Res. 2012;29(2):441–447. doi:10.1007/s11095-011-0572-921879386
- Murtha LA, Yang Q, Parsons MW, et al. Cerebrospinal fluid is drained primarily via the spinal canal and olfactory route in young and aged spontaneously hypertensive rats. Fluids Barriers CNS. 2014;11:12. doi:10.1186/2045-8118-11-1224932405
- Hanson LR, Frey WH 2nd. Strategies for intranasal delivery of therapeutics for the prevention and treatment of neuroAIDS. J Neuroimmune Pharmacol. 2007;2(1):81–86. doi:10.1007/s11481-006-9039-x18040829
- Frey WH, Liu J, Chen X, et al. Delivery of 125I-NGF to the brain via the olfactory route. Drug Deliv. 1997;4(2):87–92. doi:10.3109/10717549709051878
- Vaka SRK, Sammeta SM, Day LB, et al. Delivery of nerve growth factor to brain via intranasal administration and enhancement of brain uptake. J Pharm Sci. 2009;98(10):3640–3646. doi:10.1002/jps.2167419156912
- Ma X-C, Liu P, Zhang X-L, et al. Intranasal delivery of recombinant AAV containing BDNF fused with HA2TAT: a potential promising therapy strategy for major depressive disorder. Sci Rep. 2016;6:22404. doi:10.1038/srep2240426935651
- Willner P. Validity, reliability and utility of the chronic mild stress model of depression: a 10-year review and evaluation. Psychopharmacology. 1997;134(4):319–329. doi:10.1007/s002130050456
- Laing RJ, Jakubowski J, Laing RW. Middle cerebral artery occlusion without craniectomy in rats. Which method works best? Stroke. 1993;24(2):294–7; discussion 297–8. doi:10.1161/01.STR.24.2.294
- Longa EZ, Weinstein PR, Carlson S, et al. Reversible middle cerebral artery occlusion without craniectomy in rats. Stroke. 1989;20(1):84–91. doi:10.1161/01.STR.20.1.842643202
- Willner P, Muscat R, Papp M. Chronic mild stress-induced anhedonia: a realistic animal model of depression. Neurosci Biobehav Rev. 1992;16(4):525–534. doi:10.1016/S0149-7634(05)80194-01480349
- Shi -S-S, Shao S-H, Yuan B-P, et al. Acute stress and chronic stress change brain-derived neurotrophic factor (BDNF) and tyrosine kinase-coupled receptor (TrkB) expression in both young and aged rat hippocampus. Yonsei Med J. 2010;51(5):661–671. doi:10.3349/ymj.2010.51.5.66120635439
- Zhang L, Zhao H, Zhang X, et al. Nobiletin protects against cerebral ischemia via activating the p-Akt, p-CREB, BDNF and Bcl-2 pathway and ameliorating BBB permeability in rat. Brain Res Bull. 2013;96:45–53. doi:10.1016/j.brainresbull.2013.04.00923644141
- Dwyer Hollender K. Screening, diagnosis, and treatment of post-stroke depression. J Neurosci Nurs. 2014;46(3):135–141. doi:10.1097/JNN.000000000000004724670433
- Wang SH, Zhang ZJ, Guo YJ, et al. Anhedonia and activity deficits in rats: impact of post-stroke depression. J Psychopharmacol. 2009;23(3):295–304. doi:10.1177/026988110808981418562439
- Robinson RG, Kubos KL, Starr LB, et al. Mood disorders in stroke patients: importance of location of lesion. Brain. 1984;107(1):81–93. doi:10.1093/brain/107.1.816697163
- Duncko R, Kiss A, Škultétyová I, et al. Corticotropin-releasing hormone mRNA levels in response to chronic mild stress rise in male but not in female rats while tyrosine hydroxylase mRNA levels decrease in both sexes. Psychoneuroendocrinology. 2001;26(1):77–89. doi:10.1016/S0306-4530(00)00040-811070336
- Dalla C, Antoniou K, Drossopoulou G, et al. Chronic mild stress impact: are females more vulnerable? Neuroscience. 2005;135(3):703–714. doi:10.1016/j.neuroscience.2005.06.06816125862
- Wang S, Sun H, Liu S, et al. Role of hypothalamic cannabinoid receptors in post-stroke depression in rats. Brain Res Bull. 2016;121:91–97. doi:10.1016/j.brainresbull.2016.01.00626778127
- Miyake N, Miyake K, Yamamoto M, et al. Global gene transfer into the CNS across the BBB after neonatal systemic delivery of single-stranded AAV vectors. Brain Res. 2011;1389:19–26. doi:10.1016/j.brainres.2011.03.01421397590
- Crystal RG. Adenovirus: the first effective in vivo gene delivery vector. Hum Gene Ther. 2014;25(1):3–11. doi:10.1089/hum.2013.252724444179
- Dolan RJ. Emotion, cognition, and behavior. Science. 2002;298(5596):1191–1194. doi:10.1126/science.107635812424363
- LeDoux JE. Emotion circuits in the brain. Annu Rev Neurosci. 2000;23:155–184. doi:10.1146/annurev.neuro.23.1.15510845062
- Han BH, Holtzman DM. BDNF protects the neonatal brain from hypoxic-ischemic injury in vivo via the ERK pathway. J Neurosci. 2000;20(15):5775–5781. doi:10.1523/JNEUROSCI.20-15-05775.200010908618
- Mattson MP, Maudsley S, Martin B. BDNF and 5-HT: a dynamic duo in age-related neuronal plasticity and neurodegenerative disorders. Trends Neurosci. 2004;27(10):589–594. doi:10.1016/j.tins.2004.08.00115374669
- Pang C, Cao L, Wu F, et al. The effect of trans-resveratrol on post-stroke depression via regulation of hypothalamus-pituitary-adrenal axis. Neuropharmacology. 2015;97:447–456. doi:10.1016/j.neuropharm.2015.04.01725937213
- Tardito D, Perez J, Tiraboschi E, et al. Signaling pathways regulating gene expression, neuroplasticity, and neurotrophic mechanisms in the action of antidepressants: a critical overview. Pharmacol Rev. 2006;58(1):115–134. doi:10.1124/pr.58.1.716507885