
Abstract
Objective
The underlying neural correlates of psychogenic non-epileptic seizures (PNES) are still unknown and their identification would be helpful for clinicians and patients. This study aimed to reveal details of white matter microstructure and alterations in brain structural networks in patients with PNES by using diffusion tensor imaging (DTI) and graph theoretical connectivity analysis.
Methods
Seventeen patients with PNES and 26 age- and sex-matched healthy controls were enrolled. All participants underwent DTI on a 3.0-T MRI scanner, and fractional anisotropy (FA) and mean diffusivity (MD) maps were compared by tract-based spatial statistics. Additionally, the structural networks derived from DTI data were analyzed using graph theory and two different parcellation schemes.
Results
Patients with PNES showed widespread decreases in FA and increases in MD, particularly in the deep white matter. In addition, graph theoretical analysis revealed impaired brain networks in PNES, including increased path length, decreased network efficiency, altered nodal topology, and reduced regional connectivity in the right posterior areas.
Conclusion
We found widely impaired white matter integrity and impaired brain structural networks in Japanese patients with PNES. These findings contribute to the accumulation of evidence on PNES and may improve understanding of this condition.
Introduction
Psychogenic non-epileptic seizures (PNES) are medically unexplained seizure-like episodes that are associated with psychological processes. They are a common differential diagnosis of epilepsy and a major health problem around the world.Citation1,Citation2 While the underlying mechanism of PNES would be different from that of epilepsy, improved neurobiological knowledge of PNES will be helpful for both treatment and patients’ understanding of their own illness.Citation3,Citation4
Although neuroimaging studies are expected to provide relevant information and insights about the mechanisms, there are still a limited number of papers.Citation4 Additionally, the social and medical environments of PNES vary widely around the worldCitation1 and, similarly, the potential causes of PNES, such as abuse or family conflict, are also dependent on background cultures.Citation2 Thus, further accumulation of evidence on neurobiological aspects of PNES from various cultures may contribute to better understanding and clinical practice in this field.
We recently reported an abnormal brain aging process in Japanese patients with PNES based on T1-weighted morphological neuroimaging.Citation5 On the other hand, diffusion tensor imaging (DTI) has conventionally been used to evaluate white matter tracts through microstructural parameters such as fractional anisotropy (FA) and mean diffusivity (MD),Citation6 which might provide additional information on the brain in PNES. Recent technical advances have also enabled us to evaluate structural connectivity and brain networks.Citation7 Given that network analysis has provided further insights into brain abnormalities in many neurological and psychiatric disorders,Citation7 PNES may also benefit from this approach by revealing potential brain mechanisms and/or predispositions to psychogenic seizures.
Accordingly, this study used DTI and graph theoretical connectivity analysis to explore details of white matter microstructure and alterations in brain structural networks in patients with PNES.
Materials and Methods
Participants
We retrospectively enrolled consecutive patients with PNES at our institute between January 2012 and December 2017, based on the following inclusion criteria: (1) presence of PNES confirmed on video-EEG monitoring, (2) no epileptiform discharges or epileptic seizures on video-EEG monitoring, and (3) no visual abnormality on MRI. Patients with the following criteria were excluded: (1) a significant past medical history of acute encephalitis, meningitis, severe head trauma, or ischemic encephalopathy; (2) low intelligence quotient (i.e. <69) in Wechsler Adult Intelligence Scale III. Seventeen patients were enrolled, consequently.
For healthy controls, we also recruited 26 age- and sex-matched volunteers with no history of neurological or psychiatric disease and no use of medication affecting the central nervous system. We found no possible structural anomalies or abnormalities in the controls on MRI. The detailed demographics of both groups are shown in .
Table 1 Demographics of Healthy Controls and Patients with PNES
This retrospective study was approved by the institutional review board at National Center of Neurology and Psychiatry Hospital (A2017-060), and the need for patient informed consent was waived.
MRI Acquisition
The MRI scans for all participants were performed on a 3.0-T MR system with a 32-channel coil (Philips Medical Systems, Best, The Netherlands). The parameters of the DTI sequence were as follows: repetition time (TR)/echo time (TE), 6700 ms/58 ms; flip angle, 90°; number of excitations (NEX), 2; slice thickness, 3.0 mm with no gap; slices, 60; matrix, 80 × 78; and field of view (FOV), 24 × 24 cm. Diffusion was measured along 15 non-collinear directions using a diffusion-weighted factor b of 1000 s/mm2, and one image was acquired with no diffusion gradient.
We also performed MRI examinations with the following protocols: (1) for three-dimensional (3D) sagittal T1-weighted images: TR/TE, 7.12 ms/3.4 ms; flip angle, 10°; NEX, 1; slice thickness, 0.6 mm with no gap; slices, 300; matrix, 260 × 320; and FOV, 26 × 24 cm; (2) for transverse turbo spin echo T2-weighted imaging: TR/TE, 4704/80 ms; flip angle, 90º; NEX, 2; thickness, 3.0 mm with a 1.5-mm gap; slices, 34; matrix, 368 × 215; and FOV, 23 × 18 cm; and (3) for coronal fluid-attenuated inversion recovery (FLAIR) imaging: TR/TE, 10,000/120 ms; inversion time, 2450 ms; flip angle, 120°; NEX, 2; thickness, 3.0 mm with a 1.5-mm gap; slices, 34; matrix, 272 × 144; and FOV, 23 × 18 cm.
Tract-Based Spatial Statistics
The DTI data were initially processed with PANDA toolbox v.1.3.1 (https://www.nitrc.org/projects/panda/)Citation8 running with FMRIB Software Library (FSL) version 5.0.11 and MATLAB 2018b. After eddy current correction and brain extraction, the software yielded voxel-wise maps of FA and MD for each participant. To compare FA and MD maps between PNES and healthy controls, we performed tract-based spatial statistics (TBSS).Citation6 Skeletonized FA and MD data were analyzed to evaluate the differences between the two groups with age and sex as covariates using the Threshold-Free Cluster Enhancement option in FSL Randomize with 10,000 permutations.
Network Analysis
Individuals’ structural white matter networks were constructed using the PANDA toolbox with the number of fibers as deterministic, weighted edges derived from DTI data. All the tracts were computed by seeding each voxel with an FA that was > 0.2. Additionally, the 3D-T1 images were used to define the network nodes. Each FA image was co-registered to its corresponding 3D-T1 image by affine transformation. Then, the 3D-T1 image was non-linearly registered to the ICBM152 template in the MNI space. Using inverse transformation, the standard gray matter atlases were warped to each participant’s native space and used for node definition. The detailed pipelines for network constructions are described in the original PANDA toolbox publication.Citation8
To enhance validity and reproducibility, we adopted two different parcellation schemes for graph theoretical analysis: the Automated Anatomical Labeling (AAL) atlas with 90 regions of interest (ROIs)Citation9 and the Harvard-Oxford atlas (HOA) with 110 ROIs.Citation10,Citation11 The names and locations of the ROIs are available in Supplementary Tables 1 and 2.
We performed graph theoretical analysis using the GRETNA toolbox (https://www.nitrc.org/projects/gretna/).Citation12 In this study, we calculated global network properties, including the small-worldness property (clustering coefficient and characteristic path length) and global network efficiency (global efficiency and local efficiency), as well as nodal properties (nodal betweenness centrality). Nodal betweenness centrality is calculated as the number of shortest paths between any two nodes that pass through the node and represents the importance of the node.Citation13 The detailed definitions and meanings of each network property are described elsewhere.Citation13 In addition, a network-based statistic (NBS) method was used to identify edges with significantly different connectivity strengths between the two groups.
Statistics
For TBSS, p<0.05 with family-wise error (FWE) correction by FSL software was deemed significant. For comparison of networks, statistical analyses were performed with the GRETNA toolbox. Between the two groups, global network properties were compared by two-sample t-test, whereas the nodal betweenness centrality of each node was compared by two-sample t-test with Bonferroni correction. Additionally, NBS correction for multiple comparisons was used to compare connectivity strength. In all statistics for networks, two-sided p<0.05 was considered significant.
Results
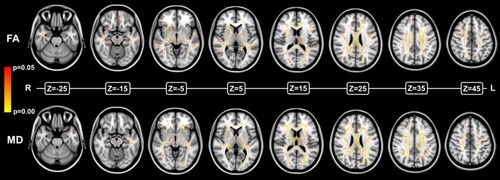
The results of the TBSS comparison are shown in . We found widely decreased FA and increased MD in patients with PNES. In particular, impairment was found mainly in the deep white matter.
Figure 1 Compared with healthy controls, patients with PNES showed widely decreased FA (upper) and increased MD (lower) on TBSS comparison.
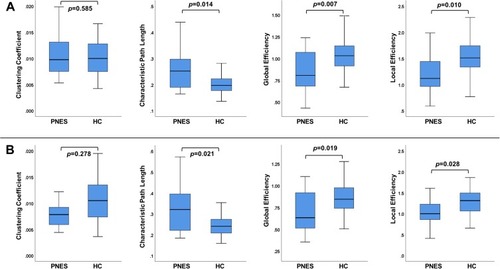
As for the global network properties ( and ), there was a significantly increased characteristic path length and decreased global and local brain network efficiency in PNES with both parcellation schemes, namely, AAL and HOA.
Table 2 Comparison of Global Metrics Between Healthy Controls and Patients with PNES
Figure 2 Results of comparisons of global network properties with the AAL atlas (A) and the HOA atlas (B).
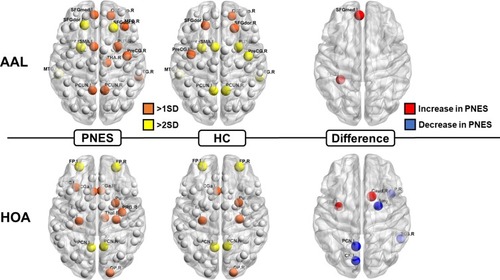
shows the regional nodal betweenness centrality of each group as well as the statistical differences between the two groups. The results suggested that nodal properties may be subject to atlas differences.
Figure 3 Locations of nodal betweenness centrality in the two groups (left and center) and significantly different nodes (right). The size of the node denotes the betweenness centrality in each group (left and center) and the t-values of the differences (right). The node abbreviations correspond to those of Supplementary Tables 1 and 2.
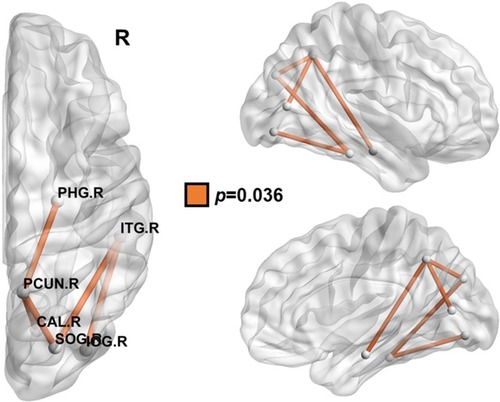
Finally, we found a significantly reduced connectivity network in the right posterior brain with the NBS analysis and AAL parcellation scheme (), whereas there was no significance with HOA.
Figure 4 Compared with healthy controls, patients with PNES showed a reduced connectivity network in the right posterior areas, detected by NBS and the AAL atlas parcellation scheme. The node abbreviations correspond to those of Supplementary Table 1.
Discussion
In this study, we used DTI and graph theory to investigate white matter microstructures and brain networks in Japanese patients with PNES. We found widespread FA and MD abnormalities as well as impaired brain networks including increased path length, decreased network efficiency, altered nodal topology, and reduced network connectivity. Considering the need for additional evidence from neuroimaging,Citation4 our findings may contribute to the neurobiological understanding of PNES.
A few studies have investigated PNES using DTI.Citation14–Citation16 Hernando et alCitation15 focused on the uncinate fasciculus and found significant asymmetry of the uncinate fasciculus in patients with PNES. The same group also reported increased FA in the left hemisphere in PNES using whole-brain TBSS.Citation16 Their results seem to be different from ours, which might be attributable to patient selection or the underlying causes of PNES. Most studies on DTI findings in various neurological and psychiatric disordersCitation17–Citation22 showed reduced FA and/or increased MD, which were seen in our results, whereas increased FA are rarely reported.Citation23 The relationship and interpretation between brain dysfunction and DTI parameters are complex, and the discrepancy in FA results in PNES might reflect the heterogeneity and complexity of this disorder. Another possible explanation for this divergence might be treatment differences (e.g., inappropriate long-term use of anti-epileptic drugs), which could vary among countriesCitation1,Citation2 and affect brain structures.
Additionally, Ding et alCitation14 using DTI and functional MRI reported altered functional and structural networks in PNES. They found not only increased path length, which is consistent with our results, but also an increased clustering coefficient. On the other hand, we have performed validation analysis using two different parcellation schemes, as well as NBS analysis, which may provide further evidence of impaired network properties in PNES. Using the NBS analysis, we found reduced connectivity in right posterior areas, involving the right precuneus and parahippocampal cortex, in PNES, although this difference was found in the AAL parcellation only. This finding may suggest some specific impairment of this region in patients with PNES, such as default mode network (DMN) dysfunction and alertness.Citation24
In fact, DMN abnormalities have been commonly reported in depression,Citation25 anxietyCitation26 and post-traumatic stress disorder (PTSD).Citation27 Given the close associations with PNES,Citation2 we should bear in mind the effect of these psychiatric disorders as the confounding factors. As for the white matter structures, major depression showed increased path length,Citation25 which was also seen in the present study, whereas decreased path length is reported in PTSD.Citation28 The relationship between psychiatric disorders and brain connectome findings is complicated, and thus further investigations with detailed psychiatric symptoms will be needed to clarify the neurobiological complexities of PNES.
Compared with DTI studies, there have been a greater number of morphological statistical neuroimaging studies of PNES.Citation29–Citation33 In general, PNES shows frontal and temporal lobar abnormalities in gray matter volume or cortical thickness, although there are some inconsistencies. These areas are also related to normal aging during young adulthood to middle age,Citation34 which may explain the faster brain aging in patients with PNES.Citation5 Interestingly, FA in the corpus callosum is the area most associated with the aging process.Citation35 Because we found a severe FA reduction mainly in the deep white matter, including the corpus callosum (), these FA changes may indicate a strong link between PNES and abnormal brain aging.
The main limitations of this study are the small sample size and the lack of detailed neuropsychological and/or psychiatric information, which may make this study preliminary in nature. Details of demographics, such as handedness, family history of neurological diseases, and history of febrile seizures, were also unavailable. In particular, as stated previously, the lack of information on the comorbid psychiatric symptoms should be noted, because they are important confounding factors to interpret the present results. On the other hand, the number of neurobiological studies on PNES is still low, and this is the first neuroimaging study to investigate Japanese patients with PNES. In fact, we found several statistically significant findings in this preliminary cohort, which would help to guide further research into PNES around the world. In addition, to fully reveal the effects of PNES, another group of controls (e.g., psychiatric patients without PNES) might have been valuable, as suggested in a previous paper.Citation4 Thus, more comprehensive and multicohort studies with larger sample sizes are desirable. Additionally, more high-precision imaging protocols should be needed, considering the relatively low number of DTI directions in this study (i.e. 15). Finally, the effects of drugs (e.g., psychoactive drugs or past use of anti-epileptic drugs) also need to be considered when the data from this study are being interpreted.
Conclusions
We found widespread decreases in FA and increases in MD, as well as impaired brain structural networks including increased path length, decreased network efficiency, and regional reduced connectivity in the right posterior region in Japanese patients with PNES. These findings contribute to the accumulation of evidence on PNES and may improve the understanding of this condition.
Ethics Approval and Informed Consent
In compliance with the Helsinki Declaration, this retrospective study using anonymized data was approved by the institutional review board at National Center of Neurology and Psychiatry Hospital (A2017-060), and the need for patient informed consent was waived.
Disclosure
The authors report no conflicts of interest in this work.
Additional information
Funding
References
- Kanemoto K, LaFrance WC Jr., Duncan R, et al. PNES around the world: where we are now and how we can close the diagnosis and treatment gaps-an ILAE PNES Task Force report. Epilepsia Open. 2017;2(3):307–316. doi:10.1002/epi4.1206029588959
- Hingray C, El-Hage W, Duncan R, et al. Access to diagnostic and therapeutic facilities for psychogenic nonepileptic seizures: an international survey by the ILAE PNES Task Force. Epilepsia. 2018;59(1):203–214. doi:10.1111/epi.1395229152734
- Asadi-Pooya AA. Neurobiological origin of psychogenic nonepileptic seizures: a review of imaging studies. Epilepsy Behav. 2015;52(Pt A):256–259. doi:10.1016/j.yebeh.2015.09.02026489485
- McSweeney M, Reuber M, Levita L. Neuroimaging studies in patients with psychogenic non-epileptic seizures: a systematic meta-review. Neuroimage Clin. 2017;16:210–221. doi:10.1016/j.nicl.2017.07.02528808618
- Sone D, Beheshti I, Maikusa N, et al. Neuroimaging-based brain-age prediction in diverse forms of epilepsy: a signature of psychosis and beyond. Mol Psychiatry. 2019. doi:10.1038/s41380-019-0446-9.
- Smith SM, Jenkinson M, Johansen-Berg H, et al. Tract-based spatial statistics: voxelwise analysis of multi-subject diffusion data. Neuroimage. 2006;31(4):1487–1505. doi:10.1016/j.neuroimage.2006.02.02416624579
- Fornito A, Zalesky A, Breakspear M. The connectomics of brain disorders. Nat Rev Neurosci. 2015;16(3):159–172. doi:10.1038/nrn390125697159
- Cui Z, Zhong S, Xu P, He Y, Gong G. PANDA: a pipeline toolbox for analyzing brain diffusion images. Front Hum Neurosci. 2013;7(42). doi:10.3389/fnhum.2013.00042
- Tzourio-Mazoyer N, Landeau B, Papathanassiou D, et al. Automated anatomical labeling of activations in SPM using a macroscopic anatomical parcellation of the MNI MRI single-subject brain. Neuroimage. 2002;15(1):273–289. doi:10.1006/nimg.2001.097811771995
- Kennedy DN, Lange N, Makris N, Bates J, Meyer J, Caviness VS Jr. Gyri of the human neocortex: an MRI-based analysis of volume and variance. Cereb Cortex. 1998;8(4):372–384. doi:10.1093/cercor/8.4.3729651132
- Makris N, Meyer JW, Bates JF, Yeterian EH, Kennedy DN, Caviness VS. MRI-Based topographic parcellation of human cerebral white matter and nuclei II. Rationale and applications with systematics of cerebral connectivity. Neuroimage. 1999;9(1):18–45. doi:10.1006/nimg.1998.03849918726
- Wang J, Wang X, Xia M, Liao X, Evans A, He Y. GRETNA: a graph theoretical network analysis toolbox for imaging connectomics. Front Hum Neurosci. 2015;9:386.26175682
- Guye M, Bettus G, Bartolomei F, Cozzone PJ. Graph theoretical analysis of structural and functional connectivity MRI in normal and pathological brain networks. MAGMA. 2010;23(5–6):409–421. doi:10.1007/s10334-010-0205-z20349109
- Ding JR, An D, Liao W, et al. Altered functional and structural connectivity networks in psychogenic non-epileptic seizures. PLoS ONE. 2013;8(5):e63850. doi:10.1371/journal.pone.006385023717498
- Hernando KA, Szaflarski JP, Ver Hoef LW, Lee S, Allendorfer JB. Uncinate fasciculus connectivity in patients with psychogenic nonepileptic seizures: a preliminary diffusion tensor tractography study. Epilepsy Behav. 2015;45:68–73. doi:10.1016/j.yebeh.2015.02.02225868002
- Lee S, Allendorfer JB, Gaston TE, et al. White matter diffusion abnormalities in patients with psychogenic non-epileptic seizures. Brain Res. 2015;1620:169–176. doi:10.1016/j.brainres.2015.04.05025979311
- Tamnes CK, Agartz I. White matter microstructure in early-onset schizophrenia: a systematic review of diffusion tensor imaging studies. J Am Acad Child Adolesc Psychiatry. 2016;55(4):269–279. doi:10.1016/j.jaac.2016.01.00427015717
- Slinger G, Sinke MR, Braun KP, Otte WM. White matter abnormalities at a regional and voxel level in focal and generalized epilepsy: a systematic review and meta-analysis. Neuroimage Clin. 2016;12:902–909. doi:10.1016/j.nicl.2016.10.02527882296
- Chen L, Hu X, Ouyang L, et al. A systematic review and meta-analysis of tract-based spatial statistics studies regarding attention-deficit/hyperactivity disorder. Neurosci Biobehav Rev. 2016;68:838–847. doi:10.1016/j.neubiorev.2016.07.02227450582
- Atkinson-Clement C, Pinto S, Eusebio A, Coulon O. Diffusion tensor imaging in Parkinson’s disease: review and meta-analysis. Neuroimage Clin. 2017;16:98–110. doi:10.1016/j.nicl.2017.07.01128765809
- Acosta-Cabronero J, Nestor PJ. Diffusion tensor imaging in Alzheimer’s disease: insights into the limbic-diencephalic network and methodological considerations. Front Aging Neurosci. 2014;6:266. doi:10.3389/fnagi.2014.0026625324775
- Waller R, Dotterer HL, Murray L, Maxwell AM, Hyde LW. White-matter tract abnormalities and antisocial behavior: a systematic review of diffusion tensor imaging studies across development. Neuroimage Clin. 2017;14(201–15):201–215. doi:10.1016/j.nicl.2017.01.01428180079
- Alexander AL, Lee JE, Lazar M, Field AS. Diffusion tensor imaging of the brain. Neurotherapeutics. 2007;4(3):316–329. doi:10.1016/j.nurt.2007.05.01117599699
- Broyd SJ, Demanuele C, Debener S, Helps SK, James CJ, Sonuga-Barke EJ. Default-mode brain dysfunction in mental disorders: a systematic review. Neurosci Biobehav Rev. 2009;33(3):279–296. doi:10.1016/j.neubiorev.2008.09.00218824195
- Gong Q, He Y. Depression, neuroimaging and connectomics: a selective overview. Biol Psychiatry. 2015;77(3):223–235. doi:10.1016/j.biopsych.2014.08.00925444171
- Kim YK, Yoon HK. Common and distinct brain networks underlying panic and social anxiety disorders. Prog Neuropsychopharmacol Biol Psychiatry. 2018;80(Pt B):115–122. doi:10.1016/j.pnpbp.2017.06.01728642079
- Akiki TJ, Averill CL, Abdallah CG. A network-based neurobiological model of PTSD: evidence from structural and functional neuroimaging studies. Curr Psychiatry Rep. 2017;19(11):81. doi:10.1007/s11920-017-0840-428924828
- Long Z, Duan X, Xie B, et al. Altered brain structural connectivity in post-traumatic stress disorder: a diffusion tensor imaging tractography study. J Affect Disord. 2013;150(3):798–806. doi:10.1016/j.jad.2013.03.00423684515
- Labate A, Cerasa A, Mula M, et al. Neuroanatomic correlates of psychogenic nonepileptic seizures: a cortical thickness and VBM study. Epilepsia. 2012;53(2):377–385. doi:10.1111/epi.2012.53.issue-222150750
- Ristic AJ, Dakovic M, Kerr M, Kovacevic M, Parojcic A, Sokic D. Cortical thickness, surface area and folding in patients with psychogenic nonepileptic seizures. Epilepsy Res. 2015;112(84–91):84–91. doi:10.1016/j.eplepsyres.2015.02.01525847343
- McSweeney M, Reuber M, Hoggard N, Levita L. Cortical thickness and gyrification patterns in patients with psychogenic non-epileptic seizures. Neurosci Lett. 2018;678:124–130. doi:10.1016/j.neulet.2018.04.05629763635
- Perez DL, Matin N, Williams B, et al. Cortical thickness alterations linked to somatoform and psychological dissociation in functional neurological disorders. Hum Brain Mapp. 2018;39(1):428–439. doi:10.1002/hbm.2385329080235
- Vasta R, Cerasa A, Sarica A, et al. The application of artificial intelligence to understand the pathophysiological basis of psychogenic nonepileptic seizures. Epilepsy Behav. 2018;87:167–172. doi:10.1016/j.yebeh.2018.09.00830269939
- Bourisly AK, El-Beltagi A, Cherian J, Gejo G, Al-Jazzaf A, Ismail M. A voxel-based morphometric magnetic resonance imaging study of the brain detects age-related gray matter volume changes in healthy subjects of 21–45 years old. Neuroradiol J. 2015;28(5):450–459. doi:10.1177/197140091559807826306927
- Kochunov P, Williamson DE, Lancaster J, et al. Fractional anisotropy of water diffusion in cerebral white matter across the lifespan. Neurobiol Aging. 2012;33(1):9–20. doi:10.1016/j.neurobiolaging.2010.01.01420122755