
Abstract
Misdiagnosis of bipolar disorder is a serious, but not unusual problem for patients. Nevertheless, there are few biomarkers for distinguishing unipolar and bipolar disorder. Near-infrared spectroscopy (NIRS) is a noninvasive and useful method for the measurement of hemoglobin concentration changes in the cortical surface area, which enables the assessment of brain function. We measured NIRS and plasma monoamine metabolite levels in a patient with bipolar disorder. A 22-year-old man was admitted due to major depression. At admission, NIRS findings showed oxygenated hemoglobin reincrease in the posttask period, which is characteristic of schizophrenia. After treatment with paroxetine, he became manic with psychotic symptoms. His plasma level of homovanillic acid just before the manic switch was ten times higher than that just after paroxetine initiation. Treatment with lithium and antipsychotics was successful, and plasma homovanillic acid decreased after treatment. In this case, the NIRS findings may predict a possible risk of a manic switch, which is likely induced by paroxetine. NIRS may be able to help distinguish unipolar and bipolar disorder in clinical settings.
Introduction
Misdiagnosis of bipolar disorder is a potentially serious problem for patients, which sometimes leads to inappropriate treatment.Citation1 However, it is not unusual for bipolar disorder to be misdiagnosed as a major depressive disorder.Citation2 Previous studies have shown that the proportion of cases of bipolar disorder misdiagnosed as a major depressive disorder is 20.8%–40%.Citation2–Citation4 Nevertheless, there are few biomarkers for accurate diagnosis. If patients become depressive for the first time and have never experienced a manic episode, it is difficult to determine whether that depressive episode is unipolar or bipolar depression, and the risk of a manic switch is unknown. Near-infrared spectroscopy (NIRS) is a noninvasive and useful method that uses near-infrared light to measure hemoglobin concentration changes in the cortical surface area. Although changes in the NIRS signals measured on the forehead during the word fluency task may be partially associated with changes in skin blood flow,Citation5 the changes in oxygenated hemoglobin ([oxyHb]) are associated with changes in the regional cerebral blood volume. NIRS enables the assessment of brain function, and recent studies have shown that the frontal hemodynamic patterns detected by NIRS can be a biomarker for the diagnosis of major psychiatric disorders.Citation6,Citation7
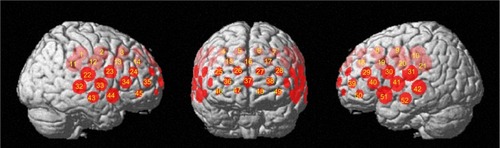
In the present case, NIRS during the word fluency task was measured during the clinical course of bipolar disorder. In brief, [oxyHb] and deoxygenated hemoglobin ([deoxyHb]) were measured with a 52-channel NIRS machine (Hitachi ETG-4000; Hitachi Medical Corporation, Tokyo, Japan) at two wavelengths of near-infrared light (695 and 830 nm), the absorption of which was measured, and [oxyHb] and [deoxyHb] were calculated as previously described.Citation8 The distance between pairs of source-detector probes was set at 3.0 cm and each measured area between pairs of source detector probes was defined as a “channel”. The probes of the NIRS machine were fixed with 3 × 11 thermoplastic shells, with the lowest probes located along the Fp1-Fp2 line according to the international 10–20 system used in electroencephalography. We used the word fluency task because it is easy to understand and execute, and it is also an executive task that produces distinct differences in performance and neuroimaging data among each diagnostic group of psychiatric disorders.Citation7 Additionally, plasma levels of homovanillic acid (HVA), a dopamine metabolite, and 3-methoxy-4hydroxyphenylglycol (MHPG), a noradrenaline metabolite, were measured longitudinally using high performance liquid chromatography. In our hospital, we measured both plasma levels of monoamine metabolites (every 3 weeks in principle) and NIRS (before and after the treatment) in psychiatric inpatients with mood disorders to investigate the association between plasma monoamine metabolites and NIRS signals. This protocol was approved by the ethics committee of Fukushima Medical University, and the patient consented to participate after having been informed of the purpose of the study.
Case report
The patient was a 22-year-old man who had no history of psychiatric illness. He was admitted to our hospital due to major depression that was diagnosed according to the Diagnostic and Statistical Manual for Mental Disorders, Fourth Edition, with moderate sadness, agitation, retardation, and difficulty in concentrating. The clinical course after admission is summarized in . We treated the patient with paroxetine and lorazepam for about 4 weeks, but treatment was not successful. On day 4, his Montgomery Åsberg Depression Rating Scale (MADRS) score was 44, and his plasma levels of HVA and MHPG were 4.6 ng/mL and 1.9 ng/mL, respectively. shows the waveform of [oxyHb] during the cognitive activation of the word fluency task. NIRS signal changes were measured during a 10 second pretask baseline period, a 60 second task period, and a 55 second posttask baseline period. The initial syllables assigned were changed every 20 seconds (/a/, /ka/, and /sa/, respectively) during the 60 second task period. During the task period, the patient was instructed to generate as many Japanese words beginning with the designated syllable as possible. In the pretask and the posttask baseline periods, the patient was instructed to repeat a train of syllables (/a/, /i/, /u/, /e/, and /o/). He sat on a chair in a room with daylight with his eyes open throughout the measurements. We focused on increases in [oxyHb], because this appears to reflect task-related cortical activation more directly than decreases in [deoxyHb].Citation7 We defined the patterns of NIRS waveforms using the grand average waveforms in the frontal region (CH 25–28, CH 36–38, and CH 46–49; ) and two simple visual indices,Citation7 integral value, and centroid value. The integral value describes the size of the hemodynamic response during the 60 second activation task period, whereas the centroid value serves as an index of time course changes throughout the task, with periods representing the timing of the hemodynamic response.Citation7 A recent study reported that the optimal threshold of the centroid value of the frontal region between major depressive disorder and two other disorders (schizophrenia and bipolar disorder) is 54 seconds (major depressive disorder < other 2 disorders).Citation7 On day 4, the centroid value of the grand average in the central region was 68.6 seconds (), and the NIRS waveforms showed an [oxyHb] reincrease in the posttask period (CH 34, 35, 36, 39, 45, 46, 47, and 49; ), which is characteristic of schizophrenia.Citation6,Citation7,Citation9–Citation11 On day 25, his MADRS score was 40, his plasma HVA level was markedly higher at 49.3 ng/mL, and his plasma MHPG level was 1.6 ng/mL. On day 27, he was voluntarily discharged from the hospital, but was still in a depressive state. On day 30, 3 days after leaving the hospital, he became manic and was readmitted to our hospital. He was in a state of psychotic mania with elevated mood, grandiosity, aggression, auditory hallucination, and thought broadcast, with a Young Mania Rating Scale (YMRS) score of 48. Paroxetine and lorazepam were discontinued. We subsequently treated him with lithium, risperidone, and zotepine for approximately 3 weeks, and his manic state improved. On day 46, his YMRS score was 29, and plasma levels of HVA and MHPG were 17 ng/mL and 1.3 ng/mL, respectively. However, he refused drugs because of extrapyramidal symptoms and became manic with psychotic symptoms again. Therefore, we tried a combination of lithium, olanzapine, and zotepine, and the treatment was successful. On day 77, the NIRS waveforms turned to a negative pattern (), which was defined by an integral value of the grand average in the central region <0, whereas there were [oxyHb] reincreases in the posttask period (CH 33, 41, 42, 43, 44, 51, and 52). On day 99, his YMRS score decreased to 3, and his plasma levels of HVA and MHPG were 8.7 ng/mL and 1.9 ng/mL, respectively. He was discharged from the hospital on day 106. Nine months later, he was off medication, became manic again, and was admitted to another psychiatric hospital.
Figure 1 Clinical course after admission.
Abbreviations: BPD, biperiden; FNP, flunitrazepam; HVA, homovanillic acid; Li, lithium carbonate; LZP, lorazepam; MADRS, Montgomery Åsberg Depression Rating Scale; MHPG, 3-methoxy-4hydroxyphenylglycol; NIRS, near-infrared spectroscopy; OLZ, olanzapine; PAX, paroxetine; RIS, risperidone; YMRS, Young Mania Rating Scale; ZPC, zopiclone; ZTP, zotepine.
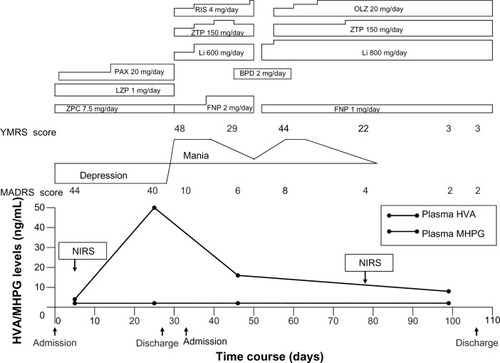
Figure 2 Waveforms of oxygenated hemoglobin.
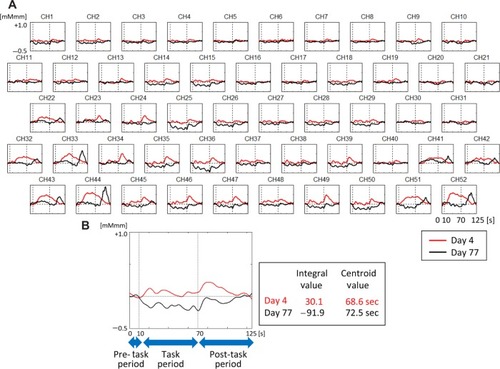
Figure 3 Regions of the near-infrared spectroscopy signals.
Discussion
To the best of our knowledge, this is the first case report to measure both NIRS and plasma levels of monoamine metabolites in a patient with bipolar disorder, although the clinical course in this patient was not usual as the mania occurred within the first weeks of the initiation of serotonin selective reuptake inhibitor (SSRI) treatment. In this case, it was difficult to diagnose bipolar depression from only clinical symptoms at his first admission. We could not predict the subsequent manic switch with psychotic features, which was likely caused by paroxetine. However, the results of NIRS on day 4 showed a pattern of schizophrenia, characterized by a smaller [oxyHb] increase during the first half of the task and an [oxyHb] reincrease in the posttask period,Citation4,Citation9–Citation11 but not a unipolar depression pattern, which is characterized by only a smaller [oxyHb] increase during the first half of the period.Citation4,Citation9,Citation12,Citation13 Care must be taken to interpret these findings as patterns of diseases because of the small number of studies. An [oxyHb] reincrease in the posttask period is considered as inefficient activation of the prefrontal cortex,Citation4,Citation9,Citation11 which is one of the quantitative abnormalities in schizophrenia.Citation14 These results may have predicted a possible risk of a manic switch in this patient. A recent studyCitation7 reported that the frontal hemodynamic patterns detected by NIRS accurately distinguished between patients with major depressive disorder and those with bipolar disorder or schizophrenia with depressive symptoms. This is consistent with the results in this patient. Although the clinical status of bipolar depression may be different from that of unipolar depression,Citation1 it is not easy to clearly distinguish without a previous manic episode. In fact, most bipolar disorder patients with depressive symptoms are initially diagnosed as having major depression.Citation2 Because there are few biomarkers for diagnosis, NIRS findings may help for distinguishing unipolar and bipolar disorders. However, NIRS signals changed after treatment with antipsychotics and lithium in this patient. Although it is believed that NIRS waveforms are a possible trait marker, NIRS signals may change with the state or the medication.
Interestingly, NIRS findings in this case showed a pattern of schizophrenia, not a pattern of bipolar disorder, which is characterized by a smaller [oxyHb] increase during the early period, and larger [oxyHb] increase during the late period of this task.Citation15 This result is consistent with a manic episode in this case that included psychotic symptoms such as hallucination and thought broadcast. Furthermore, 5 days before the manic switch, the patient’s plasma HVA level was almost ten times higher than just after admission. Because the HVA level change occurred in tandem with the manic symptoms during the clinical course, it is estimated that the manic episode in this case was associated with dopaminergic function. Plasma HVA levels have been considered as a possible indicator in the treatment of schizophreniaCitation16,Citation17 and bipolar disorder.Citation18,Citation19 Furthermore, because SSRIs act on dopaminergic and serotonergic neural systems,Citation20 the increase in the plasma HVA level in this patient may have been induced by paroxetine. A previous study reported that psychosis or mania induced by SSRIs showed a pattern of increased plasma HVA levels.Citation21 This is consistent with our findings of the changes in plasma HVA levels in this patient. Taken together, the NIRS findings in this patient may be based on dopaminergic dysfunction. However, the changes in the NIRS may not be directly associated with the changes in plasma HVA levels, because NIRS findings are based on frontal brain functions, whereas plasma HVA levels are related to psychotic symptoms,Citation22 which seem to be a reflection of the mesolimbic dopamine system.
Conclusion
In this case, NIRS findings in a depressive state may predict the possible risk for a manic switch. NIRS may be able to help distinguish unipolar and bipolar disorders in clinical settings. Longitudinal monitoring of plasma HVA levels may be useful in the treatment of bipolar disorder, in particular in patients with psychotic symptoms like this case. These possible biomarkers may contribute to accurate diagnosis and appropriate treatment for bipolar disorder.
Disclosure
The authors report no conflicts of interest in this work.
References
- GhaemiSNKoJYGoodwinFK“Cade’s disease” and beyond: misdiagnosis, antidepressant use, and a proposed definition for bipolar spectrum disorderCan J Psychiatry20024712513411926074
- GhaemiSNBoimanEEGoodwinFKDiagnosing bipolar disorder and the effect of antidepressants: a naturalistic studyJ Clin Psychiatry20006180480811078046
- XiangYTZhangLWangGSociodemographic and clinical features of bipolar disorder patients misdiagnosed with major depressive disorder in ChinaBipolar Disord20131519920523437963
- GhaemiSNSachsGSChiouAMPandurangiAKGoodwinKIs bipolar disorder still underdiagnosed? Are antidepressants overutilized?J Affect Disord19995213514410357026
- TakahashiTTakikawaYKawagoeRShibuyaSIwanoTKitazawaSInfluence of skin blood flow on near-infrared spectroscopy signals measured on the forehead during a verbal fluency taskNeuroimage201157991100221600294
- SutoTFukudaMItoMUeharaTMikuniMMultichannel near-infrared spectroscopy in depression and schizophrenia: cognitive brain activation studyBiol Psychiatry20045550151115023578
- TakizawaRFukudaMKawasakiSJoint Project for Psychiatric Application of Near-Infrared Spectroscopy (JPSY-NIRS) GroupNeuroimaging-aided differential diagnosis of the depressive stateNeuroimage20148549850723764293
- MakiAYamashitaYItoYWatanabeEMayanagiYKoizumiHSpatial and temporal analysis of human motor activity using noninvasive NIR topographyMed Phys199522199720058746704
- KinouMTakizawaRMarumoKDifferential spatiotemporal characteristics of the prefrontal hemodynamic response and their association with functional impairment in schizophrenia and major depressionSchizophr Res201315045946724016725
- ShimoderaSImaiYKamimuraNMapping hypofrontality during letter fluency task in schizophrenia: a multi-channel near-infrared spectroscopy studySchizophr Res2012136636922330179
- TakizawaRKasaiKKawakuboYReduced frontopolar activation during verbal fluency task in schizophrenia: a multi-channel near-infrared spectroscopy studySchizophr Res20089925026218063344
- PuSNakagomeKYamadaTThe relationship between the prefrontal activation during a verbal fluency task and stress-coping style in major depressive disorder: a near-infrared spectroscopy studyJ Psychiatr Res2011461427143422935269
- NodaTYoshidaSMatsudaTFrontal and right temporal activations correlate negatively with depression severity during verbal fluency task: a multi-channel near-infrared spectroscopy studyJ Psychiatr Res20124690591222572569
- Meyer-LindenbergAFrom maps to mechanisms through neuroimaging of schizophreniaNature201046819420221068827
- KameyamaMFukudaMYamagishiYFrontal lobe function in bipolar disorder: A multichannel near-infrared spectroscopy studyNeuroimage20062917218416125979
- KelleyMEYaoJKvan KammenDPPlasma catecholamine metabolites as markers for psychosis and antipsychotic response in schizophreniaNeuropsychopharmacology19992060361110327429
- MiuraITakeuchiSKatsumiAEffects of aripiprazole and the Taq1A polymorphism in the dopamine D2 receptor gene on the clinical response and plasma monoamine metabolites level during the acute phase of schizophreniaJ Clin Psychopharmacol20123210610922198450
- PostRMJimersonDCBunneyWEJrGoodwinFKDopamine and mania: behavioral and biochemical effects of the dopamine receptor blocker pimozidePsychopharmacology (Berl)1980672973056155678
- MazureCMBowersMBPretreatmnent plasma HVA predicts neuroleptic response in manic psychosisJ Affect Disord19984883869495606
- WillnerPHaleASArgyropoulosSDopaminergic mechanism of antidepressant action in depressed patientsJ Affect Disord200586374515820269
- FortunatiFMazureCPredaAWahlRBowersMJrPlasma catecholamine metabolites in antidepressant-exacerbated mania and psychosisJ Affect Disord20026833133412063160
- YoshimuraRNakanoYHoriHIkenouchiAUedaNNakamuraJEffect of risperidone on plasma catecholamine metabolites and brain-derived neurotrophic factor in patients with bipolar disordersHum Psychopharmacol Clin Exp200621433438