
Abstract
Background
Thinning in the temporoparietal cortex, hippocampal atrophy, and a lower regional blood perfusion is connected with prodromal stage of Alzheimer’s disease (AD). Of note, an increase of electroencephalography (EEG) upper/low alpha frequency power ratio has also been associated with these major landmarks of prodromal AD.
Methods
Clinical and neuropsychological assessment, EEG recording, and high-resolution three-dimensional magnetic resonance imaging were done in 74 grown up subjects with mild cognitive impairment. This information was gathered and has been assessed 3 years postliminary. EEG recording and perfusion single-photon emission computed tomography assessment was done in 27 subjects. Alpha3/alpha2 frequency power ratio, including cortical thickness, was figured for every subject. Contrasts in cortical thickness among the groups were assessed. Pearson’s r relationship coefficient was utilized to evaluate the quality of the relationship between cortical thinning, brain perfusion, and EEG markers.
Results
The higher alpha3/alpha2 frequency power ratio group corresponded with more prominent cortical decay and a lower perfusional rate in the temporoparietal cortex. In a subsequent meetup after 3 years, these patients had AD.
Conclusion
High EEG upper/low alpha power ratio was connected with cortical diminishing and lower perfusion in the temporoparietal brain area. The increase in EEG upper/low alpha frequency power ratio could be helpful in recognizing people in danger of conversion to AD dementia and this may be quality information in connection with clinical assessment.
Introduction
According to current investigation criteria, it is becoming clear that the mix of different biomarkers is an improvement for a privileged and early detection of Alzheimer’s disease (AD).Citation1,Citation2 To date, the most discussed are endorsed biomarkers, Abeta42 and tau protein, in the cerebrospinal fluid, glucose hypometabolism measured by fluorodeoxyglucose positron release tomography (18F-FDG PET), decay of hippocampal volume (HV) on magnetic resonance imaging (MRI), and weight of amyloid burden measured by amyloid imaging with PET.Citation3–Citation16 Regardless, a couple of points remain. The late biomarkers are important in detecting subjects with neurodegenerative problem who are at high risk of it changing into dementia; in any case, they do not have a tried and true specificity that permits an obvious completion of the different subtypes of dementia. Of note, in neurodegenerative diseases such as AD or other dementias, the brain structure modifies many years before clinical appearances. Late MRI studies have demonstrated that a sweeping neural framework is adjusted in subjects with prodromal AD.Citation17–Citation22 In particular, subjects with scholarly rot exhibit early rot and loss of dim matter in cortical-specific zones,Citation18,Citation20 in particular, the parietal and precuneus areas as well as medial temporal and hippocampal cortices. In the sensible edge of the joining of biomarkers for an early and significantly farsighted discovery, the electroencephalography (EEG) could be a strong tool.Citation23 Certainly, it is comprehensively recognized that the cerebral EEG rhythms reflect the essential brain framework activity.Citation24 As a result, the changes in EEG rhythms could be an early sign of AD.Citation25–Citation28 Past studies have convincingly displayed that there are thalamo-cortical and cortico-cortical fragments that contribute to the generation of cortical alpha rhythms. Of late, it has been discovered the increase of high alpha/low alpha ratio is a strong EEG marker of hippocampal rot.Citation29,Citation30 In addition, the augmentation in the alpha3/alpha2 (a3/a2) power ratio extent has been indicated to be insightful to the progress of patients with mild cognitive impairment (MCI) to AD, however, not to non-AD dementia.Citation31 The same augmentation of a3/a2 power ratio was found to be connected with hippocampal rot in subjects with AD.Citation32–Citation38 On the other hand, subjects with higher a3/a2 power proportion showed a consistent example toward a lower regional blood perfusion than the low a3/a2 group.Citation39
This study inquired about the relationship between MRI and single-photon emission computed tomography (SPECT) with regard to the MCI group of subjects with higher a3/a2 power ratio. Results show that the higher a3/a2 power ratio was associated with both MRI and SPECT prodromal AD designs. Finally, this group of subjects exhibits an adjustment in AD following a 3-year postliminary.
Materials and methods
Subjects
Seventy-four subjects with MCI were recruited from the Memory Clinic of the Scientific Institute for Research and Care (IRCCS) of Alzheimer’s and psychiatric diseases, “Fatebenefratelli”, in Brescia, Italy. All experimental and study protocols were approved by the local ethics committee. Informed consent was obtained from all participants or their caregivers, as per the recommendation of the Code of Ethics of the World Medical Association (Declaration of Helsinki).
Diagnostic criteria
Patients were chosen from a prospective study of cognitive impairment (the Translational Outpatient Memory Clinic study) conducted in the outpatient office of the National Institute for the Research and Care of Alzheimer’s Disease (IRCCS, Istituto Centro San Giovanni di Dio Fatebenefratelli, Brescia, Italy). Patients were appraised with a progression of institutionalized demonstrative and seriousness instruments, including the Mini-Mental State Examination (MMSE),Citation40 the Clinical Dementia Rating Scale,Citation41 the Hachinski Ischemic Scale,Citation30 the instrumental activities of daily living (IADL), the basic activities of daily living (BADL),Citation42–Citation45 and a complete neuropsychological evaluation, institutionalized on Italian population.Citation46,Citation47 Likewise, patients experienced analytic neuroimaging methods (MRI) and research facility testing to preclude different reasons for cognitive deterioration. Inclusion criteria of the study were as follows: 1) grumbling by the patient or report by a relative regarding memory or other intellectual impairments; 2) MMSE score of 24–28/30;Citation46 and 3) saving of IADL and BADL. Prohibition criteria were any of the accompanying: 1) patients aged 90 years older (no base age to take an interest in the study), 2) history or neurological indications of real stroke, 3) any psychiatric disease, 4) epilepsy, 5) utilization of psychoactive medications, including acetylcholinesterase inhibitors or different medications upgrading mind intellectual capacities or biasing EEG activity, 6) chronic systemic diseases such as diabetes, or 7) commotive traumatic brain injuries.Citation1,Citation44,Citation45 All subjects were right-handed. Demographic and psychological components of the subjects in this study are given in . There were no factually huge contrasts in age, sexual orientation, or instruction among the patients gathered in this study.
Table 1 Demographic and cognitive characteristics of the whole sample, disaggregated for increased levels of a3/a2 numbers denote mean ± standard deviation, number and (range)
Follow-up analysis
demonstrates the sociodemographical components of three groups of patients, which were acquired by the result of following 3 years of postliminary: 1) patients with MCI who did not change over to any dementia, 2) patients with MCI who changed over in AD, and 3) patients with MCI who changed over to dementia other than AD (fronto-temporal dementia range, vascular dementia, or Lewy body dementia).
Table 2 ANOVA results of demographic variables, ie, age, education, MMSE score, and a3/a2 ratio
EEG recordings
The EEG was recorded from 19 locales by utilizing electrodes set as a part of an elastic cap (Electro-Cap International, Inc. Eaton, OH, USA) and situated by 10–20 global frameworks (Fp1, Fp2, F7, F3, Fz, F4, F8, T3, C3, Cz, C4, T4, T5, P3, Pz, P4, T6, O1, and O2). The patients were told to sit with their eyes shut and relax; they were continually checked by an operator. The ground electrode was set before Fz. The left and right mastoids served as the reference for all terminals. The recordings were utilized to re-reference the scalp recordings to the common average. Re-referencing was done preceding the EEG artifacts identification and examination. Information were recorded with a band-pass filter of 0.3–70 Hz and digitized at an inspecting rate of 250 Hz (BrainAmp, Brain Products, Munich, Germany). Terminal skin impedance was situated underneath 5 kHz. Horizontal and vertical eye movements were recognized by the electrooculogram.Citation48–Citation52 The subjects endured the recording for 5 minutes with their eyes shut. EEG information was then broke down and divided off-line in successive periods of 2 seconds with a frequency resolution of 0.5 Hz. The average number of periods analyzed was 140, ranging from 130 to 150. The epochs with ocular, muscular, and different sorts of artifacts were tossed by two expert electroencephalographists.Citation27 The spectral power we got is an estimation of a collapsed spectrum throughout the scalp electrodes. Along these lines, the contribution of the muscular artifacts is emphatically lessened. In addition, two talented electroencephalographists checked the EEG traces independently.
Analysis of individual frequency bands
A digitalized fast Fourier transform power spectrum analysis (Welch technique, Hanning windowing function, no phase shift) processed the power density of EEG rhythms (ranging from 2 to 45 Hz) with a 0.5 Hz frequency resolution. Two principal frequencies (the theta/alpha transition frequency [TF] and the individual alpha frequency [IAF] peak) were chosen consistently with scientific guidelines.Citation28,Citation29 IAF and TF were recorded for every subject in this study. These anchor frequencies were computed on the whole scalp averaged power spectra. This “collapsed strategy”, being a kind of standardized global field power, takes into consideration the recognizable proof of a reliable and stationary IAF. A large body of literature has convincingly demonstrated that the IAF is extremely robust in resting condition EEG recording,Citation52–Citation61 even if more alert has been recommended when the study subjects need to perform some particular active tasks.Citation62 The TF marks the frequency of transition between the theta and alpha rhythms and is considered the frequency at which the theta and alpha spectra cross. TF was processed as the base power in the alpha recurrence range; following our EEG recordings were performed at rest. The IAF represents the frequency with the most extreme power top inside of the amplified alpha range (5–14 Hz). In light of TF and IAF, we assessed the frequency band range for every subject as takes after: delta from TF-4 to TF-2, theta from TF-2 to TF, low alpha band (alpha1 [a1] and a2) from TF to IAF, and high alpha band (or a3) from IAF to IAF +2. The a1 and a2 bands were processed for every subject as follows: a1 from TF to the midpoint of the TF-IAF range, and a2 from this midpoint to the IAF crest. The mean frequency range registered in MCI subjects considered on average are delta 2.9–4.9 Hz, theta 4.9–6.9 Hz, a1 6.9–8.9 Hz, a2 8.9–10.9 Hz, and a3 10. At long last, in the frequency bands decided on an individual premise, we registered the relative power spectra for every subject. The relative power density for every frequency band was figured as the proportion between the absolute power and the mean power density from 2 to 45 Hz. The a3/a2 frequency power ratio was figured in all subjects and three groups were acquired by tertile estimations of a3/a2: low (a3/a2<1), middle (1<a3/a2<1.16), and high (a3/a2>1.17). The tertile division permits an adjusted distribution of the sample in study with the benefit of keeping away from the extreme values in the statistical examination. The three groups of MCI have been demonstrated in past studies to appear different among each other. Specifically, the high a3/a2 EEG power proportion MCI group is at significant danger to change over to ADCitation31–Citation44 contrasted with the other a3/a2 power ratio MCI groups. Also, we used this group subdivision for homogeneity and equivalence with the past studies.
MRI scans
For every subject, a high-resolution sagittal T1-weighted volumetric MRI output was procured at the Neuroradiology Unit of the “Città di Brescia” Hospital, Brescia, by utilizing a 1.0 T Philips Gyroscan scanner with a gradient echo three-dimensional procedure: TR =20 ms, TE =5 ms, flip angle =30°, field of perspective =220 mm, securing grid =256 ×256 mm, and cut thickness =1.3 mm.
Cortical thickness estimation steps
Cortical thickness estimations for 74 patients with MCI were made utilizing a completely automated MRI-based investigation system: FreeSurfer v5.1.0, an arrangement of software instruments for the investigation of cortical and subcortical brain structures. Quickly, in the cortical surface stream, the models of the limit between white matter and cortical gray matter (CGM), and also the pial surface, were constructed. At the point when these surfaces are known, a mixed bag of anatomical measures gets the opportunity to be possible, including cortical thickness, surface region, curvature, and surface normal at each point on the cortex.Citation62,Citation63
Single-subject investigation
For every subject, the T1-weighted, anatomical 3D MRI dataset were changed over from Dicom design into.mgz file position, intensity differences were amended, and a standardized intensity picture was made. The volume was registered with the Talairach atlas through a relative enlistment. Next, the skull was stripped utilizing a deformable format model,Citation64 and extracerebral voxels were uprooted. The intensity standardized, skull-stripped picture was then worked on by a division system in view of the geometric structure of the gray–white interface. Voxels were named white or gray matter, and slicing planes were chosen to partition the hemispheres from one another. A white matter surface was then produced for every hemisphere by tiling the outside of the white matter mass for that hemisphere. Cortical thickness estimations were done by computing the separation between those surfaces (white and pial surfaces) at each of ~160,000 points on the hemispheres over the cortical mantle.Citation65
Group analysis
Keeping in mind the end goal to relate and look at anatomical elements crosswise over subjects, it was important to build up a mapping that determines a kind of correspondence between every area in one cerebrum and comparing the area in another. In this way, the pial surface of an individual subject was expanded to focus the huge scale collapsing examples of the cortex, and in this way changed into a circle to minimize metric contortion. The collapsing examples of the individual were then adjusted to a normal collapsing example utilizing a high-determination surface-based averaging. Thickness measures were mapped to the swelled surface of every member’s cerebrum reproduction, permitting representation of information over the whole cortical surface. Lastly, cortical thickness was smoothed with a 20 mm full width at half-stature Gaussian portion to decrease neighborhood varieties in the estimations for further examination.Citation66–Citation71
Statistical analysis
Contrasts between groups in sociodemographic and neuropsychological components were investigated utilizing SPSS software Version 13.0 (SPSS, Chicago, IL, USA) performing an analysis of variance (ANOVA) for continuous variables and paired χ2 test for dichotomous variables. For continuous variables, post hoc pairwise examinations among groups were performed with the Games–Howell or Bonferroni tests, contingent upon homogeneity of difference tried with Levene’s test. Concerning the neuroimaging examination, the Qdec interface in FreeSurfer programming was utilized. A vertex-by-vertex examination was completed performing a general linear model to dissect whether any distinction in mean cortical thickness existed between groups (low: a3/a2<1 μV2; center: 1<a3/a2<1.16 μV2; high: a3/a2>1.17 μV2). The accompanying matches were completed as follows: high versus low, high versus middle, and middle versus low. Age, sex, instruction, global cognitive level (MMSE score), and white matter hyperintensities were presented as covariates in the examination to abstain from frustrating variables. We initially attempted to apply a proper Bonferroni numerous correlation revision in our examination (at P<0.05 corrected). However, no P-value was calculated after this revision. In this way, we decided to set a more restrictive limit (than P<0.05 rectified) at P<0.001 uncorrected for multiple comparisons. Besides, we considered the clusters as noteworthy if they were equivalent to or >30 mm2. Lastly, a surface map was created to show the outcomes on a normalized brain. For illustrative purposes, significance was thresholded to a P-estimation of <0.01 uncorrected for multiple matches.
Statistical follow-up analysis
To begin with, one-way ANOVAs were performed keeping in mind the end goal to confirm that a3/a2 relative power ratio was altogether diverse among groups. At long last, a discriminant factor analysis was performed to check if the same critical variables could be helpful in separating subjects and could have a diagnostic meaning. The model was assembled as follows: variable choice was finished with a stepwise technique, tolerance was set to 0.01, and F to enter to 1.0.
SPECT scan
Twenty-seven patients and 17 ordinary controls experienced SPECT check in the nuclear medicine unit of the Ospedali Riuniti Hospital, Bergamo. Every subject got an intravenous infusion of 925 MBq of technetium-99m ethyl cysteinate dimer (99mTc-ECD) in resting condition, lying recumbent with eyes shut in a calm, faintly lit room. Forty minutes to an hour after infusion, cerebrum SPECT was performed utilizing a double-head pivoting gamma camera (GE Elscint Helix) outfitted with low vitality high determination, parallel opening collimators. A 128×128 pixel framework, zoom =1.5, was utilized for picture securing with 120 perspectives over a 360° circle (in 3° stages) with a pixel size and a cut thickness of 2.94 mm. Butterworth separated back projection (order =7, cutoff =0.45 cycles/cm) was utilized for picture remaking, and weakening redress was performed utilizing Chang’s system (lessening coefficient =0.11/cm). Pictures were traded in DICOM design.
SPECT processing method
To accomplish an exact standardization, we created a study-specific SPECT format utilizing both SPECT and MR sweeps of all patients and typical controls under study following a strategy portrayed in subtle element somewhere else.Citation72 Quickly, we made a redid superior quality MR layout, we changed over SPECT sweeps to Analyze configuration utilizing MRIcro (Columbia, SC, USA), and we coregistered them to their individual MR filters with SPM2 (SPM, Statistical Parametric Mapping, form 2; Functional Imaging Laboratory, London, England). We standardized each MR to the altered MR layout through a nonlinear change (cutoff 25 mm) and applied the normalization parameters to the coregistered SPECT. We obtained the customized SPECT template as the mean of all the latter normalized SPECT images. The creation of a study-specific template allows for better normalization since it accounts for low uptake in ventricular structures and cortical hypoperfusion effects frequently present in elderly patients. The regions of interest (ROI), decided for perfusion investigations in every hemisphere from the Pick atlas by a subroutine executed on SPM2, were as follows: the thalamus, the hippocampal–amygdalar complex, frontal, parietal, and temporal lobes.Citation72
SPECT statistical analysis
Every single factual analysis was performed utilizing SPSS programming Version 13.0. We explored the essentialness of the contrast between the two groups (MCI at low and at high hazard to create risk to develop AD) in sociodemographical, clinical, and intellectual components utilizing the χ2 test for all out variables (sex and ApoE carriers), and Student’s independent t-test for continuous variables (volumetric, perfusion elements, and EEG frequencies). In all cases, we set the centrality limit at P<0.05. Since local SPECT outputs were coregistered to their individual MR pictures, and the study-specific SPECT layout was coregistered to the superior quality MR format, all the standardized SPECT and MR pictures utilized for the factual examination were coregistered to the SPM standard anatomical space. Pearson’s r correlations were surveyed between the chosen perfusion ROI (regarding age adjusted W-scores) and the obtained EEG frequencies in both groups.
Results
Magnetic resonance imaging
shows that the sociodemographic and neuropsychological issues of MCI subgroups are characterized by the tertile estimations of a3/a2 power ratio. The ANOVA examination demonstrated that there were no factually noteworthy contrasts between information gathered that matched for age, sex, white matter hyperintensities load, instruction, or mean cognitive level.
Pattern of cortical thickness between groups
High versus low: when contrasted with subjects with low a3/a2, patients with high a3/a2 power ratio show diminishing in the respective superiotemporal, supra-marginal, and precuneus cortices, in the right inferior parietal cortex, and in the insular cortex. The total volume of the CGM lessening in the high a3/a2 group contrasted with the low a3/a2 power ratio group was 471 mm2 ().
Figure 1 The red markings represent the brain regions with higher regional cortical thickness in MCI patients with high a3/a2 ratio as compared to MCI patients with low a3/a2 ratio (P<0.01 uncorrected).
Notes: The color coding for P-values is on a logarithmic scale. Results are presented on the pial cortical surface of the brain: dark gray regions represent sulci and light gray regions represent gyri.
Abbreviations: MCI, mild cognitive impairment; a3, alpha3; a2, alpha2.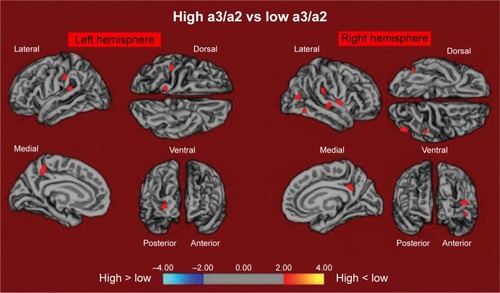
High versus middle: the same group demonstrated a comparative, however, less wide example of cortical atrophy when contrasted with the middle a3/a2 group: the districts of decay were situated in the left supramarginal gyrus, left precuneus, and postcentral cortex. The aggregate CGM diminishment in the high a3/a2 group contrasted with the middle a3/a2 group was 160 mm2 (). At the point when the high group was contrasted with the low group, the aggregate degree of cortical diminishing (471 mm2) was 34% higher than in the examination of the high group to the middle group (160 mm2). No areas of major cortical decay were found in groups with middle or low a3/a2 frequency power ratio when contrasted with the high a3/a2 frequency power ratio subjects’ cluster. No noteworthy cortical thickness contrasts were found between middle and low a3/a2 power ratio groups.
Figure 2 The red markings represent the brain regions with higher regional cortical thickness in MCI patients with high a3/a2 ratio as compared to MCI patients with middle a3/a2 ratio (P<0.01 uncorrected).
Notes: The color coding for P-values is on a logarithmic scale. Results are presented on the pial cortical surface of the brain: dark gray regions represent sulci and light gray regions represent gyri.
Abbreviations: MCI, mild cognitive impairment; a3, alpha3; a2, alpha2.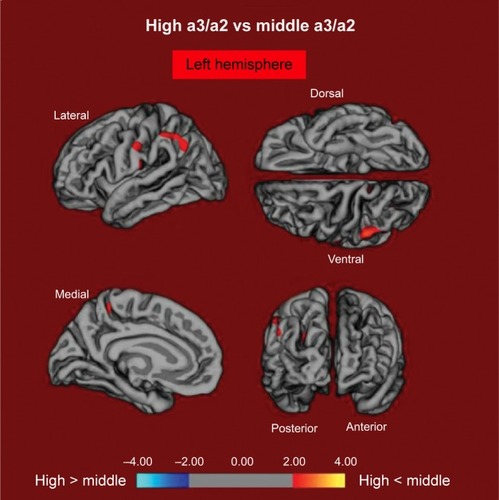
SPECT
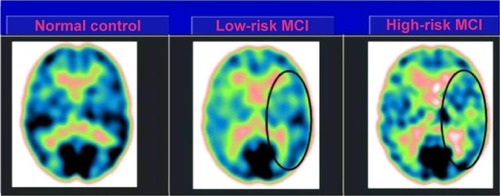
Twenty-seven MCI patients were enlisted for the present study and delegated at high hazard (with the a3/a2 EEG power ratio as >1.17; N=13) or at low hazard (with the a3/a2 EEG power ratio <1.17; N=14) to develop AD. The two groups were comparative for age (P=0.56), instruction in years (P=0.87), sex (P=0.17), ApoE genotype (P=0.15), MMSE scores (P=0.31), and white matter injuries load (P=0.88). demonstrates that the visual rating size of the SPECT examines the illustration of typical control, MCI with low risk to change over to AD, and MCI with high hazard to change over to AD. ANOVA results demonstrate that the chosen cutoff was viable in recognizing two unique groups: patients with high hazard to create AD indicate essentially higher a3/a2 power ratio than patients with low risk (P=0.0001). Also, a control examination was performed on the single frequencies. The outcomes demonstrate that the increment of a3/a2 frequency power ratio was because of both increment of a3 (P=0.001) and reduction of a2 (P=0.0001) and not to the change of a solitary frequency band. This control examination was performed in light of the fact that the change of a single-frequency band could be because of chance; however, this was not the situation. Of note, no distinctions were found for beta 1, beta 2, gamma, theta EEG bands, or theta/gamma frequency power ratio (all P>0.11). In spite of the fact that the mean perfusion in all the chosen ROIs was comparable between groups (all P>0.38), in the group with high a3/a2 power ratio, there is a steady pattern to a lower perfusion. Additionally, left HVs were lower for AD in high-hazard patients compared to low-risk patients (P=0.001). In patients who are generally safe to create AD, a huge Pearson’s r negative correlation was found between perfusion in the hippocampal complex ROI and theta oscillation (r=−0.544; P=0.044). In patients who are at high hazard to create AD, different connections were found. As opposed to patients who are generally safe, we discovered a positive relationship between perfusion in the hippocampal complex ROI and theta band (r=0.729; P=0.005) in high-hazard patients, whereas transient ROI corresponded particularly with theta/gamma power ratio (r=0.736; P=0.004) in this group. No other huge relationships were found in either group between perfusion ROIs and other EEG rhythms or HVs. Additionally, no noteworthy relationships were found between hippocampal complex ROI and theta frequency band pooling in low- and high-hazard patients together (r=0.086; P=0.671).
Figure 3 SPECT visual rating.
Abbreviations: SPECT, single-photon emission computed tomography; MCI, mild cognitive impairment.
Follow-up results
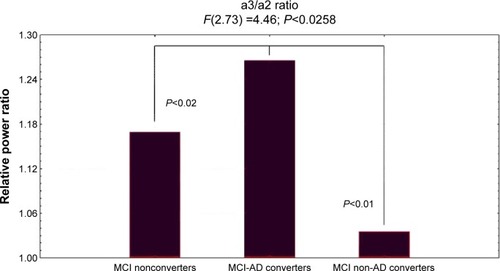
showed ANOVA with significant statistical difference of theta/gamma and a3/a2 relative power ratio (F2,73=3.70, P<0.03, and F2,73=4.46, P<0.02, respectively). Duncan’s post hoc test showed a significant increase (P<0.01) of theta/gamma in both MCI converters group and nonconverters as well as a significant increase of a3/a2 ratio in MCI-AD converters with respect to the other groups (P<0.02). In order to strengthen the results, the analysis was also repeated covarying the HV and NPS scores. Significant results were confirmed for both theta/gamma (F2,73=2.49, P<0.05) and a3/a2 ratio (F2,73=3.15, P<0.04).
Figure 4 ANOVA results of theta/gamma and a3/a2 relative power ratio.
Abbreviations: ANOVA, analysis of variance; a3, alpha3; a2, alpha2; MCI, mild cognitive impairment; AD, Alzheimer’s disease.
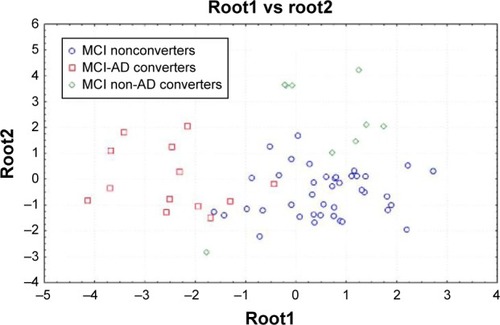
The results in discriminant factor analysis show a statistical significant result for the model (F30,185=11.16, P<0.00001; Wilks Lambda 0.04). A correct classification of groups was performed in 85% of cases in the first group, 94% in the second group, and 86% in the third group. The mean correct percentage of correct classification was 88.3%. Based on the model structure, the variables accepted, ordered for statistical significance, were theta/gamma frequency ratio (P<0.0003) and a3/a2 frequency ratio (P<0.03). EEG markers, together with the duration of disease, were the most powerful variables in discriminating groups. The canonical analysis shows that the variables accepted were arranged in two discriminant functions (or roots). The two roots were all statistically significant (root1, P<0.0001; root2, P<0.001). shows scatterplot of canonical scores (the root1 vs root2). The factor loadings of the variables on each discriminant function, as addressed by the factor structure matrix, shows that in root1, theta/gamma relative power ratio has positive (0.5) and a3/a2 relative power ratio has negative (−0.7) correlations, whereas in root2, theta/gamma relative power ratio has negative (−0.6) and a3/a2 relative power ratio has positive (0.8) correlations with the discriminant function. As a consequence, an increase of theta/gamma relative power ratio better identifies the third group and the increase of a3/a2 relative power ratio better identifies the second group.
Figure 5 Discriminant factor analysis results: root1 vs root2.
Discussion
Study limitations
There are a few confinements and provisions in the present study: 1) further studies are expected to affirm our outcome on a bigger sample size; 2) the present results have to be confirmed with the new diagnostic criteria for prodromal AD; 3) the example of cortical thickness ought to be researched on the remaining EEG frequency measures; 4) the conservative P<0.001 utilized here is not so adequate given that the quantity of correlations and a correction with multiple comparisons test should be more adequate. However, because of the exploratory nature of the study, it is conceivable a tolerant approach keeping in mind the end goal to maintain a strategic distance from to dismiss potentially fascinating results. It stays clear that further studies with less tolerant measurable methodology are required to affirm the results. Of note, the reliability of the outcomes is bolstered by 1) the thorough determination criteria of the subjects, 2) the high measurable edge (P<0.001) considered, and 3) lastly, the substantial size of pixel represented the examination (30 mm2).
EEG markers and cortical atrophy
The relationship between an EEG marker (the a3/a2 power ratio) and the cortical thickness in subjects with MCI was looked in the present study. The a3/a2 ratio was picked in light of the fact that past work has demonstrated that MCI subjects with higher a3/a2 extent are at noteworthy threat to make AD.Citation31–Citation34 Our results show that the MCI pack with higher a3/a2 extent has a more vital overall cortical rot than interchange subgroups, along these lines attesting past writing.Citation18,Citation31 Additionally, the more unmistakable rot is basic in two specific cerebrum domains: the precuneus and the supramarginal gyrus (a brain district having a spot inside the parietal lobule), in both left and right hemispheres. These results were for the most part expected considering past studies. Most likely, useful and auxiliary adjustments of the precuneus were seen in MCI,Citation73–Citation75 and likewise in AD,Citation76–Citation78 so that the rot of the precuneus has been seen as a pathognomonic marker prodromal AD. Later studies recommend that specific territories, particularly the precuneus and posterior cingulate together with medial temporal lobe, are exposed to amyloid load in AD pathology.Citation79,Citation80
EEG markers and regional cerebral perfusion
Our outcomes affirm the results of past studies that have demonstrated that patients with high risk of conversion to AD have diminished SPECT perfusion in the temporoparietal cortex and parietal lobule.Citation77,Citation78 Moreover, our results certify a definitely comprehended association with hippocampal decay.Citation77 The present study exhibits an association between cerebral perfusion and theta rhythm. Neverthless, the connection rises just when considering the distinctive groups exclusively utilizing the a3/a2 EEG power ratio. This is affirmed by the finding that when the groups are combined, no relationship could be found. This is the principle part of the study and the particular curiosity of the outcomes. Low levels of hippocampal theta EEG power is maintained in patients at lower risk of AD, who have a steady pattern toward a higher brain local blood perfusion, while in patients at higher risk, with a fundamentally lower cerebral blood perfusion, theta frequency power tends to be greater in the hippocampus. Theta rhythms are for the most part not detected in the remaining EEG recordings.
Nonetheless, a theta force increment is seen over the frontal and transient ranges amid learning and memory undertakings. The theta rhythms that are recorded amid these undertakings are thought to be created by the initiation of the septal–hippocampal framework. The hippocampus has a cholinergic innervation beginning from the basal forebrain, the medial septum, and the vertical limb of the diagonal band of Broca. The synchronized depolarization of hippocampal neurons produces field potentials that have a primary recurrence of 3–12 Hz and are generally known as hippocampal theta rhythm.Citation69,Citation70 A cholinergic–glutamatergic speculation of AD, in which most indications may be clarified by cholinergic–glutamatergic deficiencies, has been progressed. Neuronal damage may incorporate an excitotoxic part that perhaps adds to the early cholinergic deficiency. This excitotoxic segment may happen, at any rate to a limited extent, at the septal level where the somas of cholinergic neurons are found. This affront may alter septal systems and add to the irregular information processing in AD brain, including its hyperexcitability states.
Diagnostic implications
Following 3 years of postliminary, three subgroups were described as converters to AD (N=18), converters to non-AD dementia (N=14), and nonconverters (N=42) MCI to AD converters. Increase of a3/a2 frequency power ratio was just connected with the change to AD. EEG markers permit a mean right rate of right characterization up to 88.3%. Future forthcoming studies are expected to assess the affectability and specificity of these measures for anticipating an AD result.Citation31
Neural networks changes
From a neurophysiological perspective, the synchronization (or power increment) of EEG alpha oscillations has been connected with the hindrance timing speculationCitation24 and with poor data transmission, as indicated by the entropy hypothesis.Citation39,Citation81–Citation104 The increments in alpha amplitudes reflect hindrance of cortical mind districts.Citation37,Citation38,Citation105 Thus, the entropy hypothesis expressed that synchronization is disadvantageous for putting away data, as it decreases the stream of data.Citation39 Entropy is a measure of the lavishness of data encoded in a succession of occasions. Applying this thought to the neural frameworks, it has been demonstrated that the level of information that is encoded in neural systems increases as a part of desynchronization and decreases as a component of synchronized neural networks.Citation90,Citation106,Citation107 This theory has been affirmed in clinical studies in patients with memory deficienciesCitation108 and in addition amid states where there is minimal subjective handling (eg, epileptic seizures or moderate wave rest).Citation80,Citation109,Citation110 As for the cognitive decline because of AD, the run of typical synaptic losses could keep the physiological adaptability of brain neural assemblies, blocking the desynchronizing downstream adjustment of the mind action. As a result, it could be estimated that the disturbance of the cortical system because of degenerative pathology, instigating cortical atrophy, could focus on oversynchronization of the brain oscillatory action. The synchronization condition of the high alpha power could keep the making of a semantic tangible code, and, hence, the roundabout memory follows.Citation111–Citation113 Of note, as indicated by the new demonstrative criteria for AD, the estimation of affectability to semantic prompting can effectively separate patients with AD from sound controls, notwithstanding when patients are compared to controls on MMSE scores or when illness seriousness is extremely mild. Our outcomes are for the most part in accordance with this theory, recommending that an increment in the power of high alpha oscillations mirrors an impairment of data processing.Citation27,Citation28,Citation114–Citation132 Of note, such an example of diminished cerebral bloodstream and increased excitability was discovered even preceding the onset of cognitive decline or cortical atrophy.Citation29,Citation30
Conclusion
Increase of EEG upper/low alpha power ratio was related to cortical decay and lower territorial perfusion in the temporoparietal zone in subjects with prodromal AD. The addition in the upper/low alpha power ratio, together with MRI and SPECT, as well as PET-FDG and PET-amyloid biomarkers, could be useful for assessing individuals at high hazard to develop AD and may be useful in the clinical setting.
Disclosure
The author reports no conflicts of interest in this work.
References
- DuboisBFeldmanHHJacovaCResearch criteria for the diagnosis of Alzheimer’s disease: revising the NINCDS-ADRDA criteriaLancet Neurol200768734746 Review: Alzheimers Dement. 2011;7(3):270–27917616482
- AlbertMSDeKoskySTDicksonDThe diagnosis of mild cognitive impairment due to Alzheimer’s disease: recommendations from the National Institute on Aging-Alzheimer’s Association workgroups on diagnostic guidelines for Alzheimer’s diseaseAlzheimers Dement20117327027921514249
- HampelHBürgerKTeipelSJBokdeALZetterbergHBlennowKCore candidate neurochemical and imaging biomarkers of Alzheimer’s diseaseAlzheimers Dement20084384818631949
- GalluzziSGeroldiCAmicucciGTranslational Outpatient Memory Clinic Working GroupSupporting evidence for using biomarkers in the diagnosis of MCI due to ADJ Neurol2013260264065023070466
- MaYZhangSLiJPredictive accuracy of amyloid imaging for progression from mild cognitive impairment to Alzheimer disease with different lengths of follow-up: a meta-analysis. [Corrected]Medicine (Baltimore)20149327e150 Review25501055
- LeuzyACarterSFChiotisKAlmkvistOWallANordbergAConcordance and diagnostic accuracy of [11C]PIB PET and cerebrospinal fluid biomarkers in a sample of patients with mild cognitive impairment and Alzheimer’s diseaseJ Alzheimers Dis20154541077108825649653
- GietlAFWarnockGRieseFRegional cerebral blood flow estimated by early PiB uptake is reduced in mild cognitive impairment and associated with age in an amyloid-dependent mannerNeurobiol Aging20153641619162825702957
- ChoiHJSeoEHYiDAmyloid-independent amnestic mild cognitive impairment and serum apolipoprotein A1 levelsAm J Geriatr Psychiatry Epub2015626
- Jiménez-BonillaJFBanzoIDe Arcocha-TorresMAmyloid imaging with 11C-PIB in patients with cognitive impairment in a clinical setting: a visual and semiquantitative analysisClin Nucl Med Epub2015818
- DevanandDPMikhnoAPeltonGHPittsburgh compound B (11C-PIB) and fluorodeoxyglucose (18 F-FDG) PET in patients with Alzheimer disease, mild cognitive impairment, and healthy controlsJ Geriatr Psychiatry Neurol201023318519820430977
- PalmqvistSZetterbergHMattssonNAlzheimer’s Disease Neuroimaging Initiative, Swedish BioFINDER Study GroupDetailed comparison of amyloid PET and CSF biomarkers for identifying early Alzheimer diseaseNeurology201585141240124926354982
- KhanWAguilarCKiddleSJAlzheimer’s Disease Neuroimaging InitiativeA subset of cerebrospinal fluid proteins from a multi-analyte panel associated with brain atrophy, disease classification and prediction in Alzheimer’s diseasePLoS One2015108e013436826284520
- BrunoDGrotheMJNierenbergJThe relationship between CSF tau markers, hippocampal volume and delayed primacy performance in cognitively intact elderly individualsAlzheimers Dement (Amst)201511818626258161
- SaykinAJShenLYaoXAlzheimer’s Disease Neuroimaging InitiativeGenetic studies of quantitative MCI and AD phenotypes in ADNI: progress, opportunities, and plansAlzheimers Dement2015117792814 Review26194313
- Martínez-TorteyaATreviñoVTamez-PeñaJGImproved diagnostic multimodal biomarkers for Alzheimer’s disease and mild cognitive impairmentBiomed Res Int2015201596131426106620
- PeraniDCeramiCCaminitiSPCross-validation of biomarkers for the early differential diagnosis and prognosis of dementia in a clinical settingEur J Nucl Med Mol Imaging Epub201594
- FrisoniGBSabattoliFLeeADDuttonRATogaAWThompsonPMIn vivo neuropathology of the hippocampal formation in AD: a radial mapping MR-based studyNeuroimage200632110411016631382
- FrisoniGBPievaniMTestaCThe topography of grey matter involvement in early and late onset Alzheimer’s diseaseBrain200713072073017293358
- FrisoniGBGanzolaRCanuEMapping local hippocampal changes in Alzheimer’s disease and normal ageing with MRI at 3 TeslaBrain2008131pt 123266327618988639
- FrisoniGBPrestiaARasserPEBonettiMThompsonPMIn vivo mapping of incremental cortical atrophy from incipient to overt Alzheimer’s diseaseJ Neurol2009256691692419252794
- FrisoniGBAlzheimer disease: biomarker trajectories across stages of Alzheimer diseaseNat Rev Neurol20128629930022565208
- van StrienNMCappaertNLWitterMPThe anatomy of memory: an interactive overview of the parahippocampal-hippocampal networkNat Rev Neurosci200910427228219300446
- MissonnierPHerrmannFRMichonAFazio-CostaLGoldGGiannakopoulosPEarly disturbances of gamma band dynamics in mild cognitive impairmentJ Neural Transm2010117448949820217436
- SteriadeMGrouping of brain rhythms in corticothalamic systemsNeuroscience2006137410871106 Review16343791
- Lopes da SilvaFHVosJEMooibroekJvan RotterdamARelative contributions of intracortical and thalamo-cortical processes in the generation of alpha rhythms, revealed by partial coherence analysisElectroencephalogr Clin Neurophysiol1980505–64494566160987
- IngberLNunezPLNeocortical dynamics at multiple scales: EEG standing waves, statistical mechanics, and physical analogsMath Biosci2011229216017321167841
- NunezPGeneration of human EEG rhythms by a combination of long and short-range neocortical interactionsBrain Topogr198911992152641263
- StamCJMontezTJonesBFDisturbed fluctuations of resting state EEG synchronization in Alzheimer’s diseaseClin Neurophysiol2005116370871515721085
- MorettiDVBabiloniFCarducciFComputerized processing of EEG-EOG-EMG artifacts for multi-centric studies in EEG oscillations and event-related potentialsInt J Psychophysiol200347319921612663065
- Moretti DavideVBabiloniCBinettiGIndividual analysis of EEG frequency and band power in mild Alzheimer’s diseaseNeurophysiol Clin2004115299308
- MorettiDVMiniussiCFrisoniGVascular damage and EEG markers in subjects with mild cognitive impairmentNeurophysiol Clin200711818661876
- MorettiDVMiniussiCFrisoniGBHippocampal atrophy and EEG markers in subjects with mild cognitive impairmentClin Neurophysiol2007118122716272917977786
- MorettiDVFrisoniGBPievaniMCerebrovascular disease and hippocampal atrophy are differently linked to functional coupling of brain areas: an EEG coherence study in MCI subjectsJ Alzheimers Dis200814328529918599955
- MorettiDVFrisoniGBFracassiCMCI patients’ EEGs show group differences between those who progress and those who do not progress to ADNeurobiol Aging201132456357120022139
- BakkourAMorrisJCDickersonBCThe cortical signature of prodromal AD: regional thinning predicts mild AD dementiaNeurology200972121048105519109536
- KlimeschWDoppelmayrMHanslmayrSUpper alpha ERD and absolute power: their meaning for memory performanceProg Brain Res200615915116517071229
- KlimeschWSausengPHanslmayrSEEG alpha oscillations: the inhibition timing hypothesisBrain Res Rev200753638816887192
- KlimeschWEvoked alpha and early access to the knowledge system: the P1 inhibition timing hypothesisBrain Res20111408527121774917
- ShannonCEWeaverWThe Mathematical Theory of CommunicationUrbana, ILUniversity of Illinois Press1949
- FolsteinMFFolsteinSEMcHughPR‘Mini mental state’: a practical method for grading the cognitive state of patients for clinicianJ Psychiatr Res1975121891981202204
- HughesCPBergLDanzigerWLCohenLAMartinRLA new clinical rating scale for the staging of dementiaBr J Psychiatry198214012251230
- RosenWGTerryRDFuldPAKatzmanRPeckAPathological verification of ischemic score in differentiation of dementiasAnn Neurol1980754864887396427
- LawtonMPBrodieEMAssessment of older people: self maintaining and instrumental activity of daily livingJ Gerontol19699179186
- PetersenRCDoodyRKurzACurrent concepts in mild cognitive impairmentArch Neurol200158121985199211735772
- PortetFOussetPJVisserPJMCI Working Group of the European Consortium on Alzheimer’s Disease (EADC)Mild cognitive impairment (MCI) in medical practice: a critical review of the concept and new diagnostic procedure. Report of the MCI Working Group of the European Consortium on Alzheimer’s diseaseJ Neurol Neurosurg Psychiatry20067771471816549412
- LezakMHowiesonDLoringDWNeuropsychological Assessment4th edOxfordUniversity Press2004
- RadloffLSThe CES-D scale: a self-report depression scale for research in the general populationAppl Psychol Meas19771385401
- MorettiDVMild Cognitive Impairment: Structural, Metabolical, and Neurophysiological Evidence of a Novel EEG BiomarkerFront Neurol201576615210.3389/fneur.2015.0015226217299
- KlimeschWEEG-alpha rhythms and memory processesInt J Psychophysiol1997263193409203012
- KlimeschWEEG alpha and theta oscillations reflect cognitive and memory performance: a review and analysisBrain Res Rev19992916919510209231
- KaplanAYThe problem of segmental description of human electroencephalogramHuman Physiol199925107114
- CohenBASancesAStationarity of the human electroencephalogramMed Biol Eng Comput197715513518199805
- KawabataNTest of statistical stability of the electroencephalogramBiol Cybern197622235238953081
- McEwenJAAndersonGBModeling the stationarity and gaussianity of spontaneous electroencephalographic activityIEEE Trans Biomed Eng1975223613691193622
- KipińskiLKönigRSielużyckiCKordeckiWApplication of modern tests for stationarity to single-trial MEG data: transferring powerful statistical tools from econometrics to neuroscienceBiol Cybern20111053–418319522095173
- MorettiDVFracassiCPievaniMIncrease of theta/gamma ratio is associated with memory impairmentClin Neurophysiol2009120229530319121602
- MorettiDVPievaniMFracassiCIncrease of theta/gamma and alpha3/alpha2 ratio is associated with amygdalo-hippocampal complex atrophyJ Alzheimers Dis200917234935719363263
- MorettiDVPievaniMGeroldiCIncreasing of hippocampal atrophy and cerebrovascular damage is differently associated with functional cortical coupling in MCI patientsAlzheimer Dis Assoc Disord200923432333219561442
- CabezaRHemispheric asymmetry reduction in older adults: the HAROLD modelPsychol Aging200217185100 Review11931290
- BalstersJHO’ConnellRGGalliAChanges in resting connectivity with age: a simultaneous electroencephalogram and functional magnetic resonance imaging investigationNeurobiol Aging20133492194220723608113
- WatsonPConroyAMoranGDuncanSRetrospective study of sensitivity and specificity of EEG in the elderly compared with younger age groupsEpilepsy Behav201225340841123110971
- TenkeCEKayserJMillerLNeuronal generators of posterior EEG alpha reflect individual differences in prioritizing personal spiritualityBiol Psychol201394242643223998996
- GrandyTHWerkle-BergnerMChicherioCSchmiedekFLövdénMLindenbergerUPeak individual alpha frequency qualifies as a stable neurophysiological trait marker in healthy younger and older adultsPsychophysiology201350657058223551082
- GrandyTHWerkle-BergnerMChicherioCLövdénMSchmiedekFLindenbergerUIndividual alpha peak frequency is related to latent factors of general cognitive abilitiesNeuroimage201379101823624490
- BekhterevaVSanderCForschackNOlbrichSHegerlUMüllerMMEffects of EEG-vigilance regulation patterns on early perceptual processes in human visual cortexClin Neurophysiol201412519810723871178
- SégonneFDaleAMBusaEA hybrid approach to the skull stripping problem in MRINeuroimage20042231060107515219578
- FischlBDaleAMMeasuring the thickness of the human cerebral cortex using magnetic resonance imagesProc Natl Acad Sci U S A200097110441104910995460
- HanXJovicichJSalatDReliability of MRI-derived measurements of human cerebral cortical thickness: the effects of field strength, scanner upgrade and manufacturerNeuroimage200632118019416651008
- GronenschildEHHabetsPJacobsHIThe effects of FreeSurfer version, workstation type, and Macintosh operating system version on anatomical volume and cortical thickness measurementsPLoS One201276e3823422675527
- DeCarliCFletcherERameyVHarveyDJagustWJAnatomical mapping of white matter hyperintensities (WMH): exploring the relationships between periventricular WMH, deep WMH, and total WMH burdenStroke200536505515576652
- PennanenCTestaCLaaskoMPA voxel based morphometry study on mild cognitive impairmentJ Neurol Neurosurg Psychiatry200576111415607988
- MarkesberyWRSchmittRAKryscioRJDavisDSmithCWeksteinDNeuropathologic substrate of mild cognitive impairmentArch Neurol200663384616401735
- McKhannGMKnopmanDSChertkowHThe diagnosis of dementia due to Alzheimer’s disease: recommendations from the national institute on aging-Alzheimer’s association workgroups on diagnostic guidelines for Alzheimer’s diseaseAlzheimers Dement2011726326921514250
- SperlingRAAisenPSBeckettLAToward defining the preclinical stages of Alzheimer’s disease: recommendations from the National Institute on Aging-Alzheimer’s Association workgroups on diagnostic guidelines for Alzheimer’s diseaseAlzheimers Dement20117328029221514248
- CaroliATestaCGeroldiCBrain perfusion correlates of medial temporal lobe atrophy and white matter hyperintensities in mild cognitive impairmentJ Neurol200725481000100817375260
- MatsudaHThe role of neuroimaging in mild cognitive impairmentNeuropathology20072757057718021379
- PetrellaJRWangLKrishnanSCortical deactivation in mild cognitive impairment: high-field-strength functional MR imagingRadiology200724522423517885190
- PihlajamakiMJauhiainenAMSoininenHStructural and functional MRI in mild cognitive impairmentCurr Alzheimer Res2009617918519355853
- DickersonBCSperlingRALarge-scale functional brain network abnormalities in Alzheimer’s disease: insights from functional neuroimagingBehav Neurol200921637519847046
- RyuSYKwonMJLeeSBMeasurement of precuneal and hippocampal volumes using magnetic resonance volumetry in Alzheimer’s diseaseJ Clin Neurol2010619620321264200
- SperlingRADickersonBCPihlajamakiMFunctional alterations in memory networks in early Alzheimer’s diseaseNeuromolecular Med201012274320069392
- de HaanWMottKvan StraatenECScheltensPStamCJActivity dependent degeneration explains hub vulnerability in Alzheimer’s diseasePLoS Comput Biol201288e100258222915996
- PievaniMde HaanWWuTSeeleyWWFrisoniGBFunctional network disruption in the degenerative dementiasLancet Neurol20111082984321778116
- ChatwalJPSperlingRAFunctional MRI of mnemonic networks across the spectrum of normal aging, mild cognitive impairment, and Alzheimer’s diseaseJ Alzheimers Dis2012310S155S16722890098
- JonesDTMachuldaMMVemuriPAge-related changes in the default mode network are more advanced in Alzheimer diseaseNeurology201177161524153121975202
- BrierMRThomasJBSnyderAZLoss of intranetwork and internetwork resting state functional connections with Alzheimer’s disease progressionJ Neurosci201232268890889922745490
- PalopJJMuckeLSynaptic depression and aberrant excitatory network activity in Alzheimer’s disease: two faces of the same coin?Neuromolecular Med2010121485519838821
- StamCJvan der MadeYPijnenburgYAScheltensPEEG synchronization in mild cognitive impairment and Alzheimer’s diseaseActa Neurol Scand200310829096 a. Neuroimage. 2012;59(4):3548–356212859284
- BhattacharyaBSCoyleDMaguireLPAlpha and theta rhythm abnormality in Alzheimer’s disease: a study using a computational modelAdv Exp Med Biol2011718577321744210
- RossiniPMBuscemaMCapriottiMIs it possible to automatically distinguish resting EEG data of normal elderly vs mild cognitive impairment subjects with high degree of accuracy?Clin Neurophysiol200811971534154518485814
- WuXLiRFleisherASAltered default mode network connectivity in Alzheimer’s disease – a resting functional MRI and Bayesian network studyHum Brain Mapp201132111868188121259382
- WonderlickJSZieglerDAHosseini-VarnamkhastiPReliability of MRI-derived cortical and subcortical morphometric measures: effects of pulse sequence, voxel geometry, and parallel imagingNeuroimage20094441324133319038349
- ZhangSLiCSFunctional connectivity mapping of the human precuneus by resting state fMRINeuroimage20125943548356222116037
- MorbelliSDrzezgaAPerneczkyRResting metabolic connectivity in prodromal Alzheimer’s disease. A European Alzheimer Disease Consortium (EADC) projectNeurobiol Aging201233112533255022365486
- GhaemOMelletECrivelloFMental navigation along memorized routes activates the hippocampus, precuneus, and insulaNeuroreport199787397449106758
- LeichnetzGRConnections of the medial posterior parietal cortex (area 7m) in the monkeyAnat Rec200126321523611360237
- CavannaAETrimbleMRThe precuneus: a review of its functional anatomy and behavioural correlatesBrain200612956458316399806
- WenderothNDebaereFSunaertSSwinnenSPThe role of anterior cingulate cortex and precuneus in the coordination of motor behaviourEur J Neurosci20052223524616029213
- KlimeschWSchimkeHDoppelmayrMRipperBSchwaigerJPfurtschellerGEvent-related desynchronization (ERD) and the Dm effect: does alpha desynchronization during encoding predict late recall performance?Int J Psychophysiol19962447608978435
- KlimeschWDoppelmayrMStadlerWPöllhuberDSausengPRöhmDEpisodic retrieval is reflected by a process specific increase in human electroencephalographic theta activityNeurosci Lett2001302495211278109
- FriesPReynoldsJHRorieAEDesimoneRModulation of oscillatory neuronal synchronization by selective visual attentionScience20012911560156311222864
- KilnerJMMattoutJHensonRFristonKJHemodynamic correlates of EEG: a heuristicNeuroimage20052828028616023377
- WyartVTallon-BaudryCNeural dissociation between visual awareness and spatial attentionJ Neurosci2008282667267918322110
- SpitzerBHanslmayrSOpitzBMecklingerABäumlK-HOscillatory correlates of retrieval-induced forgetting in recognition memoryJ Cogn Neurosci20092197699018702597
- StaudiglTHanslmayrSBäumlK-HTTheta oscillations reflect the dynamics of interference in episodic memory retrievalJ Neurosci201030113561136220739556
- HanslmayrSStaudiglTAslanABäumlK-HTheta oscillations predict the detrimental effects of memory retrievalCogn Affect Behav Neurosci20101032933820805534
- HanslmayrSStaudiglTFellnerMCOscillatory power decreases and long-term memory: the information via desynchronization hypothesisFront Hum Neurosci201267422514527
- JensenOMazaheriAShaping functional architecture by oscillatory alpha activity: gating by inhibitionFront Hum Neurosci2010418610.3389/fnhum.2010.0018621119777
- NormanKAHow hippocampus and cortex contribute to recognition memory: revisiting the complementary learning systems modelHippocampus2010201217122720857486
- SchneidmanEPuchallaJLSegevRHarrisRABialekWBerryMJSynergy from silence in a combinatorial neural codeJ Neurosci201131157321574122049416
- KurimotoRIshiiRCanuetLInduced oscillatory responses during the Sternberg’s visual memory task in patients with Alzheimer’s disease and mild cognitive impairmentNeuroimage2012594132414022047628
- GoardMDanYBasal forebrain activation enhances cortical coding of natural scenesNat Neurosci2009121444144919801988
- ChalkMHerreroJLGieselmannMADelicatoLSGotthardtSThieleAAttention reduces stimulus-driven gamma frequency oscillations and spike field coherence in V1Neuron20106611412520399733
- BarlowHBThe coding of sensory messagesThorpeWHZangwillOLCurrent Problems in Animal BehaviourCambridge, UKCambridge University Press1961331360
- BialekWRiekeFde Ruytervan SteveninckRRWarlandDReading a neural codeScience1991252185418572063199
- HanslmayrSSpitzerBBäumlK-HBrain oscillations dissociate between semantic and non semantic encoding of episodic memoriesCereb Cortex2009191631164019001457
- CraikFIMLevels of processing: past, present and future?Memory20021030531812396643
- MorettiDVPievaniMGeroldiCEEG markers discriminate among different subgroup of patients with mild cognitive impairmentAm J Alzheimers Dis Other Demen2010251587319204371
- MorettiDVFrisoniGBPievaniMBrain vascular damage of cholinergic pathways and E. E. G. markers in mild cognitive impairmentJ Alzheimers Dis200815335737218997289
- MorettiDVFrisoniGBBinettiGZanettiOAnatomical substrate and scalp EEG markers are correlated in subjects with cognitive impairment and Alzheimer’s diseaseFront Psychiatry2011115219
- MorettiDVPrestiaAFracassiCVolumetric differences in mapped hippocampal regions correlate with increase of high alpha rhythm in Alzheimer’s diseaseInt J Alzheimers Dis20112011208218
- MorettiDVPaternicòDBinettiGZanettiOFrisoniGBEEG markers are associated to gray matter changes in thalamus and basal ganglia in subjects with mild cognitive impairmentNeuroimage201260148949622166796
- MorettiDVPrestiaAFracassiCBinettiGZanettiOFrisoniGBSpecific EEG changes associated with atrophy of hippocampus in subjects with mild cognitive impairment and Alzheimer’s diseaseInt J Alzheimers Dis2012201225315322506130
- MorettiDVZanettiOBinettiGFrisoniGBQuantitative EEG markers in mild cognitive impairment: degenerative versus vascular brain impairmentInt J Alzheimers Dis2012201291753722900229
- MorettiDVPaternicòDBinettiGZanettiOFrisoniGBAnalysis of grey matter in thalamus and basal ganglia based on EEG alpha3/alpha2 frequency ratio reveals specific changes in subjects with mild cognitive impairmentASN Neuro201247e0010323126239
- MorettiDVPaternico’DBinettiGZanettiOFrisoniGBRelationship between EEG Alpha3/Alpha2 ration and the nuclues accumbens in subjects with mild cognitive impairmentJ Neurol Neurophysiol20134216
- MorettiDVPaternicòDBinettiGZanettiOFrisoniGBTheta/gamma frequency ratio is associated to grey matter changes in basal ganglia in subjects with mild cognitive impairmentJ Radiol Diagn Imaging201311018
- MorettiDVPaternicòDBinettiGZanettiOFrisoniGBTemporo-parietal brain network impairment is related To EEG ALPHA3/ALPHA2 power ratio in prodromal alzheimer’s diseaseJ Neurol Neurophysiol2013416019
- MorettiDVPaternicòDBinettiGZanettiOFrisoniGBEEG upper/low alpha frequency power ratio relates to temporo-parietal brain atrophy and memory performances in mild cognitive impairmentFront Aging Neurosci201356324187540
- MorettiDVPrestiaABinettiGZanettiOFrisoniGBIncrease of theta frequency is associated with reduction in regional cerebral blood flow only in subjects with mild cognitive impairment with higher upper alpha/low alpha EEG frequency power ratioFront Behav Neurosci2013718824367305
- MorettiDVPrestiaABinettiGZanettiOFrisoniGBCorrelation between regional cerebral blood flow and EEG upper/low alpha frequency power ratio in mild cognitive impairmentJ Radiol Diagn Imaging201314959
- MorettiDVPaternicòDBinettiGZanettiOFrisoniGBElectroencephalographic upper/low alpha frequency power ratio relates to cortex thinning in mild cognitive impairmentNeurodegener Dis2014141183024434624