Abstract
Purpose
Currently, there is a number of successfully implemented local hemostatic agents for external bleedings in forms of wound dressings and other topical materials. However, little has been done in the field of intravenous hemostatic agents. Here, we propose a new procedure to fabricate biocompatible protein nanocontainers (NCs) for intravenous injection allowing magneto-controllable delivery and short-term release of the hemostatic agent ε-aminocaproic acid (EACA).
Methods
The nanocontainers were synthesized by the desolvation method from bovine serum albumin (BSA) using methanol without any further crosslinking. Polyethylene glycol (PEG) was used both as a stabilization agent and for size control. Characterization of nanocontainers was performed by the transmission and scanning electron microscopy, dynamic light scattering, X-ray diffraction, and FTIR spectroscopy. Cytotoxicity was estimated using MTT assay. The dopant release from nanocontainers was measured spectrophotometrically using rhodamine B as a model molecule. The specific hemostatic activity was assessed by analyzing clot lysis and formation curve (CloFAL). Moreover, the ability for magneto targeting was estimated using the original flow setup made of a syringe pump and silicon contours.
Results
Fabricated nanocontainers had an average size of 186±24 nm and were constructed from building blocks–nanoparticles with average size ranged from 10 to 20 nm. PEG shell was also observed around nanocontainers with thickness 5–10 nm. NCs were proved to be completely non-cytotoxic even at concentrations up to 8 mg BSA/mL. Uptake capacity was near 36% while release within the first day was 17%. The analysis of the CloFAL curve showed the ability of NCs to inhibit the clot lysis successfully, and the ability of magneto targeting was confirmed under flow conditions.
Conclusion
The ability of synthesized NCs to deliver and release the therapeutic drug, as well as to accumulate at the desired site under the action of the magnetic field was proved experimentally.
Video abstract

Point your SmartPhone at the code above. If you have a QR code reader the video abstract will appear. Or use:
Acknowledgments
The work of Prilepskii A and Schekina A on the synthesis of BSA NCs was supported by Russian Science Foundation Grant 18-73-00119, the work of Vinogradov V on thrombolysis experiments was supported by Russian Science Foundation Grant 16-13-00041. The X-ray powder diffraction studies and IR spectroscopy were performed on Rigaku SmartLab 3 diffractometer and Shimadzu IRTracer-100 spectrometer of the engineering center of the Saint-Petersburg State Technological Institute (Technical University).
Disclosure
The authors report no conflicts of interest in this work.
Supplementary materials
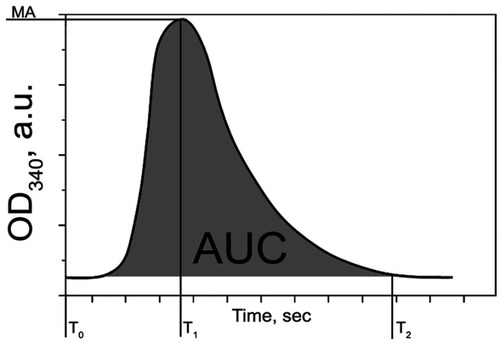
Clot formation and lysis curve
Figure S1 Curve of Clot Formation and Lysis (CloFAL) assay, demonstrating principal CloFAL parameters.
Abbreviation: CloFAL, clot formation and lysis.
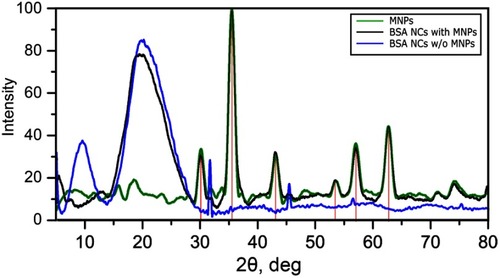
XRD analysis
For XRD analysis nanocontainer samples with and without MNPs was dried at 40°C to prevent thermal denaturation of the protein. XRD spectra are shown in . In the sample with MNPs, we observed a number of characteristics peaks at 2Θ: 30.1°, 35.4°, 43.2°, 53.6°, 57°, 62.6°. The strongest peak was observed for the (3 1 1) reflection at 2Θ: 35.4°. All characteristic peaks are attributed to the JCPDS file No. 19-0629 (X-ray diffraction pattern for Fe3O4 magnetic particles) and completely correspond to peaks on the spectra of pure MNPs. Small extra peaks were observed at 2Θ: 31.6°, 45.2°, which corresponds to traces of NaCl and can be clearly seen on the spectra of BSA NCs without magnetite on . A broad peak was observed around 20°, which corresponds to the amorphous organic phase.
Figure S2 XRD spectra of pure MNPs (green line), BSA NCs with MNPs (black line), and BSA NCs without MNPs. Red lines show references to JCPDS file No. 19-0629 (XRD pattern for magnetite). Peaks attributed to NaCl traces were found in the sample of BSA NCs without MNPs.
Abbreviations: XRD, X-ray diffraction; BSA, bovine serum albumin; NCs, nanoclusters; MNPs, magnetite nanoparticles; JCPDS, The Joint Committee on Powder Diffraction Standards.
FTIR analysis
shows FTIR spectra of BSA NCs with MNPs (black), without MNPs (red), and pure MNPs (green) in the region between 400 and 4000 cm−1. For FTIR analysis NCs samples with and without MNPs was dried at 40°C to prevent thermal denaturation of the protein. On the IR spectra of magnetite nanoparticles, a broad peak is observed in the region of 400–700 cm−1, which is a characteristic peak of metal oxides. The IR spectra of the nanocontainer samples without MNPs reveal characteristic peaks of polypeptide absorbance. Two main absorption bands of amide I (1650 cm−1) and amide II (1510 cm−1) are observed, due to stretching C=O bonds (amide I) and stretching of the C-N bond (amide II) respectively. A clear peak at 1230 cm−1 appears due to mixed C-N stretching and N-H bending vibrations of amino acids. There is also a clear peak at about 3300 cm−1, due to stretching vibrations of the N–H bond. In the case of IR spectra of the nanocontainer samples with MNPs, the position of the peaks, characteristic of polypeptides, is preserved and no significant changes in band positions were observed due to the conjugation of NCs. These facts evidence that MNPs assembled to proteins due to the physical sorption without the formation of new chemical bonds. A peak, corresponded to magnetite in the sample, was observed at a maximum of 560 nm, as for initial (pure) magnetite.
Figure S3 FTIR spectra of BSA NCs with MNPs (black), BSA NCs without MNPs (red), and pure MNPs (green).
Abbreviations: FTIR, fourier-transform infrared spectroscopy; BSA, bovine serum albumin; NCs, nanoclusters; MNPs, magnetite nanoparticles.
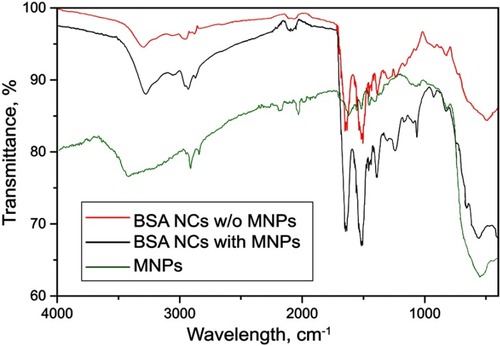
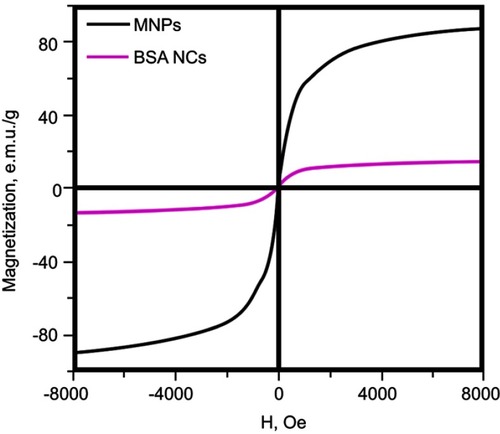
Figure S4 Magnetization curves of MNPs and BSA NCs.
Abbreviations: MNPs, magnetite nanoparticles; BSA, bovine serum albumin; NCs, nanoclusters; MNPs, magnetite nanoparticles.