

Abstract
Obstructive sleep-disordered breathing (SDB), which includes primary snoring through to obstructive sleep apnea syndrome (OSAS), may cause compromise of respiratory gas exchange during sleep, related to transient upper airway narrowing disrupting ventilation, and causing oxyhemoglobin desaturation and poor sleep quality. SDB is common in chronic disorders and has significant implications for health. With prevalence rates globally increasing, this condition is causing a substantial burden on health care costs. Certain populations, including people with sickle cell disease (SCD), exhibit a greater prevalence of OSAS. A review of the literature provides the available normal polysomnography and oximetry data for reference and documents the structural upper airway differences between those with and without OSAS, as well as between ethnicities and disease states. There may be differences in craniofacial development due to atypical growth trajectories or extramedullary hematopoiesis in anemias such as SCD. Studies involving MRI of the upper airway illustrated that OSAS populations tend to have a greater amount of lymphoid tissue, smaller airways, and smaller lower facial skeletons from measurements of the mandible and linear mental spine to clivus. Understanding the potential relationship between these anatomical landmarks and OSAS could help to stratify treatments, guiding choice towards those which most effectively resolve the obstruction. OSAS is relatively common in SCD populations, with hypoxia as a key manifestation, and sequelae including increased risk of stroke. Combatting any structural defects with appropriate interventions could reduce hypoxic exposure and consequently reduce the risk of comorbidities in those with SDB, warranting early treatment interventions.
Supplementary materials
Figure S1 (A) Adenoidal measurements. “A” represents distance from A1 point of maximal convexity, along inferior margin of adenoid shadow to line B,drawn along straight part of anterior margin of basiocciput. “A” is measured along line perpendicular from point A1 to its intersection with B. (B) Nasopharyngeal measurement. “N” is distance between C1 posterior superior edge of hard palate, and D1, anteroinferior edge of sphenobasiocciptal synchondrosis. When synchondrosis is not clearly visualised, point D1 can be determined as site of crossing posteroinferior margin of lateral pterygoid plates P and floor of bony nasopharyndx.
Note: Reprinted from Radiographic evaluation of adenoidal size in children: Adenoidal-nasopharyngeal ratio. Am J Roentgenol, Fujioka M, Young LW, Girdany BR, the American Journal of Roentgenology 133(3), Copyright© 1979, American Roentgen Ray Society.Citation52
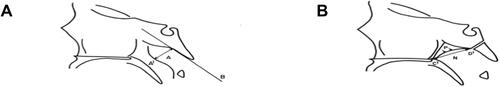
Figure S2 (A) Anatomical outlines of an axial T1 image at the level of the maximal tonsillar area of a control Subject. Transverse black arrow represents the intermandibular distance. (B) Anatomical outlines of a midsagittal T1 image of a control subject. Oblique black arrow represents the mental spine-clivus oblique distance.
Note: Reprinted with permission of the American Thoracic Society. Copyright © 2020 American Thoracic Society. Arens R, McDonough JM, Costarino AT, Mahboubi S, Tayag-Kier CE, Maislin G, et al. 2001. Magnetic resonance imaging of the upper airway structure of children with obstructive sleep apnea syndrome. Am J Respir Crit Care Med. 4. 698–703. Official journal of the American Thoracic Society.Citation47
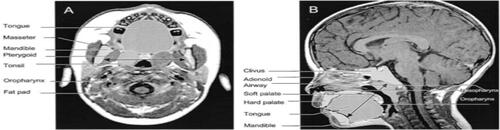
Figure S3 (A) T1-weighted axial image at the retropalated level (right) and segmented regions of interest (left) of a control subject. (B) Midsagittal T1-weighted image with mental spine-clivus distance shown (right) and segmented regions of interest (left) of a control subject.
Note: Reprinted with permission of the American Thoracic Society. Copyright © 2020 American Thoracic Society. Uong EC, McDonough JM, Tayag-Kier CE, Zhao H, Haselgrove J, Mahboubi S, et al. 2001. Magnetic resonance imaging of the upper airway in children with Down syndrome. Am J Respir Crit Care Med. 163. 731–736. Official journal of the American Thoracic Society.Citation73
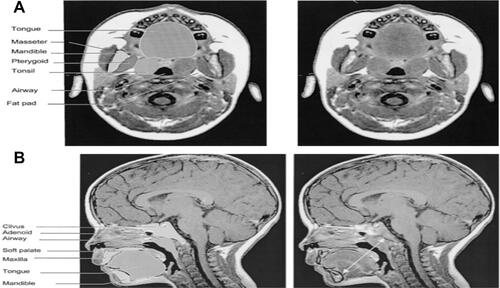
Figure S4 (A) Mid-sagittal T1-weighted image with mental spine-clivus oblique line shown (white line). Linear measurements were obtained along this line. (B) Axial T1-weighted image at the level of maximal tonsillar cross-sectional area. Note the transverse intermandibular line (white line) passing the center of each tonsil. Linear measurements were obtained along this axis. Maximal oropharyngeal width was obtained on this plane (dotted white line).
Note: Reprinted with permission of the American Thoracic Society. Copyright © 2020 American Thoracic Society. Arens R, McDonough JM, Corbin AM, Hernandez ME, Maislin G, Schwab RJ, et al. 2002. Linear dimensions of the upper airway structure during development: Assessment by magnetic resonance imaging. Am J Respir Crit Care Med. 165.117–22. Official journal of the American Thoracic Society.Citation121
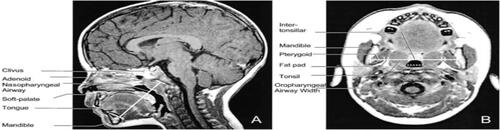
Figure S5 Left: three-dimensional display of an upper airway and its centerline in a subject with OSAS. Top right: gray-level two-dimansional scene of the cross-section of the airway orthogonal to the centerline at marker locations: A = adenoid; A + T = adenoid and tonsil overlap; T = tonsils; E = epiglottis. Bottom right: plot of the cross-sectional area function.
Note: Reprinted with permission of the American Thoracic Society. Copyright © 2020 American Thoracic Society. Arens R, McDonough JM, Corbin AM, Rubin NK, Carroll ME, Pack AI, et al. 2003. Upper airway size analysis by magnetic resonance imaging of children with obstructive sleep apnea syndrome. Am J Respir Crit Care Med. 167. 65–70. Official journal of the American Thoracic Society.Citation48
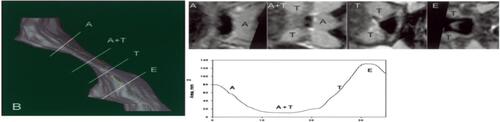
Figure S6 (A) Midsagittal magnetic resonance image (MRI) of a normal subject, demonstrating the upper airway regions: retropalatal (RP) — from the level of the hard palate to the caudal margin of the soft palate; and retroglossal (RG) — from the caudal margin of the soft palate to the base of the epiglottis. Soft palate, tongue, airway, mandible, and subcutaneous fat are denoted with arrows. Fat is bright (white) on an MRI. (B) Representative three dimensional upper airway volume in a patient with sleep apnea (left) and in a normal subject (right). Note that the upper airway volume is smaller in the RP region than in the RG region in both subjects and that the length of the total airway and the individual regions (RP/RG) is not equivalent between the apneic and normal subjects. Airway volume is smaller in the RP region in this apneic subject compared with the control subject; airway volume is similar in the RG region in this apneic subject compared with the control subject.
Note: Reprinted with permission of the American Thoracic Society. Copyright © 2020 American Thoracic Society. Schwab RJ, Pasirstein M, Pierson R, Mackley A, Hachadoorian R, Arens R, et al. 2003. Identification of upper airway anatomic risk factors for obstructive sleep apnea with volumetric magnetic resonance imaging. Am J Respir Crit Care Med. 168. 522–30. Official journal of the American Thoracic Society.Citation51
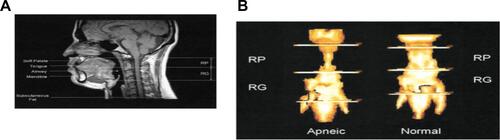
Figure S7 (A) Midsagittal magnetic resonance image demonstrating the four ascending levels for analysis (thick dotted lines). Level 1 is 4 mm above tip of epiglottis. (B) Dynamic changes in cross-sectional area at midtonsillar level (level 2) during tidal breathing (5-vol increments of inspiration [ins], 5-vol increments of expiration [Exp]) of control subjects (top panels) and subjects with OSAS (bottom panels). Note difference in anteroposterior (A-P) and lateral airway dimension.
Note: Reprinted with permission of the American Thoracic Society. Copyright © 2020 American Thoracic Society. Arens R, Sin S, McDonough JM, Palmer JM, Dominguez T, Meyer H, et al. 2005. Changes in upper airway size during tidal breathing in children with obstructive sleep apnea syndrome. Am J Respir Crit Care Med. 171. 1298–304. Official journal of the American Thoracic Society.Citation125
![Figure S7 (A) Midsagittal magnetic resonance image demonstrating the four ascending levels for analysis (thick dotted lines). Level 1 is 4 mm above tip of epiglottis. (B) Dynamic changes in cross-sectional area at midtonsillar level (level 2) during tidal breathing (5-vol increments of inspiration [ins], 5-vol increments of expiration [Exp]) of control subjects (top panels) and subjects with OSAS (bottom panels). Note difference in anteroposterior (A-P) and lateral airway dimension.Note: Reprinted with permission of the American Thoracic Society. Copyright © 2020 American Thoracic Society. Arens R, Sin S, McDonough JM, Palmer JM, Dominguez T, Meyer H, et al. 2005. Changes in upper airway size during tidal breathing in children with obstructive sleep apnea syndrome. Am J Respir Crit Care Med. 171. 1298–304. Official journal of the American Thoracic Society.Citation125](/cms/asset/77cba5aa-7b13-422c-b553-81fd499bb1df/dnss_a_12173981_sf0007_b.jpg)
Figure S8 Volumetric reconstructions from a series of 3-mm contiguous axial magnetic resonance (MR) images of the mandible (gray), tongue (orange/rust), soft palate (pink/purple), lateral parapharyngeal fat pads (yellow), and lateral/posterior pharyngeal walls (green) in a normal subject (top panel) and in a patient with sleep apnea (bottom panel). The upper airway is larger in the normal subject than in the patient with apnea. In addition, the tongue, lateral parapharyngeal fat pads, and lateral pharyngeal walls are larger in the patient with apnea.
Note: Reprinted with permission of the American Thoracic Society. Copyright © 2020 American Thoracic Society. Schwab RJ, Pasirstein M, Kaplan L, Pierson R, Mackley A, Hachadoorian R, et al. 2006. Family aggregation of upper airway soft tissue structures in normal subjects and patients with sleep apnea. Am J Respir Crit Care Med. 173. 453–63. Official journal of the American Thoracic Society.Citation145
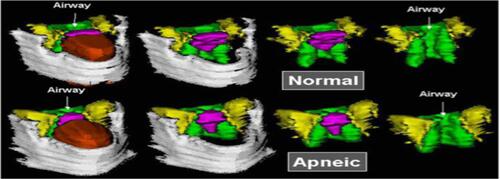
Figure S9 Upper airway, soft tissues, and mandibular reconstructions. Head and neck surface rensering with three-dimensional reconstructions of the upper airway, soft tissues, and mandible of a subject with obstructive sleep apnea syndrome in various views: lateral (top left), anterior oblique (bottom right). Airway (light blue), tongue (brown), mandible (white), nodes (red), and deep cervical nodes (green).
Note: Reprinted with permission of the American Thoracic Society. Copyright © 2020 American Thoracic Society. Arens R, Sin S, Nandalike K, Rieder J, Khan UI, Freeman K, et al. 2011. Upper airway structure and body fat composition in obese children with obstructive sleep apnea syndrome. Am J Respir Crit Care Med. 183. 782–787. Official journal of the American Thoracic Society.Citation49
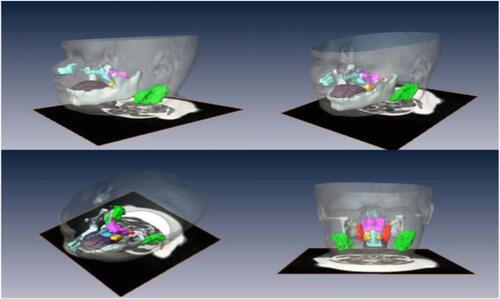
Figure S10 (A) CSA oropharyngeal airway. (B) Combined upper airway volume, T1 weighted axial scan. (C) Transverse line perpendicular to the floor passing through the hyoide to nasion, to sella to supramentale. (D) Midsagittal palatal CSA.
Note: Reprinted from Int J Pediatr Otorhinolaryngol, 77(1), Cappabianca S, Iaselli F, Negro A, et al., Magnetic resonance imaging in the evaluation of anatomical risk factors for pediatric obstructive sleep apnoea-hypopnoea: a pilot study, 69–75, Copyright 2013, with permission from Elsevier.Citation124
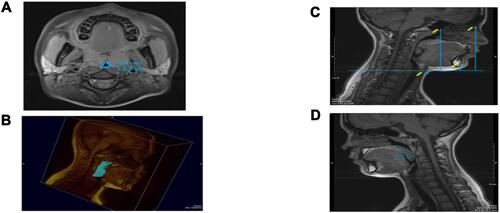
Figure S11 (A) Left 4 images. Mid sagittal (top) and axial T2-weighted images at the level of the nasopharynx (bottom), of a patient before (left) and after (right) adenotonsillectomy. Solid white arrows indicate adenoid tissue (gray) and dotted arrows indicate nasopharyngeal airway.Note residual adenoidal tissue and larger airway after adenoidal tissue and larger airway after adeniodectomy. In this example, a 29% reduction in adenoid volume was noted on MRI. (B) Right 2 images. Axial T2-weighted images at the level of the oropharynx of a patient before (left) and after (right) adenotonsillectomy. Solid white arrows indicate tonsillar tissue (gray) and dotted arrows indicate oropharyngeal airway. Note the larger airway and small left residual tonsil tissue after tonsillectomy.
Note: Reprinted from CHEST, 142(1), Strauss T, Sin S, Marcus CL, Mason TBA, McDonough JM, Allen JL, et al., Upper airway lymphoid tissue size in children with sickle cell disease, 94-100, Copyright 2012, with permission from Elsevier.Citation50
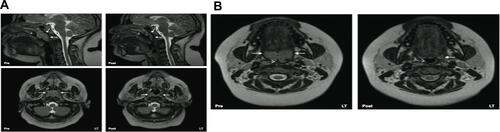
Figure S12 MRI volumetric analysis of lymphoid tissue volumes in an OSA patient (green-upper jugular lymph nodes, orange-tonsil tissue, red-retropharyngeal lymph nodes, magenta-adenoid tissue). (A) Three dimensional reconstruction of lymphoid tissue using Amira® software. (B) Axial T2-weighted DICOM image with lymphoid tissue tracings. (C) Coronal T2-weighted DICOM image with lymphoid tissue tracings. (D) Sagittal T2-weighted DICOM image with lymphoid tissue tracings.
Note: Nandalike K, Shifteh K, Sin S, Strauss T, Stakofsky A, Gonik N et al., Adenotonsillectomy in obese children with obstructive sleep apnoea syndrome: magnetic resonance imaging findings and considerations, SLEEP, 2013, 36, 6, 841-847, by permission of Oxford University Press.Citation146
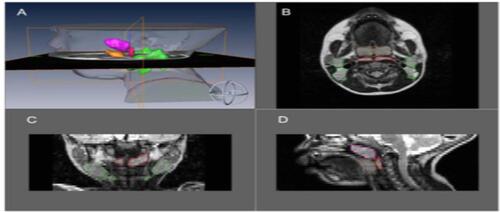
Figure S13 Upper airway, soft tissues, and mandibular reconstructions. Head and neck surface rendering with three-dimensional reconstructions of the upper airway, soft tissues, and mandible of a subject with obstructive sleep apnea syndrome in various views:lateral (top left), anterior oblique (top right), superior oblique (bottom left) and posterior (bottom right). Airway (light blue), tongue (brown), mandible (white), soft palate (blue), tonsils (yellow), adenoid (magenta), retropharyngeal nodes (red), and deep cervical nodes (green).
Note: Copyright ©2003. John Wiley and Sons. Reproduced from Parikh SR, Sadoughi B, Sin S, Willen S, Nandalike K, Arens R. Deep cervical lymph node hypertrophy: A new paradigm in the understanding of pediatric obstructive sleep apnea. Laryngoscope. 2013;123(8):2043–9.Citation123
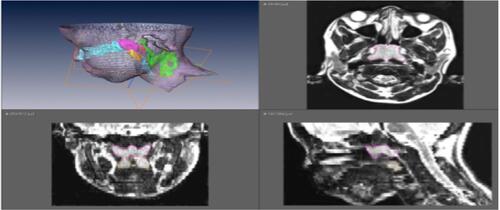
Figure S14 Anatomical definitions of upper airway landmarks on midsaggital and axial slices with 3D reconstruction of regions of interest.
Note: Reprinted with permission of the American Thoracic Society. Copyright © 2020 American Thoracic Society. Schwab RJ, Kim C, Bagchi S, Keenan BT, Comyn FL, Wang S et al. 2015. Understanding the anatomic basis for obstructive sleep apnea syndrome in adolescents. Am J Resp Crit Care Med. 191. 1295-1309. Official journal of the American Thoracic Society.Citation147
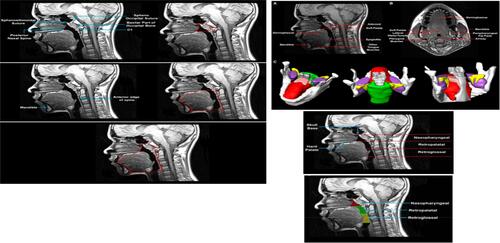
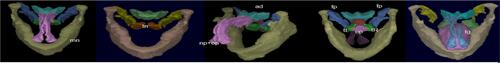
Figure S15 3D surface renditions of objects: np (nasopharynx), op (oropharynx), mn (mandible), tn (tonsils), tL & tR (left and right (tonsil), fp (fat pad), ad (adenoid), tg (tongue).
Note: Copyright ©2016. PLoS One. Reproduced from Capovilla G, Beccaria F, Montagnini A, et al. Tong Y, Udupa JK, Sin S, Liu Z, Wileyto EP, Drew A et al. MR Image Analytics to Characterize the Upper Airway Structure in Obese Children with Obstructive Sleep Apnea Syndrome. PLoS One 2016; 11(8):e0159327.Citation148
Abbreviation list
AN, adenoid to nasopharynx ratio; AASM, American Academy of Sleep Medicine; AHI, Apnea/Hypopnea Index; BiPAP, bi-level positive airway pressure; BMI, body mass index; CAI, central apnea index; CHOP, Children’s hospital of Philadelphia; CPAP, continuous positive airway pressure; CSA, central sleep apnea; CSAS, central sleep apnea syndrome; CT, computed tomography; ECG, electrocardiography; EEG, electroencephalography; EMG, electromyography; EOG, electrooculography; ETpCO2, end-tidal partial pressure carbon dioxide; HbA, normal adult haemoglobin; HbAS, sickle cell trait haemoglobin; HbSS, homozygous sickle cell haemoglobin; MRI, magnetic resonance imaging; NOD, nocturnal oxygen desaturation; Non-REM, non rapid eye movement sleep; OAHI, Obstructive Apnea/Hypopnea Index; OSAS, obstructive sleep apnea syndrome; pCO2, partial pressure carbon dioxide; PSG, polysomnography; RBC, red blood cell; REM, rapid eye movement sleep; RIP, respiratory inductance plethysmography; SAC, sickle Sleep Asthma Cohort study; SaO2, arterial oxygen saturation; SCA, sickle cell anaemia (HbSS); SCD, sickle cell disease (HbSS, HbSC, HbSβthalassemia); SDB, sleep disordered breathing; SpO2, pulse oximetry oxygen saturation.
Acknowledgments
Dr Kirkham’s research is supported by Action Medical Research grant GN2509.
Disclosure
The authors report no conflicts of interest in this work.