
Abstract
Background
Normal sleep is associated with typical physiological changes in both the central and autonomic nervous systems. In particular, nocturnal blood pressure dipping has emerged as a strong marker of normal sleep physiology, whereas the absence of dipping or reverse dipping has been associated with cardiovascular risk. However, nocturnal blood pressure is not measured commonly in clinical practice. Heart rate (HR) dipping in sleep may be a similar important marker and is measured routinely in at-home and in-laboratory sleep testing.
Methods
We performed a retrospective cross-sectional analysis of diagnostic polysomnography in a clinically heterogeneous cohort of n=1047 adults without sleep apnea.
Results
We found that almost half of the cohort showed an increased HR in stable nonrapid eye movement sleep (NREM) compared to wake, while only 13.5% showed a reduced NREM HR of at least 10% relative to wake. The strongest correlates of HR dipping were younger age and male sex, whereas the periodic limb movement index (PLMI), sleep quality, and Epworth Sleepiness Scale (ESS) scores were not correlated with HR dipping. PLMI was however significantly correlated with metrics of impaired HR variability (HRV): increased low-frequency power and reduced high-frequency power. HRV metrics were unrelated to sleep quality or the ESS value. Following the work of Vgontzas et al, we also analyzed the sub-cohort with insomnia symptoms and short objective sleep duration. Interestingly, the sleep–wake stage-specific HR values depended upon insomnia symptoms more than sleep duration.
Conclusion
While our work demonstrates heterogeneity in cardiac metrics (HR and HRV), the population analysis suggests that pathological signatures of HR (nondipping and elevation) are common even in this cohort selected for the absence of sleep apnea. Future prospective work in clinical populations will further inform risk stratification and set the stage for testing interventions.
Introduction
Normal sleep is associated with typical physiological changes of the central nervous system, the standard description of which is sleep staging as defined largely via electroencephalography (EEG) sensors. The autonomic nervous system, typically interrogated via the electrocardiography (ECG) signals, also undergoes marked changes in normal sleep vs wake, in rapid eye movement (REM) sleep vs nonrapid eye movement sleep (NREM) sleep, and in disease states.Citation1–Citation3 However, in clinical practice, the sleep phenotype is described mainly according to the staging, obstructive sleep apnea (OSA) metrics, and periodic limb movements in sleep (PLMS), while the ECG and basic heart rate (HR) data are mainly evaluated manually for evidence of arrhythmia.
Extensive evidence suggests that cardiovascular metrics carry potentially important information about sleep physiology and pathophysiology, as well as systemic cardiovascular risk. For example, the autonomic stability of slow wave NREM sleep has been linked to blood pressure dipping.Citation4,Citation5 The absence of normal nocturnal blood pressure dipping has been implicated in the cardiovascular risk of patients with hypertension (HTN),Citation6 sleep apnea,Citation7,Citation8 normotensive chronic insomnia,Citation9 and sleep fragmentation.Citation10,Citation11 Furthermore, blood pressure nondipping has been associated with increased mortality.Citation12–Citation14 Although routine clinical sleep monitoring does not currently include blood pressure measurement, analysis of cardiac physiology has been extensively performed in hopes of characterizing sleep quality, including HR variability (HRV) and cardiopulmonary coupling.Citation1,Citation2,Citation15
While nocturnal blood pressure monitoring is not standard in polysomnography (PSG) recordings or sleep disorder evaluations, HR and ECG are routinely measured. Certain cardiac metrics may have vascular prognostic value, as well as phenotyping of insomnia,Citation16,Citation17 sleep apnea,Citation18–Citation20 and PLMS.Citation21–Citation23 Drawing a parallel with nocturnal blood pressure dipping, several reports of HR dipping during sleep suggest that lack of dipping is associated with adverse cardiovascular outcomes, including elevated mortality risk over a long-term horizonCitation24–Citation26 and after acute myocardial infarctionCitation27 (although some cohorts only showed increased noncardiovascular mortalityCitation28,Citation29). HRV, likewise, has been associated with adverse cardiovascular outcomes and mortality.Citation30,Citation31 The relationship of HRV metrics with underlying autonomic physiology is often summarized as the high-frequency (HF) component reflecting the respiratory-driven time scale and predominantly parasympathetic influences, while the low-frequency (LF) component reflects a combination of sympathetic and parasympathetic factors.Citation2 However, it has been argued that this is an oversimplified viewCitation32 and also that HRV itself depends strongly on HR.Citation33
We performed a retrospective exploratory study to investigate the relationship of HR and HRV metrics with a variety of clinical features in a large cohort (n=1047 adults without sleep apnea) of clinical PSG data from our center. We specifically excluded OSA because it is well known to cause a multitude of physiological changes, including blunted or reverse blood pressure dipping.Citation8,Citation34 We specifically sought to investigate correlates of PLMS, sleepiness, sleep quality, and misperception. These variables are available in cross-sectional analysis; lacking outcome measures of a longitudinal study, we cannot use the cardiac metrics to test hypotheses related to clinically relevant outcomes currently.
Methods
The Institutional Review Board of the Partners Human Research Committee approved the retrospective analysis of our clinical sleep laboratory database without requiring additional consent (criteria including minimal-risk of the analysis, waiving consent would not compromise the welfare of patients, and the impracticality of the research without waiving consent). Only de-identified data contributed to the analysis. This study involved diagnostic PSGs performed on adults in our clinical sleep laboratory, for any indication; patients undergoing positive airway pressure treatment were not included. Although most referrals to our center are for the evaluation of OSA, this cohort was selected based on the absence of OSA, defined as follows: the apnea–hypopnea index was <5 (using a 4% threshold definition of desaturation of SpO2 for scoring hypopneas) and the respiratory disturbance index (RDI) was <10, where the RDI includes nonhypoxic events that were associated with EEG arousal. Of n=1089 initial PSG extractions, we excluded n=16 for a prespecified minimum total sleep time (TST) of 2 hours and we also excluded a small number with either technical problems with the scoring file (n=20) or because of the presence of a pacemaker (n=6). None of the subjects had atrial fibrillation on manual review. There were no other exclusions applied. The total cohort for analysis is thus n=1047. PSG was performed according to American Academy of Sleep Medicine standards (2007 rules) and scored by experienced registered technologists. PSGs were recorded with the same system (Grass/Twin; Natus Medical Incorporated, Pleasanton, CA, USA), in the time frame of 2009–2015. Single-lead ECG was obtained from location V2 and sampled at 200 Hz.
HR analysis was performed on the signal output of the pulse oximeter, which is a moving average window of detected beats, such that instantaneous changes are smoothed, but overall trends are preserved. The mean HR values using ECG or HR methods were not statistically different in any sleep–wake stage. We used this signal to calculate the slope values for stable blocks of each stage (defined as at least 5 minutes of continuity within any given sleep–wake stage), using custom MATLAB code (The MathWorks Inc, Natick, MA, USA). We excluded unstable bouts (<5 minutes of continuity for any stage) because we reasoned that transitions and the accompanying arousals would be more likely to confound the HR measures with noise related to arousals and movement. The mean HR values for unstable bouts were within ~1 beat per minute (bpm) of the equivalent stable bout means (data not shown). Clock time was not considered (in other words, we combined analysis across all available recordings, typically between 10 pm and 6 am) or were REM–NREM cycles considered separately. Wake bouts were not limited to the sleep onset period; any stable block of wake was accepted for analysis.
The HRV analysis was performed on the single-lead ECG channel from each PSG. The algorithm was implemented in MATLAB. The RR interval from autoidentified QRS complexes yields the beat-to-beat (instantaneous) HR intervals. Missing, ectopic beats, and artifact segments were corrected using a spline cubic interpolation as suggested in the HRV guidelines.Citation35 The resulting R-R intervals were resampled and cubic spline interpolated (signal processing Toolbox for MATLAB). From the single-lead ECG, we analyzed low-frequency power (LF: 0.04–0.15 Hz), high-frequency power (HF: 0.15–0.40 Hz), LF/HF ratio, LF% (the ratio between LF and the sum of LF and HF, expressed as a percentage), and HF% (the ratio between HF and the sum of LF and HF, expressed as a percentage).
Subjective symptoms were collected as a part of routine clinical intake forms (the Epworth Sleepiness Scale [ESS]) and postsleep exit forms administered to all patients undergoing testing (sleep quality score, with values 1–5, corresponding to the terms: poor, fair, average, good, and excellent), and perception of sleep latency (SL) duration and TST duration. For insomnia symptoms, the intake asks about the reason for testing (insomnia is an option), about quantifying sleep onset (we used >30 minutes), and number of awakenings (we used >3), subjective difficulty falling or staying asleep (we used binary “yes” answers). As we have done prior,Citation36–Citation38 since we do not have more detailed clinical phenotyping of the insomnia diagnosis subtypes or severity, we used, as a correlate, the number of positive answers expressed by each individual. This intake form also allowed reporting of medications and comorbidities as check-boxes and free text, respectively. For medications, we performed a spelling correction script (modified in Python from http://norvig.com/spell-correct.html) and manual assignment to categories such as benzodiazepines, antihypertensives, new generation benzodiazepine receptor ligands (z-drugs), and hypnotics (which spanned other categories, such as benzodiazepines and z-drugs, but also included sedating antidepressants such as trazodone and mirtazepine). For each subject, the number of medications present in each category was given, allowing correlation approximations.
For measures of sleep perception, we used our recently described method of separating the latency and TST misperception.Citation39 In this way, misperception of TST is adjusted for sleep occurring during subjective SL to avoid double-counting among those with both onset and total sleep misperception.
The distribution of variables was mainly nonnormal, with only the amount of time in stage N2 (minutes) and the proportion of REM (%) meeting D’Agostino Pearson criteria for normality; for simplicity, we used therefore nonparametric (Mann–Whitney) methods for group-wise statistical testing and we used nonparametric Spearman correlation analysis to explore pair-wise relationships between variables. For comparing proportions, we used the Fisher exact test. Significance was defined by the P-value of <0.05, and due to the exploratory nature of our study, we did not correct for multiple comparisons.
Results
Clinical and PSG correlates of HR
HR changes during clinical PSG are heterogeneous. illustrates the following three clinical PSG examples: 1) a young adult male without OSA or PLMS that shows periods of relatively flat HR and periods of subtle increases in HR during sleep, 2) a middle aged female with PLMS and markedly elevated HR during sleep, and 3) an older female with severe OSA and prominent episodic HR elevations mirroring severe REM-related desaturations. A qualitative review of HR tracings in routine practice suggests that elevations can occur with or without concurrent pathology of movement or respiration and may occur in some portions of the night and not others. This prompted us to examine cardiac patterns in a large cohort from our sleep center database, consisting of n=1047 adults who underwent PSG for any indication; we excluded those with sleep apnea to remove this well-known cause of cardiac fluctuations. reports the clinical features of the cohort, as well as some pertinent subsets.
Figure 1 Examples of HR patterns from clinical PSGs.
Abbreviations: AHI, apnea–hypopnea index; BMI, body mass index; HR, heart rate; NREM, nonrapid eye movement; OSA, obstructive sleep apnea; PLM, periodic limb movements; PLMS, periodic limb movements in sleep; PSG, polysomnography; REM, rapid eye movement; RLS, restless legs syndrome; SDB, sleep-disordered breathing.
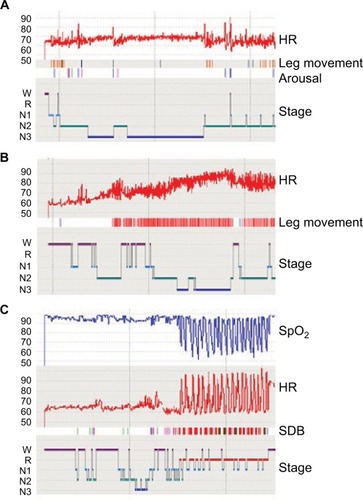
Table 1 Characteristics of the full cohort and clinically defined subsets
We first sought to evaluate the distribution of HR dipping in the cohort. shows the mean HR values observed across stable bouts of sleep–wake stages, which were within ~2 bpm of each other. Small but statistically significant differences are noted for median HR in wake (62.3) vs REM (64.6), vs N1 (63.7), and vs N3 (64.2) but not vs N2 (62.9). To evaluate further these stage-wise comparisons, we next examined the distribution of HR dipping by comparing the mean HR during stable (>5 minutes long) wake bouts and the mean HR during stable NREM stages N2 and N3. Approximately 10% of subjects lacked a stable wake period, and thus the HR dipping analysis was performed on the remaining n=948 subjects. We found that only 13.5% exhibited at least 10% reduction of HR relative to wake; 31.2% show a reduction of at least 5%, and 51.6% show any reduction (). Thus, nearly half of this cohort showed increased HR in stable N2 and N3 compared to wake.
Figure 2 HR analysis across sleep–wake stages.
Abbreviations: HR, heart rate; PSG, polysomnography; REM, rapid eye movement.
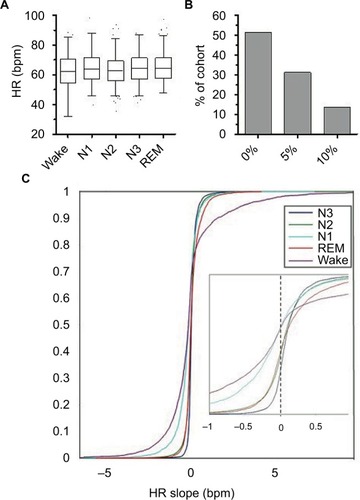
We also analyzed HR reductions at the level of individual bouts, through an approximation based on the slope of the best fit line through the HR time series during stable bouts lasting at least 5 minutes (). In other words, each stable bout of any stage was fitted this way and the resulting slopes (combined across all PSGs) were analyzed for their distribution. illustrates the cumulative distribution of slopes, according to sleep–wake stages. Wake contained the most variability, with relatively large proportions of both increasing and decreasing slope values represented. N3 showed the highest proportion of bouts showing a positive HR slope, of ~70%.
We next performed exploratory analysis to compare those with at least 10% HR dipping to the remainder of the cohort in terms of demographics, PSG metrics, and comorbidities. Using this cutoff, the group with at least 10% HR dipping was associated with younger age (33 vs 45; P<0.001), male sex (55% vs 37%; P<0.001), and lower body mass index (BMI) (25.7 vs 27.3 kg/m2; P<0.05). To further explore sex differences, we analyzed a subset with no medications and no comorbidities (n=146; of whom n=81 males). Waking HR was lower in females than in males (55.8 vs 58.3; P<0.0001), while higher HR was observed in females for all sleep stages (N1: 64.9 vs 60.3, P<0.05; N2: 63.8 vs 58.1, P<0.0001; N3: 65.9 vs 58.5, P<0.0001; REM: 66.2 vs 60.9, P<0.001). Despite these higher HR values, the LH/HF ratio was lower in females (by 10%–20%) in all sleep stages (P<0.05). No sex differences were observed for age, BMI, ESS, TST, periodic limb movement index (PLMI), percent of any sleep–wake stage, or percent change in HR between wake and stable NREM. Of this group, n=124 could be assessed for HR dipping (some did not have stable wake bouts) and n=24 (20.2%) of these showed at least 10% HR dipping in stable NREM sleep, somewhat higher than seen in the full cohort. According to sex, n=9 of the 58 females (15.5%) and n=15 of the 66 males (22.7%) showed at least 10% HR dipping in stable NREM sleep. Any reduction in HR during stable NREM compared to stable was observed in 67.7% (n=84 of 124), again somewhat higher than observed in the full cohort, suggesting that medications, or comorbidities, or both, was contributing to some extent to the HR dipping physiology.
Small but statistically significant differences were noted in sleep architecture, with HR dipping being associated with lower N1% (5.9 vs 7.4; P<0.05), lower N2% (52.3 vs 53.4; P<0.05), higher N3% (19.5 vs 16.9; P<0.05), higher REM% (17.4 vs 15.7; P<0.05), and higher efficiency (86% vs 83%; P<0.05). TST and PLMI were not different according to dipping category. Misperception of TST was more prominent in those with HR dipping (32 minutes underestimation vs 14 minutes; P<0.05). HR dipping had significantly lower proportion of diabetes mellitus (1.6% vs 6.5%; P<0.05) and HTN (12.4% vs 21.0%; P<0.05) but did not differ in the proportion of anxiety, depression, heart failure, coronary disease, chronic obstructive pulmonary disease (COPD, stroke, insomnia symptoms, restless legs syndrome (RLS) symptoms, ESS, or sleep quality. Certain medications were less frequently reported in those with HR dipping, such as opiates, antidepressants, benzodiazepines, anti-HTN, and hypnotics (but not z-drugs in particular), while there were no differences in antihistamine, antidiabetic, or stimulant medications.
Clinical and PSG correlates of spectral cardiac metrics
We next explored frequency measures of HRV, derived from stable bouts (>5 minutes) of each sleep–wake stage, for potential relationships to subjective sleep measures: sleepiness via the ESS; a 5-point sleep quality scale referring to the specific night of the PSG; and the degree of misperception of TST referring to the specific night of the PSG (“Methods” section). shows all correlation values >0.10 (or <−0.1) between HF, LF, or their ratio for either the ESS or the sleep quality metric. Misperception was positively correlated with the LF value in N1, and LF/HF ratio in N1, and negatively correlated with the HF% in stage N1. In addition, we examined potential relationship of HRV frequency metrics with an objective form of sleep disturbance, the PLMI. The PLMI was positively correlated with the N1 and N2 LF/HF ratio and negatively correlated with the percentage of HF in stable N1 and N2.
Table 2 HRV correlations with selected clinical features
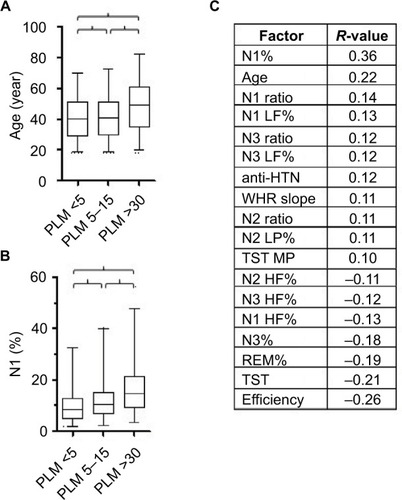
shows the distribution of two strongly associated clinical factors, age, and N1%, across categories of PLMI values. shows the significant correlates for PLMI, spanning clinical, sleep staging, and cardiac metrics. Of the 18 significant factors, 10 factors were related to cardiac function and suggested that PLMI correlated with altered autonomic balance: increased LF power and LF/HF ratio and decreased HF power. There was no relation to antidepressant medication use, or insomnia symptoms, or was there any relation to the ESS value or the sleep quality value.
Figure 3 Clinical, PSG, and cardiac correlates of PLMS.
Abbreviations: HF, high frequency; HR, heart rate; HTN, hypertension; LF, low frequency; MP, misperception; PLM, periodic limb movements; PLMS, periodic limb movements in sleep; PLMI, periodic limb movement index; PSG, polysomnography; REM, rapid eye movement; TST, total sleep time; WHR, wake heart rate.
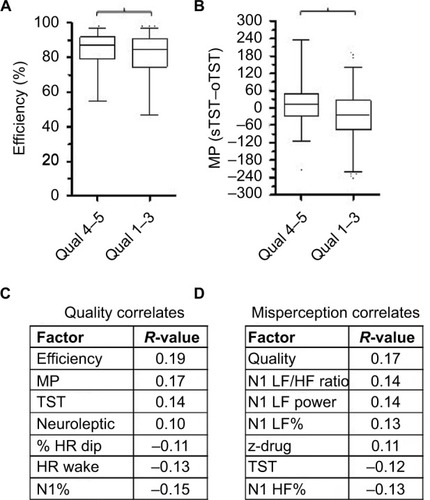
summarizes correlates of sleep quality and sleep misperception. Sleep quality showed fewer correlates than PLMI values, most notably a positive correlation with sleep efficiency () and with TST misperception (). Correlations reaching the prespecified level of at least |0.1| are given in for sleep quality, and for TST misperception values. No HRV values were related to sleep quality, but HR dipping was associated with higher quality, as was lower HR in wake. Misperception of TST was only related to HRV metrics from stage N1, which is the lowest prevalence stage in most of the PSGs. Moreover, the relationship would appear the opposite as expected: increased LF power and LF/HF ratio were correlated with less misperception. However, we previously reported a similarly unexpected finding that misperception was associated with more stable sleep (fewer transitions) based on standard stage scoring.Citation39
Figure 4 Clinical, PSG, and cardiac correlates of sleep quality and of misperception. Notes: (A) Box and whiskers plot showing the distribution of sleep efficiency (%) for prespecified categories of sleep quality. Bracket indicates significance (Mann–Whitney, P<0.003). (B) Box and whiskers plot showing the distribution of misperception of TST (subjective minus objective TST, in minutes) for prespecified categories of sleep quality. Bracket indicates significance (Mann–Whitney, P<0.0001). (C) Correlation coefficients reaching the predefined minimum value of |>0.1|, with the sleep quality value across the cohort. The P-values are all <0.005. (D) Correlation coefficients reaching the predefined minimum value of |>0.1|, with the TST misperception value across the cohort. The P-values are all <0.005.
The ESS score was inversely correlated with age (R=−0.12) insomnia (R=−0.15), and positively correlated with TST (R=0.22) and sleep efficiency (R=0.21; itself correlated with TST) (data not shown).
Finally, we explored the combination of objective TST and insomnia symptoms to parallel the work of Vgontzas et al,Citation40 who suggested that insomnia with objective short TST on PSG testing is the most severe sub-phenotype from a medical and psychiatric risk standpoint. We prespecified categories as follows: objective TST cutoff 5.5 hours, taking a mid-pint between the cutoff values of either 5 or 6 hours used by Vgontzas et al, and the degree of insomnia symptoms as either high or low (“Methods” section). shows different clinical and PSG-derived features that differed significantly between those with >5.5 hours of TST and low insomnia symptoms vs those with <5.5 hours of TST and high insomnia symptoms. focuses on key metrics and includes the two other possible combinations (>5.5 hours TST and high insomnia symptoms and <5.5 hours TST and low insomnia symptoms). Short TST was associated with younger age, regardless of insomnia symptom category. Similarly, short TST was associated with higher N1%, lower REM%, lower sleep efficiency, and higher PLMI, in each case independent of insomnia symptom category. HR values across the five sleep–wake stages showed more subtle and variable differences. For example, wake HR was significantly higher in the short TST with high insomnia group, compared to the long TST with low insomnia group. HR was higher in the high insomnia group for N2 and N3 and REM stage, compared to the low insomnia group, largely independent of TST grouping. In summary, age and PSG metrics were more strongly associated with short TST, while HR changes across stages seemed to track insomnia symptom category more strongly than the TST category. Additional exploratory correlations are given in separately for objective TST and for insomnia symptoms.
Figure 5 Insomnia symptoms and objective TST.
Abbreviations: HR, heart rate; Ins, insomnia; L, long; PLMI, periodic limb movements index; PSG, polysomnography; REM, rapid eye movement; S, short; TST, total sleep time
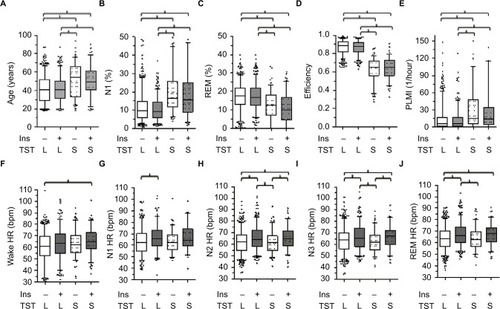
Table 3 Objective short TST with insomnia symptoms
Discussion
Clinical sleep medicine faces competing pressures when pursuing objective evaluations of sleep physiology. On one hand, the allure of personalized medicine based on careful phenotyping is making rapid gains in terms of sleep apnea,Citation41–Citation44 insomnia,Citation40,Citation45 PLMS,Citation22 autonomic dysfunction,Citation46 cardiovascular physiology,Citation1 and sleep fragmentation.Citation47,Citation48 On the other hand, resource shifts toward at-home diagnostics, with limited-channel devices designed for uncomplicated OSA detection,Citation49 are unlikely to directly support improved phenotyping efforts. Efforts to improve in-laboratory PSG-based phenotypingCitation43,Citation50,Citation51 could improve risk stratification and guide care decisions. The information contained in cardiac channels is well suited for implementation via both in-laboratory and at-home diagnostics, as cardiac physiology (either HR or ECG) is present in both clinical recording contexts. The current work describes a large and heterogeneous cohort without sleep apnea, in which the wide range of cardiac physiology illustrates both the challenges and the potential for clinically relevant phenotyping in a practice setting. For example, important patterns such as HR nondipping, and frequency metrics of HRV for autonomic balance, were only weakly correlated at the population level with clinical predictors. This implies that without objective testing, these physiological phenotypes may go largely unrecognized. Given that pathological signatures in the cardiac signals, both routine (HR) and advanced (HRV), are common even in those without OSA, further work is needed to explore mechanistic hypotheses and to bring cardiac phenotyping into a clinical practice that largely overlooks this information in sleep diagnostics. Exploring large datasets, either from clinical sources as we performed or from research registries (such as www.sleepdata.org), can support phenotyping hypothesis testing in sub-groups by age, sex, medications, comorbidities, and if longitudinal follow-up is captured, in clinical outcomes.
HR dipping and HRV correlates in the current study
In this cohort, nearly half of the subjects showed an increase in HR during stable N2 and N3 compared to wake. Younger age and male sex were most strongly correlated with HR dipping. Diabetes and HTN were the comorbidities linked to nondipping HR. Interestingly, the PLMS values were not related to HR dipping, which ran counter to our prediction that elevated PLMS would cause more consistent HR elevations.Citation22,Citation23,Citation52,Citation53 Further analysis of event-linked HR transients may shed light on whether individual heterogeneity blurred correlations at the group level. Medications and/or comorbidities may explain some of the HR nondipping patterns, as a subset with no medications or comorbidities showed more common HR dipping.
We found no relationship between the ESS value and HR or HRV measurements; previous studies in other populations also found little relation.Citation54,Citation55 Sleep quality scores, referring to the night of PSG specifically, showed only very small correlations, being inversely related to the mean HR in wake (R=−0.13) and the percentage HR dipping (R=−0.12). The former relation is plausible, if perhaps higher HR during wake reflects a form of hyperarousal that influences the perception of sleep quality. Interestingly, although these correlations were small, they were of a similar magnitude of quality correlations with other metrics such as TST (0.14), sleep efficiency (0.19), and N1% (−0.15). Whether pharmacological or behavioral measures designed to reduce nocturnal HR can improve sleep quality remains an interesting possibility.Citation56,Citation57
Physiological correlates of insomnia and misperception
Although the clinical diagnosis and management of insomnia do not routinely involve objective sleep measurements, extensive work describes the physiology-based sub-phenotypes of insomniaCitation17,Citation58,Citation59 beyond the typical diagnostic heuristics. HRV analysis has shown increased LF and reduced HF power during sleep,Citation60,Citation61,Citation16 consistent with an autonomic facet of the increased arousal model.Citation17 There is some suggestion that the HRV frequency abnormalities are mainly present in those insomnia patients with short objective sleep duration.Citation62 Importantly, work by Vgontzas et al demonstrated the importance of objective sleep duration (defined during PSG), over that of subjective reporting of insomnia, for incident medical and psychiatric morbidities.Citation40,Citation45
Despite extensive work investigating the basis of misperception, the causes remain the subject of discussion.Citation36,Citation39,Citation63 We found that misperception of TST was associated with HR dipping, which runs counter to the prediction that dipping should reflect better sleep quality. TST misperception was only related to HRV frequency metrics derived from stage N1 and, in a manner that suggests more stable cardiac function, was related to greater misperception, which does not support the hypothesis that sympathetic tone contributes to the under-estimation of sleep. These somewhat unexpected relationships could be epiphenomena: if more stable sleep is associated with longer TST, this would allow more opportunity to underestimate.Citation39
Clinical and physiological correlates of PLMS
PLMS is most commonly associated with clinical RLS, but this relationship is asymmetric: most individuals with elevated PLMI values do not have RLS.Citation64 PLMS has been associated with a variety of neuropsychiatricCitation65–Citation76 and systemic disorders, in addition to reports among sleep disorders such as insomnia,Citation77,Citation78 sleep apnea,Citation71,Citation79 and narcolepsy.Citation74 Although much exciting work continues to evolve in regard to the physiology and clinical correlates of PLMS,Citation80,Citation81 perhaps the most important consideration is the association between PLMS and cardiovascular and cerebrovascular outcomes.Citation82–Citation84 This association may be mechanistically related to sympathetic arousalCitation85 and with both nocturnal and daytime HTN.Citation86,Citation87 HRV analysis of adults with PLMS suggests increased LF values and the LF/HF ratio associated with events,Citation53,Citation88 and similar findings were reported in children.Citation89
As we reported previously in a smaller cohort, the clinical prediction of elevated PLMS is challenging, with only modest correlations arising from demographic and clinical history information.Citation79 In the current cohort, PLMI was most strongly predicted by advancing age and use of antihypertensives. Sixteen of the other 18 correlated factors were PSG-derived metrics, most of which were cardiac physiology. No relation was found with antidepressant medications.Citation90 A recent systematic review suggested that the increased PLMS values with certain antidepressants were unlikely to be of clinical importance given the lack of disruption of sleep;Citation91 however, as noted earlier, autonomic “disturbance” is possible even when EEG changes are minimal.
Cardiovascular measures in sleep disorders and cardiovascular risk
Frequency measures of HRV reveal that normal NREM sleep, especially slow wave (N3), is associated with increased HF power and reduced LF power (and lower LF/HF ratio), while the opposite pattern is observed in REM sleep.Citation92–Citation97 Blood pressure and HR reduction are also evident in stable NREM sleep.Citation98 Alterations in these normal patterns, especially blunting of the NREM stability pattern, may occur with a variety of sleep disorders and have been associated with cardiovascular morbidity and mortality.Citation2 OSA is associated with well-described alterations in HRV, with increased LF, reduced HF, and increased LF/HF ratio consistent with the sympathetic overdrive mechanisms of this disorder.Citation99–Citation103
Ben-Dov et alCitation24 reported increased all-cause mortality with HR nondipping in sleep in a large cohort who underwent ambulatory blood pressure monitoring, a somewhat larger effect than for nondipping of blood pressure. In that cohort, HR nondipping was associated with increased age and BMI, female sex, and comorbidities of HTN and diabetes (treated). In another ambulatory blood pressure monitoring cohort, Eguchi et alCitation104 reported nocturnal HR nondipping to be associated with cardiovascular events, but not all-cause mortality. In that cohort, HR nondipping was unrelated to age, sex, BMI, diabetes, or antihypertensive medications. In yet another cohort, cardiovascular risk was increased in those with nocturnal nondipping of both blood pressure and HR.Citation105
These prior studies used daytime measures to define the awake HR, which may result in higher HR values than those obtained during wake from our current study; the awake time was in a recumbent position throughout nocturnal PSG testing. Only about half of the subjects in our cohort showed HR dipping of any degree in sleep compared to wake. Further studies using 24-hour cardiac monitoring, including PSG to identify sleep stages, would better characterize the phenotype of HR dipping relative to daytime-wake physiology. Sleep staging is critical for intermittent cuff studies, as REM sleep and transitional sleep are associated with HR fluctuations, which could add noise to intermittent cuff inflation approaches (every 30 or 60 minutes measurement).
Limitations
This study has several limitations, some of which are addressable in future analysis or prospective study designs. This was a cross-sectional cohort, with only one night of PSG. While this is reflective of current practice standards, night-to-night variability may play in important role in sleep phenotyping. We do not have information regarding circadian rhythm or light exposure of patients coming into the sleep laboratory, each of which could impact cardiac physiology. The medications and comorbidities were self-reported and we do not have corroborating data from the electronic medical record about compliance or dosing, or the duration or severity of comorbidities. Together, these uncertainties contribute noise to our measurements and blur potential associations, which suggest that the strength of the relationships we did identify might be underestimated. In the future, with even larger cohorts, sub-categorizing the data by age, sex, comorbidities, and medications may still allow sufficient sample sizes remaining in each group to support physiological analysis. Most importantly, we do not have outcome information for clinical course, adverse events, or treatment response for these subjects. Future studies of outcomes could be undertaken by matching records of such retrospective cohorts with increasingly available electronic medical information in large hospital systems such as ours.
Supplementary materials
Figure S1 Examples of HR slope assessments from clinical PSGs.
Notes: In (A) and (B), the scored hypnogram is shown above the HR tracing derived from the pulse oximetry signal as visualized through the Grass software. The HR units (Y-axis) are in beats per minute. The color scheme of the stages is the same as in of the main text. Stages are indicated on the Y-axis. Time base is given for an 1 hour increment (and hash marks on the X-axis are 30 minutes apart). For each sleep–wake stage bout of 35 minutes (“stable” bouts), the calculated best fit line is super-imposed on the HR trace (black lines).
Abbreviations: HR, heart rate; PSGs, polysomnography; REM, rapid eye movement; W, wake.
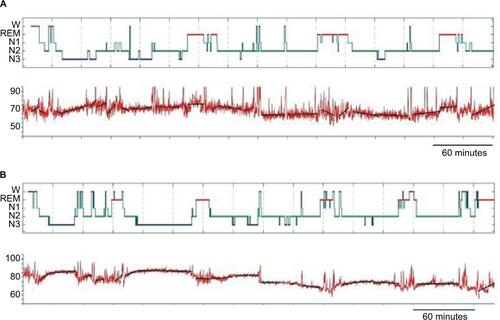
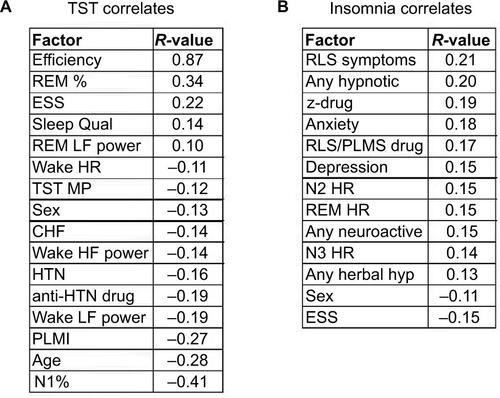
Figure S2 Correlations with TST and with insomnia symptoms.
Notes: (A) Significant correlations above the prespecified minimum of >|0.1| for the PSG-derived TST value. (B) Significant correlations above the prespecified minimum of >|0.1| for insomnia symptoms (“Methods” section).
Abbreviations: CHF, congestive heart failure; ESS, Epworth Sleepiness Scale; HF, high frequency; HR, heart rate; HRV, HR variability; HTN, hypertension; hyp, hypnotic; LF, low frequency; MP, misperception; PLMI, periodic limb movement index; PLMS, periodic limb movements in sleep; PSG, polysomnography; Qual, quality; REM, rapid eye movement; RLS, restless legs syndrome; TST, total sleep time; z-drug, zolpidem, zaleplon, eszopiclone.
Disclosure
MTB has received funding from the Center for Integration of Medicine and Innovative Technology, the Milton Family Foundation, the MGH-MIT Grand Challenge, and the American Sleep Medicine Foundation, and the Department of Neurology. MTB has a patent pending on a home sleep monitoring device, has research agreements with MC10 and Insomnisolv and consulting agreements with McKesson, International Flavors and Fragrances, and Apple Inc., serves as a medical monitor for Pfizer, and has provided expert testimony in sleep medicine. This was not an industry supported study, and none of these entities had any role in the study. The other authors report no conflicts of interest in this work.
References
- PenzelTKantelhardtJWBartschRPModulations of heart rate, ECG, and cardio-respiratory coupling observed in polysomnographyFront Physiol2016746027826247
- SteinPKPuYHeart rate variability, sleep and sleep disordersSleep Med Rev2012161476621658979
- TobaldiniENobiliLStradaSCasaliKRBraghiroliAMontanoNHeart rate variability in normal and pathological sleepFront Physiol2013429424137133
- JavaheriSRedlineSSleep, slow-wave sleep, and blood pressureCurr Hypertens Rep201214544244822846982
- SaykFTeckentrupCBeckerCEffects of selective slow-wave sleep deprivation on nocturnal blood pressure dipping and daytime blood pressure regulationAm J Physiol Regul Integr Comp Physiol20102981R191R19719907004
- SousaFNevesJFerreiraRPoloniaJBastosJM1b.05: in hypertension the change from a non-dipper to a dipper pattern is associated with a better cardiovascular prognosis than the persistence within the non-dipper patternJ Hypertens201533suppl 1e6
- SeifFPatelSRWaliaHKObstructive sleep apnea and diurnal nondipping hemodynamic indices in patients at increased cardiovascular riskJ Hypertens201432226727524351803
- WolfJHeringDNarkiewiczKNon-dipping pattern of hypertension and obstructive sleep apnea syndromeHypertens Res201033986787120818398
- LanfranchiPAPennestriMHFradetteLDumontMMorinCMMontplaisirJNighttime blood pressure in normotensive subjects with chronic insomnia: implications for cardiovascular riskSleep200932676076619544752
- MatthewsKAKamarckTWH HallMBlood pressure dipping and sleep disturbance in African-American and Caucasian men and womenAm J Hypertens200821782683118483473
- CarringtonMJTrinderJBlood pressure and heart rate during continuous experimental sleep fragmentation in healthy adultsSleep200831121701171219090326
- TsioufisCAndrikouIThomopoulosCSyrseloudisDStergiouGStefanadisCIncreased nighttime blood pressure or nondipping profile for prediction of cardiovascular outcomesJ Hum Hypertens201125528129321124340
- RoutledgeFSMcFetridge-DurdleJADeanCRCanadian HypertensionSNight-time blood pressure patterns and target organ damage: a reviewCan J Cardiol200723213213817311119
- Ben-DovIZKarkJDBen-IshayDMeklerJBen-ArieLBursztynMPredictors of all-cause mortality in clinical ambulatory monitoring: unique aspects of blood pressure during sleepHypertension20074961235124117389258
- ThomasRJMietusJEPengCKRelationship between delta power and the electrocardiogram-derived cardiopulmonary spectrogram: possible implications for assessing the effectiveness of sleepSleep Med201415112513124269134
- de ZambottiMCovassinNSarloMDe Min TonaGTrinderJStegagnoLNighttime cardiac sympathetic hyper-activation in young primary insomniacsClin Auton Res2013231495622975984
- BonnetMHArandDLHyperarousal and insomnia: state of the scienceSleep Med Rev201014191519640748
- LurieAHemodynamic and autonomic changes in adults with obstructive sleep apneaAdv Cardiol20114617119522005192
- NarkiewiczKSomersVKCardiovascular variability characteristics in obstructive sleep apneaAuton Neurosci2001901–2899411485297
- ThomasRJMietusJEPengCKDifferentiating obstructive from central and complex sleep apnea using an automated electrocardiogram-based methodSleep200730121756176918246985
- GottliebDJSomersVKPunjabiNMWinkelmanJWRestless legs syndrome and cardiovascular disease: a research roadmapSleep Med201731101728065687
- NannapaneniSRamarKPeriodic limb movements during sleep and their effect on the cardiovascular system: is there a final answer?Sleep Med201415437938424656911
- AllenaMCampusCMorroneEPeriodic limb movements both in non-REM and REM sleep: relationships between cerebral and autonomic activitiesClin Neurophysiol200912071282129019505849
- Ben-DovIZKarkJDBen-IshayDMeklerJBen-ArieLBursztynMBlunted heart rate dip during sleep and all-cause mortalityArch Intern Med2007167192116212117954807
- JohansenCDOlsenRHPedersenLRResting, night-time, and 24 h heart rate as markers of cardiovascular risk in middle-aged and elderly men and women with no apparent heart diseaseEur Heart J201334231732173923306958
- VerdecchiaPSchillaciGBorgioniCAdverse prognostic value of a blunted circadian rhythm of heart rate in essential hypertensionJ Hypertens1998169133513439746121
- CarneyRMSteinmeyerBFreedlandKENocturnal patterns of heart rate and the risk of mortality after acute myocardial infarctionAm Heart J2014168111712524952868
- HozawaAInoueROhkuboTPredictive value of ambulatory heart rate in the Japanese general population: the Ohasama studyJ Hypertens20082681571157618622234
- HansenTWThijsLBoggiaJPrognostic value of ambulatory heart rate revisited in 6928 subjects from 6 populationsHypertension200852222923518574073
- WulsinLRHornPSPerryJLMassaroJMD’AgostinoRBAutonomic imbalance as a predictor of metabolic risks, cardiovascular disease, diabetes, and mortalityJ Clin Endocrinol Metab201510062443244826047073
- TsujiHLarsonMGVendittiFJJrImpact of reduced heart rate variability on risk for cardiac events. The Framingham Heart StudyCirculation19969411285028558941112
- BurrRLInterpretation of normalized spectral heart rate variability indices in sleep research: a critical reviewSleep200730791391917682663
- MonfrediOLyashkovAEJohnsenABBiophysical characterization of the underappreciated and important relationship between heart rate variability and heart rateHypertension20146461334134325225208
- ZieglerMGSleep disorders and the failure to lower nocturnal blood pressureCurr Opin Nephrol Hypertens20031219710212496673
- Heart rate variability: standards of measurement, physiological interpretation and clinical use. Task Force of the European Society of Cardiology and the North American Society of Pacing and ElectrophysiologyCirculation1996935104310658598068
- CastilloJGoparajuBBianchiMTSleep–wake misperception in sleep apnea patients undergoing diagnostic versus titration polysomnographyJ Psychosom Res201476536136724745776
- BianchiMTWilliamsKLMcKinneySEllenbogenJMThe subjective-objective mismatch in sleep perception among those with insomnia and sleep apneaJ Sleep Res201322555756823521019
- AlameddineYEllenbogenJMBianchiMTSleep–wake time perception varies by direct or indirect queryJ Clin Sleep Med201511212312925406269
- SalineAGoparajuBBianchiMTSleep fragmentation does not explain misperception of latency or total sleep timeJ Clin Sleep Med20161291245125527250816
- VgontzasANFernandez-MendozaJLiaoDBixlerEOInsomnia with objective short sleep duration: the most biologically severe phenotype of the disorderSleep Med Rev201317424125423419741
- ZinchukAVGentryMJConcatoJYaggiHKPhenotypes in obstructive sleep apnea: a definition, examples and evolution of approachesSleep Med Rev20173511312327815038
- TerrillPIEdwardsBANematiSQuantifying the ventilatory control contribution to sleep apnoea using polysomnographyEur Respir J201545240841825323235
- BudhirajaRThomasRKimMRedlineSThe role of big data in the management of sleep-disordered breathingSleep Med Clin201611224125527236060
- BianchiMTThomasRJTechnical advances in the characterization of the complexity of sleep and sleep disordersProg Neuropsychopharmacol Biol Psychiatry20134527728623174482
- Fernandez-MendozaJSheaSVgontzasANCalhounSLLiaoDBixlerEOInsomnia and incident depression: role of objective sleep duration and natural historyJ Sleep Res201524439039825728794
- MiglisMGAutonomic dysfunction in primary sleep disordersSleep Med201619404927198946
- EckertDJYounesMKArousal from sleep: implications for obstructive sleep apnea pathogenesis and treatmentJ Appl Physiol (1985)2014116330231323990246
- BonnetMHDoghramjiKRoehrsTThe scoring of arousal in sleep: reliability, validity, and alternativesJ Clin Sleep Med20073213314517557423
- KapurVKAuckleyDHChowdhuriSClinical practice guideline for diagnostic testing for adult obstructive sleep apnea: an American Academy of Sleep Medicine Clinical Practice GuidelineJ Clin Sleep Med201713347950428162150
- BianchiMTRussoKGabbidonHSmithTGoparajuBWestoverMBBig data in sleep medicine: prospects and pitfalls in phenotypingNat Sci Sleep20179112928243157
- RedlineSDeanD3rdSandersMHEntering the era of “big data”: getting our metrics rightSleep201336446546923564993
- SforzaEJuonyCIbanezVTime-dependent variation in cerebral and autonomic activity during periodic leg movements in sleep: implications for arousal mechanismsClin Neurophysiol2002113688389112048047
- GuggisbergAGHessCWMathisJThe significance of the sympathetic nervous system in the pathophysiology of periodic leg movements in sleepSleep200730675576617580597
- WuMNLaiCLLiuCKBasal sympathetic predominance in periodic limb movements in sleep with obstructive sleep apneaJ Sleep Res201524672272926118626
- WeiCYChungTCWuSCChungCFWuWPThe subjective sleep quality and heart rate variability in hemodialysis patientsRen Fail201133210911721332330
- van der ZwanJEde VenteWHuizinkACBogelsSMde BruinEIPhysical activity, mindfulness meditation, or heart rate variability biofeedback for stress reduction: a randomized controlled trialAppl Psychophysiol Biofeedback201540425726826111942
- WoleverRQBobinetKJMcCabeKEffective and viable mind-body stress reduction in the workplace: a randomized controlled trialJ Occup Health Psychol201217224625822352291
- LevensonJCKayDBBuysseDJThe pathophysiology of insomniaChest201514741179119225846534
- BenjaminsJSMiglioratiFDekkerKInsomnia heterogeneity: characteristics to consider for data-driven multivariate subtypingSleep Med Rev201736718129066053
- BonnetMHArandDLHeart rate variability in insomniacs and matched normal sleepersPsychosom Med19986056106159773766
- MaesJVerbraeckenJWillemenMSleep misperception, EEG characteristics and Autonomic Nervous System activity in primary insomnia: a retrospective study on polysomnographic dataInt J Psychophysiol201491316317124177246
- SpiegelhalderKFuchsLLadwigJHeart rate and heart rate variability in subjectively reported insomniaJ Sleep Res2011201 pt 213714520626615
- HarveyAGTangNK(Mis)perception of sleep in insomnia: a puzzle and a resolutionPsychol Bull201213817710121967449
- KaratasMRestless legs syndrome and periodic limb movements during sleep: diagnosis and treatmentNeurologist200713529430117848868
- GannHFeigeBFasihiSvan CalkerDVoderholzerURiemannDPeriodic limb movements during sleep in alcohol dependent patientsEur Arch Psychiatry Clin Neurosci2002252312412912192470
- WinkelmannJPragerMLiebR“Anxietas tibiarum”. Depression and anxiety disorders in patients with restless legs syndromeJ Neurol20052521677115654556
- KimKWYoonIYChungSPrevalence, comorbidities and risk factors of restless legs syndrome in the Korean elderly population – results from the Korean Longitudinal Study on Health and AgingJ Sleep Res2010191 pt 1879219686313
- GuptaRLahanVGoelDA study examining depression in restless legs syndromeAsian J Psychiatr20136430831223810138
- BrandSBeckJHatzingerMHolsboer-TrachslerEPatients suffering from restless legs syndrome have low internal locus of control and poor psychological functioning compared to healthy controlsNeuropsychobiology2013681515823774053
- LeeHBRamseyCMSpiraAPVachonJAllenRMunroCAComparison of cognitive functioning among individuals with treated restless legs syndrome (RLS), untreated RLS, and no RLSJ Neuropsychiatry Clin Neurosci2014261879124515680
- Al-AlawiAMulgrewATenchERyanCFPrevalence, risk factors and impact on daytime sleepiness and hypertension of periodic leg movements with arousals in patients with obstructive sleep apneaJ Clin Sleep Med20062328128717561540
- SaletuBAndererPSaletuMHauerCLindeck-PozzaLSaletu-ZyhlarzGEEG mapping, psychometric, and polysomnographic studies in restless legs syndrome (RLS) and periodic limb movement disorder (PLMD) patients as compared with normal controlsSleep Med20023supplS35S4214592166
- OhayonMMRothTPrevalence of restless legs syndrome and periodic limb movement disorder in the general populationJ Psychosom Res200253154755412127170
- BakerTLGuilleminaultCNino-MurciaGDementWCComparative polysomnographic study of narcolepsy and idiopathic central nervous system hypersomniaSleep198691 pt 22322423704448
- BreslauNRothTBurduvaliEKapkeASchultzLRoehrsTSleep in lifetime posttraumatic stress disorder: a community-based polysomnographic studyArch Gen Psychiatry200461550851615123496
- WetterTCCollado-SeidelVPollmacherTYassouridisATrenkwalderCSleep and periodic leg movement patterns in drug-free patients with Parkinson’s disease and multiple system atrophySleep200023336136710811380
- ColemanRMPollakCPWeitzmanEDPeriodic movements in sleep (nocturnal myoclonus): relation to sleep disordersAnn Neurol1980844164217436384
- KaradenizDOndzeBBessetABilliardMAre periodic leg movements during sleep (PLMS) responsible for sleep disruption in insomnia patients?Eur J Neurol20007333133610886318
- MoroMGoparajuBCastilloJAlameddineYBianchiMTPeriodic limb movements of sleep: empirical and theoretical evidence supporting objective at-home monitoringNat Sci Sleep2016827728927540316
- HornyakMFeigeBRiemannDVoderholzerUPeriodic leg movements in sleep and periodic limb movement disorder: prevalence, clinical significance and treatmentSleep Med Rev200610316917716762807
- FerriRKooBBPicchiettiDLFuldaSPeriodic leg movements during sleep: phenotype, neurophysiology, and clinical significanceSleep Med201731293828341521
- KooBBBlackwellTAncoli-IsraelSAssociation of incident cardiovascular disease with periodic limb movements during sleep in older men: outcomes of sleep disorders in older men (MrOS) studyCirculation2011124111223123121859975
- WaltersASRyeDBReview of the relationship of restless legs syndrome and periodic limb movements in sleep to hypertension, heart disease, and strokeSleep200932558959719480225
- LindnerAFornadiKLazarASPeriodic limb movements in sleep are associated with stroke and cardiovascular risk factors in patients with renal failureJ Sleep Res201221329730721917047
- WinkelmanJWThe evoked heart rate response to periodic leg movements of sleepSleep199922557558010450592
- Espinar-SierraJVela-BuenoALuque-OteroMPeriodic leg movements in sleep in essential hypertensionPsychiatry Clin Neurosci19975131031079225372
- DeanDAWangRJacobsDRA systematic assessment of the association of polysomnographic indices with blood pressure: the Multi-Ethnic Study of Atherosclerosis (MESA)Sleep201538458759625348124
- SasaiTMatsuuraMInoueYChange in heart rate variability precedes the occurrence of periodic leg movements during sleep: an observational studyBMC Neurol20131313924093585
- WalterLMFosterAMPattersonRRCardiovascular variability during periodic leg movements in sleep in childrenSleep20093281093109919725261
- YangCWhiteDPWinkelmanJWAntidepressants and periodic leg movements of sleepBiol Psychiatry200558651051416005440
- KollaBPMansukhaniMPBostwickJMThe influence of antidepressants on restless legs syndrome and periodic limb movements: a systematic reviewSleep Med Rev Epub2017615
- ThayerJFAhsFFredriksonMSollersJJ3rdWagerTDA meta-analysis of heart rate variability and neuroimaging studies: implications for heart rate variability as a marker of stress and healthNeurosci Biobehav Rev201236274775622178086
- CabidduRCeruttiSViardotGWernerSBianchiAMModulation of the sympatho-vagal balance during sleep: frequency domain study of heart rate variability and respirationFront Physiol201234522416233
- ElsenbruchSHarnishMJOrrWCHeart rate variability during waking and sleep in healthy males and femalesSleep19992281067107110617167
- MendezMBianchiAMVillantieriOCeruttiSTime-varying analysis of the heart rate variability during REM and non REM sleep stagesConf Proc IEEE Eng Med Biol Soc200613576357917946573
- BonnetMHArandDLHeart rate variability: sleep stage, time of night, and arousal influencesElectroencephalogr Clin Neurophysiol199710253903969191582
- Van de BornePNguyenHBistonPLinkowskiPDegauteJPEffects of wake and sleep stages on the 24-h autonomic control of blood pressure and heart rate in recumbent menAm J Physiol19942662 pt 2H548H5548141356
- CarringtonMJBarbieriRColrainIMCrowleyKEKimYTrinderJChanges in cardiovascular function during the sleep onset period in young adultsJ Appl Physiol (1985)200598246847615448124
- KesekMFranklinKASahlinCLindbergEHeart rate variability during sleep and sleep apnoea in a population based study of 387 womenClin Physiol Funct Imaging200929430931519453563
- ShiomiTGuilleminaultCSasanabeRHirotaIMaekawaMKobayashiTAugmented very low frequency component of heart rate variability during obstructive sleep apneaSleep19961953703778843527
- SuzukiMGuilleminaultCOtsukaKShiomiTBlood pressure “dipping” and “non-dipping” in obstructive sleep apnea syndrome patientsSleep19961953823878843529
- VanninenETuunainenAKansanenMUusitupaMLansimiesECardiac sympathovagal balance during sleep apnea episodesClin Physiol19961632092168736709
- NarkiewiczKSomersVKSympathetic nerve activity in obstructive sleep apnoeaActa Physiol Scand2003177338539012609010
- EguchiKHoshideSIshikawaJNocturnal nondipping of heart rate predicts cardiovascular events in hypertensive patientsJ Hypertens200927112265227019834343
- KabutoyaTHoshideSIshikawaJEguchiKShimadaKKarioKThe effect of pulse rate and blood pressure dipping status on the risk of stroke and cardiovascular disease in Japanese hypertensive patientsAm J Hypertens201023774975520300073