
Abstract
Purpose
Body-worn accelerometers are commonly used to estimate sleep duration in population-based studies. However, since accelerometry-based sleep/wake-scoring relies on detecting body movements, the prediction of sleep duration remains a challenge. The aim was to develop and evaluate the performance of a machine learning (ML) model to predict accelerometry-based sleep duration and to explore if this prediction can be improved by adding skin temperature data, circadian rhythm based on the estimated midpoint of sleep, and cyclic time features to the model.
Patients and Methods
Twenty-nine adults (17 females), mean (SD) age 40.2 (15.0) years (range 17–70) participated in the study. Overnight polysomnography (PSG) was recorded in a sleep laboratory or at home along with body movement by two accelerometers with an embedded skin temperature sensor (AX3, Axivity, UK) positioned at the low back and thigh. The PSG scoring of sleep/wake was used as ground truth for training the ML model.
Results
Based on pure accelerometer data input to the ML model, the specificity and sensitivity for predicting sleep/wake was 0.52 (SD 0.24) and 0.95 (SD 0.03), respectively. Adding skin temperature data and contextual information to the ML model improved the specificity to 0.72 (SD 0.20), while sensitivity remained unchanged at 0.95 (SD 0.05). Correspondingly, sleep overestimation was reduced from 54 min (228 min, limits of agreement range [LoAR]) to 19 min (154 min LoAR).
Conclusion
An ML model can predict sleep/wake periods with excellent sensitivity and moderate specificity based on a dual-accelerometer set-up when adding skin temperature data and contextual information to the model.
Introduction
Polysomnography (PSG) is the gold standard for sleep measurements but is impractical to implement in large out-of-lab studies.Citation1 As an alternative, body-worn accelerometers are commonly used to estimate sleep duration in population-based studies.Citation2–5 However, since accelerometry-based sleep/wake-scoring relies on detecting body movements, the prediction of sleep duration remains a challenge.Citation6–11
A possible approach to improve accelerometry-based prediction of sleep duration is to utilize information from other modalities related to the sleep/wake states, such as body temperature and sensor-independent features as circadian rhythm and cyclic time features.Citation9,Citation12,Citation13 Core body temperature decreases during sleep accompanied by an increase in distal skin temperature.Citation14,Citation15 Although changes in skin temperature are likely influenced by a range of other factors (eg, room temperature, bed linens, etc.), recordings of skin temperature at different body areas may provide additional information relevant for predicting sleep and wakefulness. Furthermore, utilizing the information embedded in the diurnal cyclic nature of sleepCitation16 and seasonal changes in sleep behavior related to daylight variationsCitation17 may improve the prediction of sleep and wakefulness.
Recent studies have shown that accelerometry recorded on the thigh and low back can be used to accurately predict key daily physical activities and postures using a machine learning (ML) approach.Citation18,Citation19 The aim of the current study was to develop and evaluate the performance of an ML model for predicting sleep/wake periods based on the dual-accelerometer set-up (ie, thigh and low back), and to explore if the prediction of sleep duration can be improved by adding skin temperature data and contextual information to the ML training dataset. To evaluate the performance of the ML model, the predicted sleep/wake scores were compared to sleep/wake scores derived from PSG.
Materials and Methods
Participants and Study Design
The study included 29 participants (12 males, 17 females) with mean (SD) age of 40.2 (15) years (range 17–70 years). Eleven of these were referred to the sleep clinic at St. Olavs University Hospital, Trondheim, Norway, by their general practitioner/medical specialist to undergo a diagnostic evaluation for a possible sleep disorder (ie, obstructive sleep apnea, hypersomnia, or insomnia). The remaining 18 participants were recruited among academic staff/researchers by word of mouth. The study protocol was approved by the Regional Committee for Medical and Health research ethics (reference no. 2015/1748/REK midt), and all participants signed a written informed consent before being enrolled in the study. The study was carried out according to the Declaration of Helsinki.
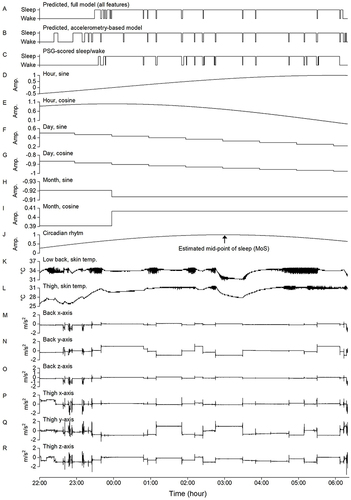
All overnight PSG and accelerometer recordings were performed in a sleep laboratory for the 18 participants without known sleep disorders, whereas the eleven participants with a possible sleep disorder underwent an at-home test. The participants were allowed to sleep based on their habitual sleep time and could use an alarm clock if desired. Upon arrival in the laboratory or at the clinic, the participants were informed about the study protocol. After signing the written informed consent, the participants were equipped with the PSG sensors, including electroencephalography (EEG), right and left electrooculography (EOG), surface electromyography (EMG) on the anterior tibialis, electrocardiography (ECG), airflow (thermistor flow sensor and thoracic and abdominal strain sensors), body position sensor, and oxygen saturation (oximeter attached to the finger), as well as the two three-axial AX3 accelerometers (Axivity Ltd., Newcastle, UK). The accelerometers were attached to the skin at the participants’ lower back, approximately at the third lumbar vertebra, and the upper right thigh, approximately 10 cm above the upper border of the patella. To attach the accelerometer, a 5 × 7 cm moisture permeable film (Opsite Flexifix; Smith & Nephew, Watford, UK) was attached to the skin. The accelerometer was then positioned on top of the film using double-sided tape and covered with a second film layer of 10 × 8 cm. Body accelerations were recorded with a sampling rate of 100 Hz and later downsampled to 50 Hz using the Fourier method.Citation20 The accelerometer and PSG data were synchronized by aligning the PSG movement sensor signal and the accelerometer signals. The PSG recordings were visually scored in 30s epochs by trained personnel following the American Academy of Sleep Medicine (AASM) Manual for the Scoring of Sleep and Associated Events.Citation21 An example of PSG-derived sleep/wake scoring for one participant is shown in along with the accelerometer recordings (M-R). PSG was recorded using SOMNOscreen plus (SOMNOmedics, Germany) and Somnomedics Somno HD (Somnomedics, Germany).
Figure 1 Example from one participant of the predicted sleep/wake based on the full model (A), the predicted sleep/wake based on accelerometry alone (B), the scoring of sleep/wake based on polysomnography (C), the cyclic time features (D-I), the fitted circadian rhythm curve based on the estimated mid-point of sleep (J), the skin temperature (K and L), and the overnight recording of accelerometry (M-R).
Time in bed (TIB) was used as surrogate measure for lights on/lights off and to define the start and the end of the recording period. TIB was defined as the time between the start of the first and the end of the last 10-min period the participant was continuously lying down. These periods were detected using an ML model described in a previous publication.Citation19 The reported sleep duration is therefore the total amount of sleep during TIB, while sleep efficiency was calculated as the percentage being asleep during TIB. We did not provide any specific instructions for the pre-sleep TIB.
Methods to Improve Prediction of Sleep/Wake
In addition to the accelerometer data, we explored additional feature input to the ML model to improve the prediction of sleep/wake, including 1) skin temperature, 2) cyclic time features, and 3) the fitted circadian rhythm curve based on the estimated mid-point of sleep (MoS). Although MoS is not a measure of circadian clock, it is closely correlated to chronotype and circadian rhythm in people with regular sleep.Citation22,Citation23 shows an example of the sleep/wake prediction based on all features (A) and accelerometry only (B).
In addition to the accelerometer, the AX3 includes an embedded temperature sensor that can record temperatures from 0 to 40°C with a resolution of 0.3°C and a sampling frequency of 1.2 Hz. This allowed us to record skin temperature at the position of the two accelerometers at the lower back and thigh. and shows the skin temperature recordings for one participant.
The AX3 stores the date and time of each recorded sample. Based on this information, we created trigonometric representations of a 24 h day to use diurnal time as additional ML model input. A day is therefore represented with a sine and cosine wave, both having a wavelength of 24 h. The sine wave was computed using: , with th being the hour of the time stamp t and tmthe minute. The corresponding cosine wave was computed using:
. Both waves have an amplitude -1 to 1 and 1-min time resolution. In addition to the diurnal time, we considered the day of the week represented with a sine and cosine wave, both with a wavelength of seven days. We computed the waves using the two equations:
,
, with td representing the day and th the hour. Both waves have a 1-h time resolution and amplitude -1 to 1. Finally, we included 12-month trigonometric features as model input by computing a sine and cosine wave, both with a wavelength of one year using:
,
, with tM representing the month and td the day of the month. The trigonometric representations of cyclic time for on participant are illustrated in .
The MoS was estimated based on an initial sleep/wake scoring ML model and thereafter aligning a cosine function with a wavelength of 24 h such that the maximum value of 1 corresponds to the MoS.Citation22 The equation for the estimated circadian rhythm cosine function is , with the current time stamp t, hour of the current time stamp th, minute of the current time stamp tm, estimated MoS μ, hour of the estimated MoS μh, and minute of the estimated MoS μm. shows the estimated MoS and circadian rhythm curve for one participant. To estimate the MoS, we used the sleep/wake predictions of the initial ML model not trained on the estimated circadian rhythm data to determine the sleep-onset and sleep-offset for each participant (see details in section 2.4). A slightly modified version of the definition suggested by Fekedulegn and colleguesCitation24 was used to compute sleep-onset and sleep-offset, ie, sleep-onset was defined as the time point of the first continuous period of at least 20 min of sleep with no more than 1 min of sleep interruption, while sleep-offset was defined as the last minute scored as sleep before a period of at least 2 h of wakefulness. MoS was defined as the midpoint in time between sleep-onset and sleep-offset, ie, computed as
, with μ being the MoS, σon the sleep-onset, and σoff the sleep-offset.Citation25
Machine Learning Classifier
A Support Vector Machine (SVM) classifier was used for the classification task of sleep/wake.Citation26 For a binary classification task like this, the SVM creates a hyperplane in the given d-dimensional feature space that separates training samples according to their class. In doing so, it maximizes the distance between the hyperplane and the nearest samples of each class to ensure generalizability. In case the training data are not linearly separable, the training samples can be transformed into a higher dimensional space (D > d) in which the data might become linearly separable. However, since such a transformation is computationally demanding, the SVM uses a kernel function. This kernel function describes the dot-product of data samples in the D-dimensional space, which can be used to find an optimal hyperplane that separates the training samples in that higher-dimensional space.
Training Procedure
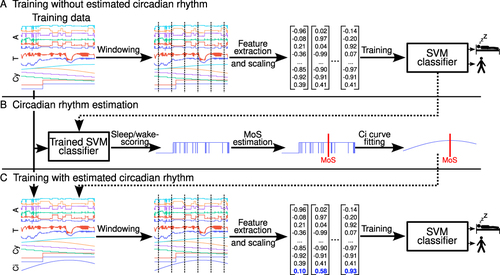
The procedure for training the ML model is illustrated in . The procedure was performed in three steps. The first step was executed when the model was trained without the estimated circadian rhythm curve (). First, the six accelerometer signals, the two temperature signals, the six cyclic time feature signals, and the corresponding training data labels (ie, sleep/wake) were split into non-overlapping 60s windows. For the labels, we computed the majority for each 60s window. Based on the accelerometer signals, a total of 161 statistical features were computed for each 60s window. These include time- and frequency-domain features described in detail in a previous publication.Citation19 For the skin temperature recordings as the low back and thigh, we computed 17 features for each of the two signals separately for each 60s window (ie, mean, coefficient of variation, standard deviation, minimum, maximum, median, 25th percentile, 75th percentile, skew, kurtosis, signal energy, frequency-domain mean, frequency-domain standard deviation, dominant frequency, dominant frequency’s magnitude, total signal power, and spectral centroid). Furthermore, we computed the correlation and mean across the two sensors. This resulted in a total of 36 temperature signal features. No features were computed for the cyclic time features since they were not defined for smaller intervals than 60s. Including the six cyclic time features, the total number of computed features was 203 (ie, 161 accelerometer features + 36 temperature features + 6 cyclic time features). Additionally, we scaled the training data using standardization, such that each feature had a mean of zero and a variance of one. The resulting data was used to train the SVM classifier on the binary classification task of sleep/wake-scoring. These initial predictions of sleep/wake were used to estimate sleep-onset and sleep-offset, and next, to compute the MoS (). In the last step, the fitted circadian rhythm curve was added to the model along with the other features (). Again, a 60s non-overlapping segmentation was applied to each signal. The same feature extraction as in the initial part was applied, resulting in 204 features for each 60s window when the circadian rhythm approximation was added (indicated by the blue vector values in ). Again, the training data was standardized before training the SVM classifier.
Figure 2 The three panels (A-C) illustrate the stepwise procedure used to train the machine learning (ML) model. In the first step (A), the ML model was trained using features derived from accelerometry (A), skin temperature data (T), and cyclic time (Cy). In the second step (B), the initial ML model trained in the first step was used to predict sleep/wake and determine the mid-point of sleep (MoS). A cosine wave with 24 h wavelength and maximum value at the MoS was used for the circadian rhythm curve approximation. In the third step (lower panel), the ML model was trained using all feature input (ie, A, T, Cy, and Ci).
Performance Testing of the Machine Learning Model
The performance of the model was assessed separately for the full dataset (29 participants), the 18 participants without sleep disorders, and the 11 participants with a possible sleep disorder. Furthermore, we explored eight different input strategies, where the SVM received:
The 161 accelerometer-derived features (A)
A and the 36 temperature features (T)
A and the six cyclic time features (Cy)
A and the circadian rhythm estimation (Ci)
A, T, and Cy
A, T, and Ci
A, Cy, and Ci
A, T, Cy, and Ci (ie, all features)
We used a grid search with four-fold cross-validation for hyperparameter optimization to find good hyperparameters for each input strategy. The macro F1-score is used as the primary metric to determine the best hyperparameters, defined as . In contrast to accuracy, the F1-score is more robust against class imbalances in the dataset (ie, the much greater number of sleep epochs as compared to wake). After the hyperparameter optimization, a leave-one-subject-out (LOSO) cross-validation was performed for each input strategy, using the best hyperparameters of the grid searches. In an LOSO cross-validation, the classifier is trained on the data from all participants except one (N-1) which is kept out and used as the test data. This is repeated N times so that each participant is used as a test participant once. The average specificity (true negative rate), average sensitivity (true positive rate), and average F1-score across the N different runs of each LOSO cross-validation are reported to indicate the overall performance of the ML model.
In addition to the overall performance, we investigated which approach to improve the prediction of sleep/wake was most useful for our ML model by performing permutation importance tests. For this, we considered the model incorporating all feature inputs (ie, A, T, Cy, and Ci) as the baseline model. We repeated the LOSO cross-validation three times, each time removing a different modality from the input. Hence, for each of the three LOSOs, we remove one of the modalities: the skin temperature (T), the cyclic time features (Cy), or the circadian rhythm approximation (Ci). We then computed the difference between the resulting performance metric scores and the baseline model scores to measure the influence of each modality on performance. Further, we repeated the three LOSO cross-validations 30 times and present the average change in performance score across these 30 runs. Hence, for the permutation feature importance tests, we performed 120 LOSO cross-validations (30 repetitions × [3 permutations + 1 baseline model]).
We also calculated the individual differences between sleep duration and sleep efficiency derived from PSG versus the predictions from the ML model. The upper and lower 95% limits of agreement were calculated by taking the mean difference ±1.96 ⋅ SD of the differences. These results are presented in Bland-Altman plotsCitation27 using sleep duration and sleep efficiency derived from PSG as the reference method.Citation28
Results
The PSG-derived sleep time (11,909 min) and wake time (3173 min) across participants were used as training data to develop the ML model. The average TIB was 520 min (SD 69), while average PSG-derived sleep time, wake time, and sleep efficiency were 411 min (SD 62), 109 min (SD 69), and 79.5% (SD 11.6), respectively.
shows the absolute difference between the MoS derived from PSG and the MoS predicted by the ML model. Based on only accelerometer data, the absolute difference was 22.5 min (SD 32.9) for the full dataset. This improved to 11.1 min (SD 11.0) when the temperature features and the cyclic time features were added simultaneously as input to the ML model.
Table 1 Absolute Difference (Min) Between the Midpoint of Sleep (MoS) Derived from Polysomnography and the MoS Predicted by the Machine Learning Model Receiving Different Combinations of Feature Input. Values are Mean (SD)
shows the performance of the ML model in predicting sleep/wake periods based on the different combinations of feature input. The sensitivity was high for all feature combinations (eg, 93% or above for the full dataset). In contrast, the specificity increased substantially when features were added to the ML model, eg, for the full dataset the specificity was 52% (SD 24) when only accelerometer data was used as input, increasing to 72% (SD 20) when all features were added as input. Overall, the SDs were considerably higher for specificity than sensitivity across all feature combinations, indicating a considerable inter-individual variation in the predictions of wakefulness. Moreover, the specificity was somewhat higher and the related SDs lower for the participants with a possible sleep disorder compared to the participants without a sleep disorder.
Table 2 The Specificity, Sensitivity, and F1-Score of the Leave-One-Subject-Out Cross-Validations When Using Different Feature Combinations as Input to the Machine Learning Model
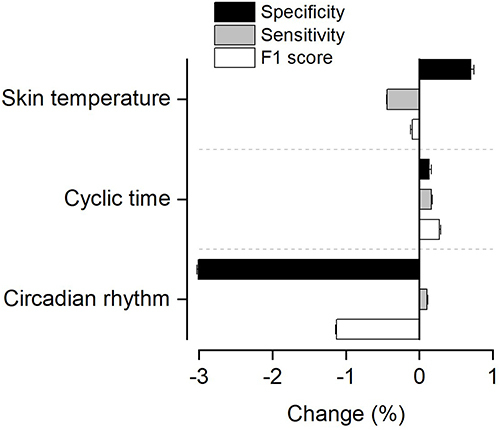
shows the change in performance metrics when removing different feature inputs to the ML model. Removing the circadian rhythm feature caused a reduction of 3.0% in the specificity and 1.1% in the F1-score, respectively. Removing the skin temperature features or cyclic time features had minor influence the performance metrics (ie, 0.7% change or less for any of the performance metrics).
Figure 3 Change in performance metrics when removing different feature modalities (ie, estimated circadian rhythm, skin temperature, or cyclic time) as input to the machine learning model compared to the model receiving all feature inputs. The bars are mean values and the error bars SD.
shows Bland-Altman plots, displaying the individual differences between sleep duration and sleep efficiency derived from PSG versus predicted by the ML model, using accelerometry-derived features (A and C) versus all features (B and D) as input to the ML model. For the accelerometry-based ML model, the average sleep time, wake time and sleep efficiency were 465 (SD 61), 55 (SD 33), and 89.5% (SD 5.6), respectively. The corresponding numbers for the full ML model were 430 (SD 45), 90 (SD 68), and 83.6% (SD 10.1), respectively.
Figure 4 Bland-Altman plots indicating the difference in total sleep time (A and B) and sleep efficiency (C and D) predicted by the machine learning model when including accelerometry-derived features (A and C) and all features (B and D) versus the PSG-scored sleep time. The upper and lower dashed lines indicate the 95% limits of agreement and middle solid line the mean difference. The dotted horizontal line indicates zero (ie, line of equality). The regression line is indicated by the short, dotted line. The error bars on the right side indicate the 95% confidence interval for the limits of agreement and the mean difference.
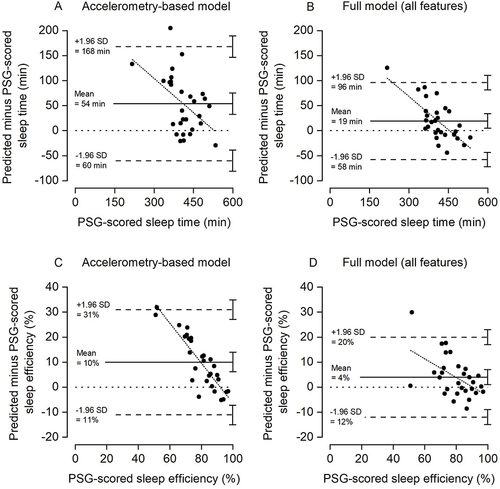
The mean difference between the PSG-derived and predicted sleep duration was 54 min for the accelerometry-based model (A) with limits of agreement range 228 min (−60 min to 168 min). Including all features in the ML model (B) reduced the mean difference between the PSG-derived and predicted sleep duration to 19 min with limits of agreement range 154 min (−58 to 96 min). Correspondingly, the correlation between PSG-scored sleep duration and predicted sleep duration improved from 0.56 to 0.78, respectively. For sleep efficiency, the mean difference was 10% and range of limits of agreement 42% for the accelerometry-based model (C), improving to a mean difference of 4% and range of limits of agreement 32% for the full model (D). The corresponding correlations between PSG-scored sleep efficiency and predicted sleep efficiency were 0.41 for the accelerometry-based model and 0.72 for the full model.
Although the disagreement between the PSG-derived and predicted sleep was reduced in the full model, a significant systematic bias remained between the methods as indicated by the 95% confidence intervals (CIs) of the mean differences (ie, line of equality not included in the CIs). Moreover, the regression lines indicate that the bias between measurement is proportional, ie, the bias tends to be larger for participants with shorter sleep duration and lower sleep efficiency.
Bland-Altman plots, displaying the individual differences between sleep duration and sleep efficiency derived from PSG versus the predictions based on the single thigh or back accelerometer, are presented in Supplementary Figure 1 (sleep duration) and Supplementary Figure 2 (sleep efficiency). The limits of agreement range were somewhat larger when predictions were based on a single accelerometer set-up as compared to a dual accelerometer set-up, both for the accelerometry-based model and the full model. Overall, the performance metrics were similar or somewhat lower when using the single accelerometer set-ups (Supplementary Table 1). For the analysis based on the single thigh accelerometer, the correlations between PSG-scored and predicted sleep duration were 0.50 for the accelerometry-based model and 0.73 for the full model, while for sleep efficiency the correlations were 0.39 and 0.71, respectively. For the analysis based on the single back accelerometer, the corresponding correlations were 0.54 and 0.74 for sleep duration, and 0.36 and 0.64 for sleep efficiency.
Discussion
The current study indicates that an ML model can be trained to predict sleep/wake periods with excellent sensitivity and moderate specificity based on a composite set of features derived from accelerometry on the thigh and low back, skin temperature recordings, and contextual information. Specifically, adding features derived from the skin temperature recordings, cyclic time features, and the fitted circadian rhythm curve, based on the estimated MoS, improved the prediction of wakefulness compared to using only accelerometry-derived features. The improved prediction of wakefulness reduces the common problem of sleep overestimation when relying solely on accelerometry to predict sleep/wake periods. Future studies aiming to improve the assessment of sleep duration based on accelerometry may consider a similar approach as described in the current study. Notably, the training data used to develop and evaluate the current ML model as well as the model itself is publicly available at https://github.com/ntnu-ai-lab/harth-ml-experiments.
Compared to sleep duration predictions derived from PSG, estimates of sleep duration in healthy adults using thigh-, hip-, or trunk-worn accelerometers have exhibited both underestimation (mean values across studies ranging from −32 min to −81 min), as well as overestimation (mean values across studies ranging from 40 min to 54 min).Citation29–32 Moreover, the range of limits of agreement in these studies varied from 180 min to 297 min. In comparison, we found that our ML model overestimated sleep duration by 54 min when including accelerometry-derived features only, which was reduced to 19 min when adding features derived from the skin temperature recordings, cyclic time features, and the fitted circadian rhythm curve as input to the ML model. The corresponding range of limits of agreement was reduced from 228 min (−60 min to 168 min) to 154 min (−58 to 96 min) but as indicated in , a significant systematic bias remained between the two methods. Moreover, as indicated by the regression lines in , the ML-based predictions were more biased for participants with shorter sleep duration and lower sleep efficiency.
The smaller mean difference and range of limits of agreement in the current study compared to previous studies using accelerometry to predict sleep duration is likely explained by our ML approach and the utilization of additional features as input to the ML model. The latter has been suggested to enhance the performance of ML models for sleep/wake-scoring.Citation33 A recent study demonstrated the advantage of an ML approach, showing that a random forest classifier performed consistently better in predicting sleep/wake based on wrist-worn accelerometry compared to commonly used count- or rule-based algorithms.Citation34 Furthermore, the observed F1-score was identical to the F1-score in the current study (ie, 74%) when the sleep/wake prediction was based on accelerometry alone. However, our F1-score increased to 84% when adding the features derived from the skin temperature recordings, cyclic time, and fitted circadian rhythm curve as input to the ML model. Thus, our dual-accelerometer set-up provides comparable results to wrist-worn accelerometry, which is the most common approach for accelerometer-based sleep recordings. Importantly, key daily physical activity types and postures cannot be delineated based on wrist-worn accelerometry. Recently, there has been an increasing focus on the necessity of understanding the inherent interdependence between daily physical activity, sedentary behavior, and sleep across 24 hours.Citation35 Importantly, the dual-accelerometer set-up allows accurate measurement of key physical activity types and postures, such as sitting, lying down, standing, walking, running, and bicycling.Citation18,Citation19 Along with the measurement of sleep, as illustrated in the current study, such data can potentially open new research avenues for understanding how daily physical activity, sedentary behavior, and sleep interact to influence health.
In contrast to a previous systematic review on wrist-worn accelerometry,Citation36 we observed that the sensitivity was similar for the participants without any sleep disorder compared to the participants with a possible sleep disorder. This finding was consistent across all combinations of feature input to the ML model. Moreover, the specificity was somewhat higher among the participants with a possible sleep disorder and the SDs smaller compared to the participants without a sleep disorder. Although speculative, this may indicate that the participants with a possible sleep disorder exhibited increased body movements during awake periods, which are detected by the accelerometers, leading to less overestimation of sleep.
A recent study comparing sleep duration predicted by thigh-worn accelerometry with PSG-derived sleep duration found good sensitivity (0.84) and moderate specificity (0.55). These performance scores were similar to the mean sensitivity (0.89) and specificity (0.53) reported in a systematic review, assessing the agreement between wrist-worn accelerometry and PSG-derived sleep duration.Citation36 In comparison, the sensitivity and specificity scores of our ML model were 0.95 and 0.52, respectively, when including accelerometry-derived features only. When including all feature inputs to the ML model, the sensitivity remained unchanged at 0.95, while specificity improved to 0.72. Thus, the reduced overestimation of sleep and the smaller limits of agreement range for the full model showed in the Bland-Altman plots () is mainly explained by the improved specificity (ie, improved prediction of wakefulness). Notably, excluding skin temperature features as input to the ML model, but including the estimated circadian rhythm and cyclic time features, resulted in specificity of 0.70 and sensitivity 0.94 (). This is relevant since cyclic time and circadian rhythm approximation can be computed based on information readily available in most studies. However, it should be noted that the estimation of MoS as compared to the PSG-derived MoS improved substantially when adding both the cyclic time features and skin temperature as input to the initial ML model. Specifically, the absolute deviation was 16.9 min when including the cyclic time features in addition to accelerometry-derived features as input to the ML model. This was reduced to 11.1 min when skin temperature was included as input to the ML model.
There are several strengths to the current study, including the use of an ML approach and the size and diversity of the training dataset in terms of age range of the participants and presence of sleep problems. However, some limitations should be considered when interpreting the results. First, although the age range of the participants is a strength in terms of creating diversity of the training dataset, it also implies that the data are less likely to be representative for all age categories included. Second, although the sub-sample with a possible sleep disorder contributed to increase the diversity of the training dataset, they do not represent a clinical sample with a confirmed diagnosis. While our results indicate that the ML model performed equally well in predicting sleep/wake periods among the participants with a possible sleep disorder, further investigation is required to evaluate the ML model performance in a representative sample with confirmed diagnosis of a sleep disorder. Third, TIB was used as surrogate measure for the period the participants intended to sleep, commonly indicated by “lights off” and “lights on”. Since TIB may include non-sleep-related activity (eg, reading, texting etc.) our estimates of sleep efficiency could be underestimated.Citation37 Fourth, it may be hypothesized that other ML models can perform better than the SVM used in the current study. In the initial analysis, we explored several ML approaches including k-nearest neighbors, random forest, extreme gradient boost, multi-layer perceptron, and transformer encoder. However, the SVM consistently outperformed the other ML approaches, and we therefore chose to only present the results for the SVM. Finally, all participants had a single well-defined period of sleep and the inclusion of cyclic time features and estimated circadian rhythm improved the performance of our ML model. However, the influence of including these features to predict accelerometry-derived sleep duration among people with less predictable sleep times and/or erratic sleep patterns is unknown and requires further investigation.
Conclusion
An ML model can predict sleep/wake periods with excellent sensitivity and moderate specificity based on a composite set of features derived from accelerometry on the thigh and low back, skin temperature recordings and contextual information. The training data used to develop and evaluate the ML model is publicly available, and the approach outlined in this study may be adopted by future studies aiming to assess sleep duration and sleep efficiency based on accelerometry.
Disclosure
The authors report no conflicts of interest in this work.
Acknowledgments
This study was funded by NTNU Health, Norwegian University of Science and Technology (grant no. 81771516). Eivind Schjelderup Skarpsno is supported by a grant from the Liaison Committee between the Central Norway Regional Health Authority (RHA) and the Norwegian University of Science and Technology (NTNU).
References
- Van de Water AT, Holmes A, Hurley DA. Objective measurements of sleep for non-laboratory settings as alternatives to polysomnography: a systematic review. J Sleep Res. 2011;20(1 Pt 2):183–200. doi:10.1111/j.1365-2869.2009.00814.x
- Willetts M, Hollowell S, Aslett L, Holmes C, Doherty A. Statistical machine learning of sleep and physical activity phenotypes from sensor data in 96,220 UK Biobank participants. Sci Rep. 2018;8(1):7961. doi:10.1038/s41598-018-26174-1
- Su S, Li X, Xu Y, McCall WV, Wang X. Epidemiology of accelerometer-based sleep parameters in US school-aged children and adults: NHANES 2011-2014. Sci Rep. 2022;12(1):7680. doi:10.1038/s41598-022-11848-8
- Albers JD, Meertens RM, Savelberg H, et al. Both short and long sleep durations are associated with type 2 diabetes, independent from traditional lifestyle risk factors-The Maastricht Study. Sleep Health. 2023;9(5):733–741. doi:10.1016/j.sleh.2023.06.009
- de Paula D, Crochemore-Silva I, Griep RH, Duncan BB, Schmidt MI. Accelerometry measured movement behaviors in middle-aged and older adults: cross-sectional analysis of the ELSA-Brasil Study. J Phys Act Health. 2023;1–10. doi:10.1123/jpah.2023-0106
- Sansom K, Reynolds A, McVeigh J, et al. Estimating sleep duration: performance of open-source processing of actigraphy compared to in-laboratory polysomnography in the community. SLEEP Adv. 2023;4(1):zpad028. doi:10.1093/sleepadvances/zpad028
- Plekhanova T, Rowlands AV, Davies MJ, Hall AP, Yates T, Edwardson CL. Validation of an automated sleep detection algorithm using data from multiple accelerometer brands. J Sleep Res. 2023;32(3):e13760. doi:10.1111/jsr.13760
- Chase JD, Busa MA, Staudenmayer JW, Sirard JR. Sleep measurement using wrist-worn accelerometer data compared with polysomnography. Sensors. 2022;22(13):5041. doi:10.3390/s22135041
- Walch O, Huang Y, Forger D, Goldstein C. Sleep stage prediction with raw acceleration and photoplethysmography heart rate data derived from a consumer wearable device. Sleep. 2019;42(12):zsz180. doi:10.1093/sleep/zsz180
- Haghayegh S, Khoshnevis S, Smolensky MH, Diller KR, Castriotta RJ. Performance comparison of different interpretative algorithms utilized to derive sleep parameters from wrist actigraphy data. Chronobiol. Int. 2019;36(12):1752–1760. doi:10.1080/07420528.2019.1679826
- Yuan H, Plekhanova T, Walmsley R, et al. Self-supervised learning of accelerometer data provides new insights for sleep and its association with mortality. medRxiv. 2023. doi:10.1101/2023.07.07.23292251
- Altini M, Kinnunen H. The promise of sleep: a multi-sensor approach for accurate sleep stage detection using the Oura ring. Sensors. 2021;21(13):4302. doi:10.3390/s21134302
- Raymann RJ, Swaab DF, Van Someren EJ. Skin temperature and sleep-onset latency: changes with age and insomnia. Physiol Behav. 2007;90(2–3):257–266. doi:10.1016/j.physbeh.2006.09.008
- Szymusiak R. Body temperature and sleep. Handbook Clin Neurol. 2018;156:341–351. doi:10.1016/b978-0-444-63912-7.00020-5
- Kräuchi K, Cajochen C, Werth E, Wirz-Justice A. Functional link between distal vasodilation and sleep-onset latency? Am J Physiol Regul Integr Comp Physiol. 2000;278(3):R741–8. doi:10.1152/ajpregu.2000.278.3.R741
- Kelly RM, McDermott JH, Coogan AN. Differences in sleep offset timing between weekdays and weekends in 79,161 adult participants in the UK Biobank. Clocks & Sleep. 2022;4(4):658–674. doi:10.3390/clockssleep4040050
- Mattingly SM, Grover T, Martinez GJ, et al. The effects of seasons and weather on sleep patterns measured through longitudinal multimodal sensing. NJP Digit Med. 2021;4(1):76. doi:10.1038/s41746-021-00435-2
- Bach K, Kongsvold A, Bårdstu HB, et al. A machine learning classifier for detection of physical activity types and postures during free-living. J Meas Phys Behav. 2022;5:24–31. doi:10.1123/jmpb.2021-0015
- Logacjov A, Bach K, Kongsvold A, Bårdstu HB, Mork PJ. HARTH: a human activity recognition dataset for machine learning. Sensors. 2021;21(23):7853. doi:10.3390/s21237853
- Oppenheim AV, Schafer RW, Buck JR, Buck JR, Schafer RW. Discrete-time signal processing. In: Prentice-Hall Signal Processing Series. 2nd ed. Prentice Hall; 1999.
- Berry RB, Brooks R, Gamaldo C, et al. AASM Scoring Manual Updates for 2017 (Version 2.4). J Clin Sleep Med. 2017;13(5):665–666. doi:10.5664/jcsm.6576
- Wang H, Wang S, Yu W, Lei X. Consistency of chronotype measurements is affected by sleep quality, gender, longitude, and latitude. Chronobiol Int. 2023;40(7):952–960. doi:10.1080/07420528.2023.2237118
- Zhai Z, Liu X, Zhang H, et al. Associations of midpoint of sleep and night sleep duration with type 2 diabetes mellitus in Chinese rural population: the Henan rural cohort study. BMC Public Health. 2021;21(1):879. doi:10.1186/s12889-021-10833-6
- Fekedulegn D, Andrew ME, Shi M, Violanti JM, Knox S, Innes KE. Actigraphy-based assessment of sleep parameters. Ann. Work Exposures Health. 2020;64(4):350–367. doi:10.1093/annweh/wxaa007
- Refinetti R. Chronotype variability and patterns of light exposure of a large cohort of United States residents. Yale J Biol Med. 2019;92(2):179–186.
- Cortes C, Vapnik V. Support-vector networks. Machine Learning. 1995;20(3):273–297. doi:10.1007/BF00994018
- Bland JM, Altman DG. Measuring agreement in method comparison studies. Statistical Methods Med Res. 1999;8(2):135–160. doi:10.1177/096228029900800204
- Krouwer JS. Why Bland-Altman plots should use X, not (Y+X)/2 when X is a reference method. Stat Med. 2008;27(5):778–780. doi:10.1002/sim.3086
- Johansson PJ, Crowley P, Axelsson J, et al. Development and performance of a sleep estimation algorithm using a single accelerometer placed on the thigh: an evaluation against polysomnography. J Sleep Res. 2023;32(2):e13725. doi:10.1111/jsr.13725
- Zinkhan M, Berger K, Hense S, et al. Agreement of different methods for assessing sleep characteristics: a comparison of two actigraphs, wrist and Hip placement, and self-report with polysomnography. Sleep Medicine. 2014;15(9):1107–1114. doi:10.1016/j.sleep.2014.04.015
- Slater JA, Botsis T, Walsh J, King S, Straker LM, Eastwood PR. Assessing sleep using Hip and wrist actigraphy. Sleep Biol Rhythms. 2015;13(2):172–180. doi:10.1111/sbr.12103
- Matsuo M, Masuda F, Sumi Y, et al. Comparisons of portable sleep monitors of different modalities: potential as naturalistic sleep recorders. Technol Rep Front Neurol. 2016;7:110. doi:10.3389/fneur.2016.00110
- Chao K, Fry B, Rajput KS, Selvaraj N. Influence of study composition on the efficacy of sleep detection using actigraphy. Annu Int Conf IEEE Eng Med Biol Soc. 2021;2021:7530–7534. doi:10.1109/embc46164.2021.9630977
- Sundararajan K, Georgievska S, Te Lindert BHW, et al. Sleep classification from wrist-worn accelerometer data using random forests. Sci Rep. 2021;11(1):24. doi:10.1038/s41598-020-79217-x
- Rosenberger ME, Fulton JE, Buman MP, et al. The 24-hour activity cycle: a new paradigm for physical activity. Med Sci Sports Exerc. 2019;51(3):454–464. doi:10.1249/mss.0000000000001811
- Conley S, Knies A, Batten J, et al. Agreement between actigraphic and polysomnographic measures of sleep in adults with and without chronic conditions: a systematic review and meta-analysis. Sleep Med Rev. 2019;46:151–160. doi:10.1016/j.smrv.2019.05.001
- Reed DL, Sacco WP. Measuring sleep efficiency: what should the denominator be? J Clin Sleep Med. 2016;12(2):263–266. doi:10.5664/jcsm.5498