
Abstract
Purpose
This study adds to the previous work in the field of sport-specific fitness testing by evaluating a tennis-specific agility test called “the 20-yard shuttle test”. The aim of the study was to evaluate the test–retest reliability, the inter-rater reliability, and the criterion-related validity of the 20-yard shuttle test on competitive junior tennis players.
Participants and methods
Totally, 34 Swedish tennis players (13 girls), mean age 14±1.6 years, participated in the study. To examine test–retest reliability, the subjects performed the 20-yard shuttle test three times on the same day and then the same procedure was repeated after 3 days. To test the inter-rater reliability, the time was measured with a stopwatch simultaneously by two different raters. The time recorded manually was compared to the gold standard of digital timing to evaluate the criterion-related validity.
Results
Excellent test–retest reliability was found both within the same day (intraclass correlation coefficient [ICC] 0.95) and between days (ICC 0.91). Furthermore, the results showed excellent inter-rater reliability (ICC 0.99) and criterion-related validity on both test occasions (ICC 0.99).
Conclusion
We have provided introductory support for the 20-yard shuttle test as a reliable and valid test for use in competitive junior tennis players. The ease of administration makes this test a practical alternative to evaluate physical fitness in order to optimally train the athletes.
Introduction
Tennis is a complex sport since it involves technical and tactical skills. Further, it is also a physically demanding sport.Citation1 This complexity requires tennis athletes to have fast reaction times and the ability to perform explosive agility movements. The movement pattern is characterized by quick starts and stops, accelerations, decelerations, and multidirectional movements.Citation2 A study in junior tennis players that compared short straight sprints with agility, including multidirectional running, showed that these are specific qualities that are most of the time unrelated.Citation3 Due to these findings, it is important to train and test tennis players in the specific movement patterns and running distances that are encountered during match play, typically high-intensity work for approximately 4–10 seconds.Citation4
Repetitive multidirectional movement patterns can lead to lower extremity injury.Citation5 Also, acute injuries are common problems in pivoting sports that include cut movements, sudden accelerations, stops and turns, since these can place substantial demands on ankles, knees, and hips.Citation6 Furthermore, it is hypothesized that a nonfunctional movement pattern can predispose for injuries.Citation7 To identify areas of reduced fitness, it is important to conduct a regular physical fitness testing.
The usefulness of a test depends on its reliability or the extent to which a test is consistent and free from error.Citation8 The test also needs to be specific to the demands of the sport that the subject is practicing.Citation9 To the best of our knowledge, there are a restricted number of reliable functional tests for determining physical fitness, especially concerning speed and agility, that exist in the literature. Moreover, these parameters are most often tested in a laboratory setting.Citation10 Compared to functional tests, laboratory measurements are less accessible and also often expensive. Furthermore, these tests are aimed at measuring only one specific parameter, eg, muscle strength. How do the results of these tests represent for physical performance is still not clear.Citation10 Therefore, there is a need for more reliable and valid sports-related functional tests, aiming to test different aspects of physical fitness and athletic performance. Such tests are often inexpensive and easy to perform.Citation10
A physical fitness test that is frequently used by the US Tennis Association to evaluate agility in competitive tennis players is “the spider run test”.Citation11 This test is easy to administer and the movement patterns simulate a lot to the actual movements observed during tennis play. However, the average time to perform the test is approximately 15–17 seconds for junior males and females, which is longer than an average point in tennis.Citation4 The Swedish Tennis Federation has a test battery including flexibility and fitness testing for competitive tennis players aged 12–20 years. According to the results of these tests, training can be individualized, supplemented, or adjusted to optimize performance. The test used to evaluate agility is called “the 20-yard shuttle test”.Citation12 It origins from American football and involves acceleration, deceleration, and multidirectional short distance speed. The time to complete the test is approximately 5–6 seconds. Accordingly, the test resembles the movements in tennis and also reproduces the time frame for the majority of points in match play.
Although the 20-yard shuttle test is frequently used, studies evaluating the reliability of the test are scarce. To our knowledge, only two studies have examined the test–retest reliability using the 20-yard shuttle test, and the tests are performed on athletes mostly involved in different team sports, and test–retest reliability is performed within the same day.Citation13,Citation14 The reliability has not been tested in tennis players. Furthermore, the 20-yard shuttle test is in practice evaluated with a manual stopwatch.Citation12 Studies investigating the criterion-related validity, ie, the manual recording of time compared to the gold standard of digital timing are lacking for this test. Considering the significance of physical fitness testing in tennis players to evaluate and optimize performance and to reduce the risk of injuries, a reliable and valid tennis-specific test is needed. Therefore, the aim of our study was to evaluate the reliability and criterion-related validity of the 20-yard shuttle test in Swedish competitive junior tennis players.
Methods
Participants
A sample of 39 competitive junior tennis players (mean height 164±10.6 cm, mean mass 52.5±10.5 kg, mean age 14±1.6 years) volunteered to participate in the study. All members in two different tennis clubs in Stockholm, Sweden, that met the inclusion criteria were asked to participate in the study by their tennis coach. Inclusion criteria were as follows: boys and girls, aged from 12 to 20 years, regularly competing (a minimum of five tournaments per year), and enrolled in ≥2 tennis training sessions per week. Exclusion criteria were injuries in the lower extremity by the time for the test that preclude maximal performance in terms of speed. Change of shoes from one session to the other was also an exclusion criterion.
From a total of 44 persons who fulfilled the inclusion criteria, 39 took part in the study. The main reason for exclusion was ongoing tournament play. Thirty-four persons participated in both sessions. Descriptive characteristics of the study population are presented in . Most subjects stated that their physical training included training on speed, strength, conditioning, and power. Fourteen subjects were practicing other sports in addition to tennis. The most common sports were soccer, hockey, handball, and golf.
Table 1 Descriptive characteristics of the study population (N=34)
The research protocol was approved by the Regional Ethical Review Board at the University of Gothenburg. A written informed consent was provided prior to the participation in the study. For subjects below 15 years, an informed consent was also provided to their guardians.
Procedures
A pilot study including five subjects was completed prior to the study to ensure the procedure of the test and for the raters to become familiarized with the stopwatch. There was no occasion for retest in the pilot study.
The 20-yard shuttle test was performed indoors on a tennis court. The surface was hard court, since it has been frequently used in various tournaments all over the world. The first test occasion started off by weighing and measuring all the subjects. They were instructed to wear shorts and T-shirt and to take off their shoes. They also answered a questionnaire about their training frequency, number of tournaments they participated in 1 year, and injury history. After this, a standardized warm-up of 10 minutes was performed including jogging, lateral displacements, sprints, and dynamic stretching. The test was performed at the same place and approximately at the same time of the day for both test sessions to avoid the effects of diurnal variation. Participants were asked to refrain from strenuous exercise 24 hours prior to the test and not to consume food, caffeine, or nicotine for 3 hours before the testing session. Participants received thorough standardized instructions on how to practice the test and were given instructions to perform the test as fast as they could. No verbal encouragement was used during the performance.
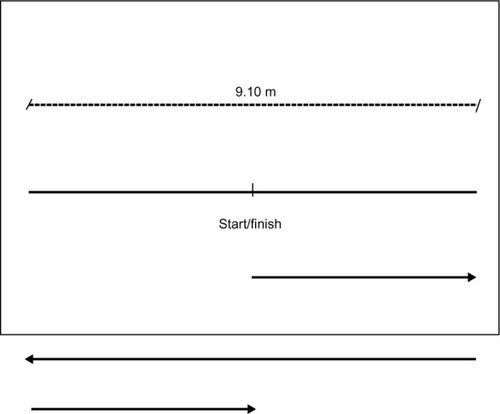
The test was set up in the following manner: Three marker cones were placed along a line 4.55 m apart. The players were instructed to straddle a marked tape (48 cm) behind the middle line, which served as the start/finish line (where the photoelectric barriers were placed), and put one hand down in a three-point stance. On hearing the command “ready, steady, go”, the subject started, and the raters started the stopwatches as soon as they crossed the start line. The subject turned and ran as fast as possible 4.55 m to the right side and touched one foot behind the line. The subject then ran 9.1 m to the left and touched one foot behind the other line and finally finished by running back through the finish line. When the subject crossed the line, the stopwatches, both manually and digitally, were stopped. The test is illustrated in . The duration of each trial was recorded to the nearest 100th of a second. The photoelectric cell timer was automatically activated as the subject crossed the first cell and stopped when the subject crossed the last cell.
Figure 1 A schematic diagram of the 20-yard shuttle test.
Reliability and validity analyses
Test–retest reliability
The test was performed three times, with 5 minutes of rest in between trials, according to the test procedure of the Swedish Tennis Federation. The same procedure was then repeated after 3 days. The same person (a physiotherapist) executed all the tests for both the test sessions. The test leader did not have access to the results obtained from the previous test session.
Inter-rater reliability
During the first test session, a tennis coach was also present to manually keep track of the time along with the physiotherapist. The time required to complete the test was measured simultaneously with a stopwatch by rater 1 and rater 2. The raters started the stopwatches when the subject crossed the start line (and the photoelectric cells) and stopped as the subject crossed the finish line. The two raters were standing on opposite sides of the start line (where the photocells were placed) facing each other. The raters were blinded to the results of one another.
Criterion-related validity
The time recorded manually was compared to the gold standard of digital timing in both test sessions. Time was recorded by the photoelectric cells equipment “IVAR” (Ivar Krause, Tallin, Estland).
Statistical analyses
Data were analyzed by the Statistical Package for the Social Sciences (SPSS 20.0, Chicago, IL, USA). All the study variables were normally distributed. Descriptive measures for continuous data were calculated with mean ± one standard deviation (SD). Categorical variables were described as absolute numbers and proportions. The average intraclass correlation coefficient (ICC 3,3) with a 95% confidence interval (CI) was used to determine analyses within sessions, including test–retest reliability, inter-rater reliability, and criterion-related validity (concurrent validity). To calculate ICC (3,1) for between-session analyses, the best value from each session was used. The ICC varies from 0 to 1, where 1 is considered perfectly reliable. For this study, an ICC greater than 0.75 was considered excellent, from 0.4 to 0.75 was considered fair to good, and less than 0.4 was considered poor.Citation15 A complementary standard error of measurement (SEM) and SEM% were presented in relation to the ICC. Bland–Altman plots were performed to visualize the difference against the mean of best manual and digital test–retest values between sessions.Citation16 An analysis of variance (ANOVA) with repeated measures was performed to test the presence of systematic trends in measurements. The following design was used: SESSION (1,2) × TYPE (digital, manual) × TRIAL (1,2,3). Moreover, inter-rater effects were investigated with another ANOVA with repeated measures using the following design: RATER (1,2) × TRIAL (1,2,3). All tests were two-sided and considered significant if P<0.05.
A sample size calculation for the differences in seconds between test and retest was performed before the start of the study. The power was 0.80 and α-value was 0.05. A medium effect size of 0.5 with a mean difference of 0.2 seconds between test and retest resulted in an SD of difference 0.4 seconds, which generated a sample size of 34 subjects.
Results
Descriptive data from each test session are listed in , including mean times in seconds, minimum and maximum values, and SD from each trial. In addition, the best manual and digital times from each test session are presented.
Table 2 Descriptive data from each test session (N=34)
Test–retest reliability
The results indicated excellent same-day test–retest analyses for manual tests in session 1 (ICC 0.95, 95% CI 0.91–0.97) and session 2 (ICC 0.96, 95% CI 0.92–0.98). Furthermore, the within-session test–retest analyses for digital times showed excellent results in session 1 (ICC 0.95, 95% CI 0.92–0.98) and session 2 (ICC 0.96, 95% CI 0.94–0.98). Moreover, the results showed excellent reliability for the between-sessions test–retest reliability for both the best manual scores (ICC 0.95, 95% CI 0.90–0.97) and the best digital scores (ICC 0.91, 95% CI 0.83–0.96). For more detailed results, see .
Table 3 Test–retest manual and digital measurements: within-session and between-session reliabilities (N=34)
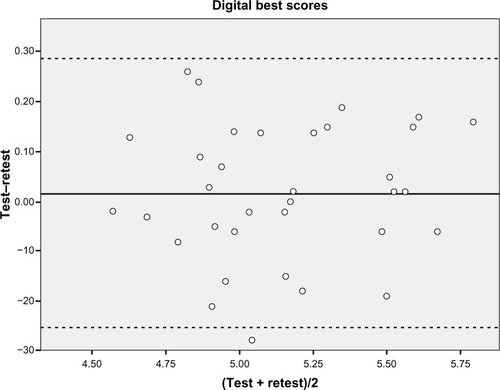
In addition, Bland–Altman plots showed that the mean difference between the best manual () and the best digital test–retest scores between sessions () was close to zero.
Figure 2 Bland–Altman plot showing the difference against the mean of the best manual test–retest values between sessions (n=34), with mean and limits of agreement, including two standard deviations.
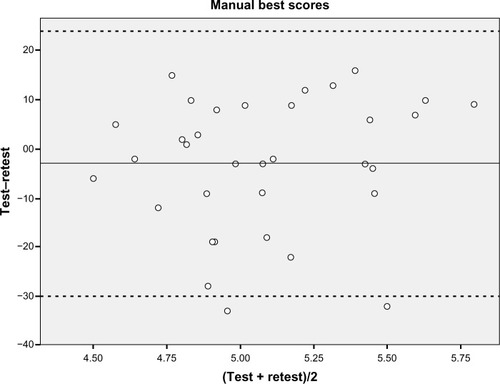
Figure 3 Bland–Altman plot showing the difference against the mean of best digital test–retest values between sessions (n=34), with mean and limits of agreement, including two standard deviations.
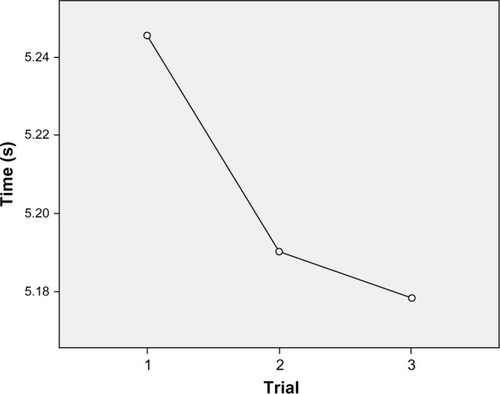
Results from the ANOVA with repeated measures showed statistically significant main effects for TYPE (P<0.001) and TRIAL (P=0.001), and there was a significant interaction effect between SESSION and TYPE (P<0.001). The mean score for digital time was higher compared to manual time (P<0.001). Furthermore, post hoc comparisons showed a significant lower mean time for trial 2 vs 1 (P=0.007) and trial 3 vs 1 (P=0.002) for session 1 (). The interaction effect between SESSION and TYPE showed a significantly (P<0.001) larger difference between digital and manual time for test session 1 compared to test session 2.
Figure 4 Means of measurement of time in trials 1, 2, and 3 (n=34).
Inter-rater reliability
The results showed excellent inter-rater reliability for best values between rater 1 and rater 2 (ICC 0.99, 95% CI 0.98–1.00, SEM 0.06).
Results from the ANOVA with repeated measures showed statistically significant main effects for RATER (P<0.001) and TRIAL (P=0.013). The mean score for rater 1 was lower compared to rater 2.
Criterion-related validity
The results demonstrated an excellent criterion-related validity between manual and digital (gold standard) measurements using best individual values among trials from session 1 (ICC 0.99, 95% CI 0.98–1.00) and session 2 (ICC 0.99, 95% CI 0.99–1.00).
Discussion
Our results support the reliability and the criterion-related validity of the 20-yard shuttle test conducted among competitive junior tennis players. To be relevant to a sport, a fitness test must mimic the demands of that particular sport. Hence, the fitness components that contribute to improvements in performance of that sport should be tested and evaluated.Citation9 These results add to the body of knowledge regarding the usefulness of the 20-yard shuttle test as a test tool in clinical and research practice for junior tennis players.
Test–retest reliability is important in establishing the reproducibility of a test.Citation8 Moreover, the reliability of a test is essential when being utilized to detect the improvements in physical abilities.Citation17 Our results showed that the 20-yard shuttle test is highly reliable both when conducted within the same day and when repeated after 3 days at two different occasions. The test–retest reliability in this study was slightly better than that found in the other two studies for the 20-yard shuttle test on high school-agedCitation14 and college-aged boys and girlsCitation13 involved in different sports. Our highly reliable results could be possibly due to the fact that the subjects in our study were exclusively tennis players who are used to this type of movement patterns in their sport. The subjects in the other two studies were all physically active but in different sports, some of them were involved in gymnastics and some in dance where this type of movement does not occur.Citation13,Citation14 This theory is strengthened by the results of yet another study that evaluated the reliability of other agility tests and also obtained somewhat higher reliability parameters than those obtained by Stewart et alCitation14 and Sekulic et alCitation13 In that study, all the subjects were soccer players who are also used to agility movements in their sport.Citation18
In the present study, a significant difference in time was seen between tests 1 and 2 and between tests 1 and 3 on test day 1. The subjects got progressively better. This was not seen on test day 2. Since most of the subjects had never performed the test prior to this study, it is likely to attribute this difference as learning effects. In a study by Sporis et al,Citation19 reliability was examined for six different soccer-specific agility tests, and the results of the first trial in all the agility tests were the weakest. They recommend at least one maximal practice trial before the actual test. The same results were concluded by another study when interpreting the descriptive statistics data of explosive power tests obtained from students.Citation20 Based on these results, at least one maximal test trial should precede the testing to reduce certain motor learning effects. In our study, there was no test trial prior to the actual test, but three tests were performed by each individual and only their best time was analyzed.
Our results showed excellent inter-rater reliability for best values between rater 1 and rater 2. The raters in our study did participate in a pilot study to get familiarized with the testing protocol and the stopwatch. A study by Vicente-Rodriguez et alCitation21 evaluated the inter-rater reliability of manual timing between trained and untrained raters, for the 4×10 m shuttle test and 30 m running speed tests, and the results showed a significant difference between raters with the trained rater measuring better times. When compared to digital timing (photoelectric cells), greater reliability (smaller systematic error) was observed between the trained rater and the digital timing. These results suggest that raters should be trained and be familiar with how to handle the stopwatch so as to minimize systematic error and to ensure accurate measurements.
Accurate timing in sprinting activities is of interest to athletes, coaches, and scientists. Although the ideal option always would be to use photoelectric cells to record the timing for different field tests, the most commonly used measurement tool is a manual stopwatch because it is easier to administer and a cheaper alternative.Citation21 There is limited research on the validity of handheld stopwatches compared with digital timing in speed and agility testing. The results in our study showed good criterion-related validity, which indicates that physiotherapists and tennis coaches can acceptably measure the 20-yard shuttle test on tennis players using a manual stopwatch. This result is in accordance with the study by Vicente-Rodriguez et alCitation21 which also found considerably small differences between manual timing by a trained rater compared with electronic timing when assessing the speed and agility of adolescents. On the other hand, another study by Mayhew et alCitation22 showed larger variations when studying the difference between manual and electronic timing of the 40-yard dash in college football players. The results showed that manual timing was significantly faster than electronic timing, although the raters were trained. The method used for manual timing was different in this study though. The electronic timing was started when the subject lifted their hand from a switched mat, which is likely to cause a certain reaction time for the raters.Citation22
The 20-yard shuttle test can be used to gain information about a tennis player in order to optimize performance and to reduce injuries. Tennis players need to have enough strength to be able to decelerate the movements of the body with control in order to quickly change direction.Citation23 The faster the player is moving, the bigger load the player will be exposed to. In order to accomplish this, the player must have vast eccentric strength.Citation23 Eccentric strength is also crucial for athletes from an injury prevention standpoint, since a lot of injuries occur during deceleration.Citation24 Furthermore, this test could be used by physiotherapists to detect weaknesses in different physiological parameters, such as muscle strength and balance, in addition to monitoring the development of performance. Dynamic balance, or the ability to keep the center of gravity over the base of support while the body is moving, is an important skill.Citation23 The 20-yard shuttle test is a test that is performed at full speed and is therefore a good complement to other tests that are performed in a controlled setting.
The results need to be considered in relation to the study’s limitations. The author of this study was involved in the timing procedure which may be a potential source of bias. The results can also be discussed in terms of generalization. The subjects varied in ages, years of tennis played, and playing capacity. Our experience from the testing is that there was a larger variation in time between test and retest for the players who were performing weaker and scored poor test results (higher times). Also, we believe that motivation is a crucial factor for maximal performance. It is likely to believe that elite players are more motivated than players of lower level. Therefore, it would be interesting for future research to investigate whether the test–retest reliability varies between groups of elite players vs groups of amateur players.
Conclusion
In conclusion, we have provided introductory support for the 20-yard shuttle test as a reliable and valid test for use in competitive junior tennis players. There is a need for further research to evaluate the usefulness and impact of this test among tennis players, in terms of optimizing performance and reducing injuries.
Acknowledgments
The authors would like to thank Bengt Jansson for statistical advice. This work was supported by the Memorial Foundation at the Swedish Association of Physiotherapists.
Disclosure
The author reports no conflicts of interest in this work.
References
- ReidMSchneikerKStrength and conditioning in tennis: current research and practiceJ Sci Med Sport200811324825617597004
- Llana-BellochSBrizuelaGPerez-SorianoPGarcia-BelenguerACCrespoMSupination control increases performance in sideward cutting movements in tennisSports Biomech2013121384723724607
- LeoneMComtoisATremblayFLegerLSpecificity of running speed and agility in competitive junior tennis playersMed Sci Tennis200611011
- FernandezJMendez-VillanuevaAPluimBMIntensity of tennis match playBr J Sports Med200640538739116632566
- EllenbeckerTSRoetertEPSueyoshiTRiewaldSA descriptive profile of age-specific knee extension flexion strength in elite junior tennis playersBr J Sports Med2007411172873217957008
- PasanenKParkkariJPasanenMNeuromuscular training and the risk of leg injuries in female floorball players: cluster randomised controlled studyBMJ2008337a29518595903
- LehanceCBinetJBuryTCroisierJLMuscular strength, functional performances and injury risk in professional and junior elite soccer playersScand J Med Sci Sports200919224325118384493
- PortneyLGWatkinsMPFoundations of Clinical Research: Applications to PracticeUpper Saddle River, NJPearson Prentice Hall2009
- MullerEBenkoURaschnerCSchwamederHSpecific fitness training and testing in competitive sportsMed Sci Sports Exerc200032121622010647552
- AlricssonMHarms-RingdahlKWernerSReliability of sports related functional tests with emphasis on speed and agility in young athletesScand J Med Sci Sports200111422923211476428
- KovacsMSPritchettRWickwirePJGreenJMBishopPPhysical performance changes after unsupervised training during the autumn/spring semester break in competitive tennis playersBr J Sports Med2007411170571017562748
- KuzmitsFEAdamsAJThe NFL combine: does it predict performance in the National Football League?J Strength Cond Res20082261721172718841077
- SekulicDSpasicMMirkovDCavarMSattlerTGender-specific influences of balance, speed, and power on agility performanceJ Strength Cond Res201327380281122580982
- StewartPFTurnerANMillerSCReliability, factorial validity, and interrelationships of five commonly used change of direction speed testsScand J Med Sci Sports201424350050623176602
- StreinerDLNormanGRHealth Measurement Scales: A Practical Guide to Their Development and UseOxfordOxford University Press2008
- BlandJMAltmanDGStatistical methods for assessing agreement between two methods of clinical measurementLancet1986184763073102868172
- CurrellKJeukendrupAEValidity, reliability and sensitivity of measures of sporting performanceSports Med200838429731618348590
- MirkovDNedeljkovicAKukoljMUgarkovicDJaricSEvaluation of the reliability of soccer-specific field testsJ Strength Cond Res20082241046105018545209
- SporisGJukicIMilanovicLVuceticVReliability and factorial validity of agility tests for soccer playersJ Strength Cond Res201024367968620145571
- MarkovicGDizdarDJukicICardinaleMReliability and factorial validity of squat and countermovement jump testsJ Strength Cond Res200418355155515320660
- Vicente-RodriguezGRey-LopezJPRuizJRInterrater reliability and time measurement validity of speed-agility field tests in adolescentsJ Strength Cond Res20112572059206321499136
- MayhewJLHouserJJBrineyBBWilliamsTBPiperFCBrechueWFComparison between hand and electronic timing of 40-yd dash performance in college football playersJ Strength Cond Res201024244745120072055
- KovacsMSRoetertEPEllenbeckerTSEfficient deceleration: the forgotten factor in tennis-specific trainingJ Strength Cond Res2008305069
- DuganSASports-related knee injuries in female athletes: what gives?Am J Phys Med Rehabil200584212213015668560