Abstract
Objective:
To determine the values of, and study the relationships among, central corneal thickness (CCT), intraocular pressure (IOP), and degree of myopia (DM) in an adult myopic population aged 20 to 40 years in Almeria (southeast Spain). To our knowledge this is first study of this kind in this region.
Methods:
An observational, descriptive, cross-sectional study was done in which a sample of 310 myopic patients (620 eyes) aged 20 to 40 years was selected by gender- and age-stratified sampling, which was proportionally fixed to the size of the population strata for which a 20% prevalence of myopia, 5% epsilon, and a 95% confidence interval were hypothesized. We studied IOP, CCT, and DM and their relationships by calculating the mean, standard deviation, 95% confidence interval for the mean, median, Fisher’s asymmetry coefficient, range (maximum, minimum), and the Brown-Forsythe’s robust test for each variable (IOP, CCT, and DM).
Results:
In the adult myopic population of Almeria aged 20 to 40 years (mean of 29.8), the mean overall CCT was 550.12 μm. The corneas of men were thicker than those of women (P = 0.014). CCT was stable as no significant differences were seen in the 20- to 40-year-old subjects’ CCT values. The mean overall IOP was 13.60 mmHg. Men had a higher IOP than women (P = 0.002). Subjects over 30 years (13.83) had a higher IOP than those under 30 (13.38) (P = 0.04). The mean overall DM was −4.18 diopters. Men had less myopia than women (P < 0.001). Myopia was stable in the 20- to 40-year-old study population (P = 0.089). A linear relationship was found between CCT and IOP (R2 = 0.152, P ≤ 0.001). CCT influenced the IOP value by 15.2%. However no linear relationship between DM and IOP, or between CCT and DM, was found.
Conclusions:
CCT was found to be similar to that reported in other studies in different populations. IOP tends to increase after the age of 30 and is not accounted for by alterations in CCT values.
Introduction
Myopia is one of the most frequent refractive defects in the general population. Its prevalence ranges from 17% to 95% and varies according to age, gender and race.Citation1–Citation3 Knowing the degree of myopia (DM) is useful, when assessing the current status of the myopic population, and providing evidence of growing or diminishing future trends in this refractive state in both the number of patients and the extent of their disability. Such data could be most interesting for studies on nutrition and lifestyle habits, for example to determine the relationships among reading hours, growth, or age of onset of new cases of myopia, and their influence on the DM.
To date, no study has been conducted in our study population to determine the central corneal thickness (CCT), intraocular pressure (IOP), and DM parameters and their relationships, although we know that such studies have been done in other geographical areas.Citation3–Citation10
Establishing these parameters and their relationships is important, because of the potential for CCT to influence intraocular pressure, and thus decision making on glaucoma treatment.Citation4,Citation7,Citation11–Citation14
These parameters are also very important in the field of refractive surgery because CCT and IOP may indicate whether a specific surgical photorefractive keratectomy (PRK), laster-assisted in situ keratomileusis (LASIK) or intraocular lens technique should be applied or not.Citation9,Citation10,Citation15,Citation16
In the future, understanding the influence of drugs on CCT and its biomechanical characteristics, may also affect the choice of the most suitable pharmacological products for each patient.Citation17,Citation18
Bearing all this in mind, we believe that it is important to understand these population values and the possible relationships among them.
Methods
A cross-sectional, descriptive, and observational study was designed in which a sample was selected by gender- and age-stratified sampling, which was proportionally fixed to the population strata size. Each stratum was formed by patients of the same gender in one 5-year interval. We did sampling size calculations in finite populations. Given that Almeria has a population of 229,460, and that we previously hypothesized a 20% prevalence of myopia (although this prevalence varies in different populations and different ethnic groups, with a 5% epsilon and a 95% confidence interval [CI]), a simple random sampling would need a minimum of 244 people. By assuming a design effect of 1.27, the final stratified sample size we obtained was 310 patients. presents the sample size per stratum.
Figure 1 Sample size per stratum.
Inclusion criteria: patients aged between 20 and 40 years with any degree of myopia and with a degree of astigmatism lower than 1 diopter and who had neither ocular diseases nor aphakia.
Exclusion criteria: emmetropia, hypermetropia, or/and astigmatism with more than 1 diopter; presence of ocular diseases such as glaucoma: patients with IOP over 21 mmHg and suspicious optic nerve head were excluded.
A visual acuity test (VA) was performed with a Topcon optotypes projector, ocular refraction was carried out with a Nidek AR-6000 auto refractor, and ocular topography was done with an Allegro Oculyzer. The horizontal, vertical and mid-corneal curvatures, as well as the asphericity factor, were all measured. IOP was measured with a Canon TX-10 tonometer (3 measurements were taken on each eye and the average was considered). A Topcon slit-lamp was used for the ophthalmoscopic examination, a DGH 4000 B pachymeter was employed for CCT measurements (3 measurements were taken on each eye and the average was considered), and the back of the eye was examined by direct ophthalmoscopy. The ophthalmologist was aware of the results of all measurements of each patient.
Statistical analyses
We calculated the mean, standard deviation (SD), 95% CI for the mean, median, Fisher’s (asymmetry) coefficients, range, maximum and minimum for each variable, the overall sample, and each stratum. To verify possible gender differences, we used Student’s t-test for the independent samples in the total sample and in each age group. The possible differences between age groups were calculated by the Brown-Forsythe robust test for the overall sample and by stratifying the results by gender. We considered the Dunnett’s post hoc test for the Brown-Forsythe test. We used the Brown-Forsythe test when the Levene’s test was significant. Differences between the left eyes and the right eyes in all the variables were calculated by Student’s t-test for related samples; likewise, they were calculated for the overall sample and per stratum. The possible relationships among the variables were verified by linear regression. For all the statistical analyses, a value lower than 0.05 (P < 0.05) was considered statistically significant.
Results
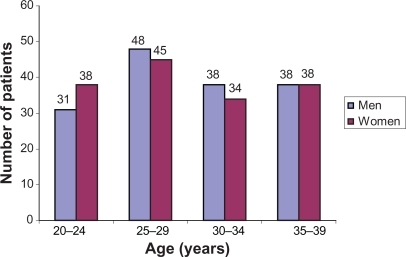
This study population included 310 myopic subjects (620 eyes), which is representative of the myopic population of our city (155 men and 155 women) aged between 20 and 40 years (mean overall value of 29.86, with a SD of 5.55 and a median of 29). The 310 subjects were divided by age: 69 aged 20–24 (31 men, 38 women); 93 aged 25–29 (48 men, 45 women); 72 aged 30–34 (38 men, 34 women); and 76 aged 35–40 (38 men, 38 women).
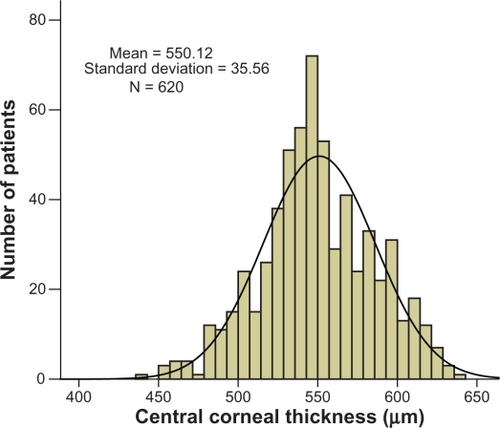
The mean overall CCT in our study population was 550.12, with an SD of 35.56, a 95% CI of (547.31, 552.92), a range of 200 (minimum value of 440, maximum value of 640), an asymmetry coefficient of −0.06, and a median of 549 ().
Figure 2 Distribution of central corneal thickness in the sample.
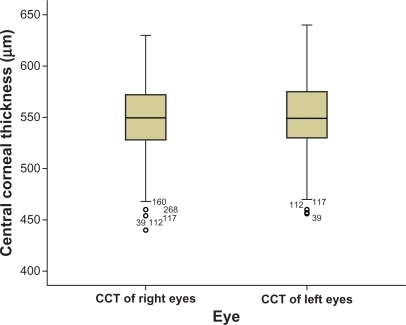
The overall mean of the right eyes was 548.98, with an SD of 35.62 overall, a 95% CI of (545, 552.96), a range of 190 (minimum value of 440, maximum value of 630), an asymmetry coefficient of −0.13, and a median of 549.5. The overall mean of the left eyes was 551.21, with an SD of 35.52, a 95% CI of (547.29, 555.22), a range of 184 (minimum value of 456, maximum value of 640), an asymmetry coefficient of 0.01, and a median of 549. This difference in the means between the left and right eyes was not statistically significant (P = 0.426). Therefore, we cannot generalize that the left eyes of this myopic population were thicker ().
Figure 3 Comparison of central corneal thickness (CCT) values between right and left eyes in the sample.
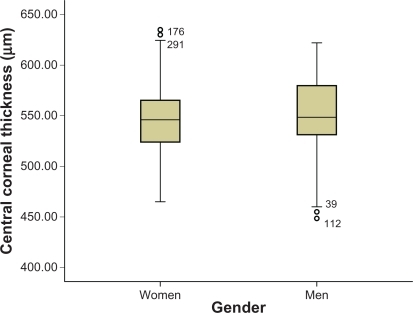
The men’s overall mean (eyes, n = 310) was 553.62, with an SD of 35.40, a 95% CI of (549.67, 557.58), a range of 184 (minimum value of 440, maximum value of 624), an asymmetry coefficient of −0.33, and a median of 550. The women’s overall mean (eyes, n = 310) was 546.61, with an SD of 35.26, a 95% CI of (542.65, 550.57), a range of 180 (minimum value of 460, maximum value of 640), an asymmetry coefficient of 0.21, and a median of 546.5. The difference between the men’s and women’s means was statistically significant (P = 0.014), thus we may conclude that men’s corneas were somewhat thicker ().
Figure 4 Comparison of central corneal thickness values between women and men in the sample.
The men’s overall mean (eyes, n = 310) was 553.62, and the mean value of men’s right eyes was 552.52, with an SD of 35.63, a 95% CI of (546.86, 558.17), a range of 180 (minimum value of 440, maximum value of 620), an asymmetry coefficient of −0.36, and a median of 551. The mean value of men’s left eyes was 554.73, with an SD of 35.25, a 95% CI of (549.14, 560.32), a range of 168 (minimum value of 456, maximum value of 624), an asymmetry coefficient of −0.30, and a median of 550. The difference in the means of men’s right and left eyes was not statistically significant (P = 0.583). The women’s overall mean (eyes, n = 310) was 546.61, and the mean value of women’s right eyes was 545.44, with an SD of 35.38, a 95% CI of (539.83, 551.05), a range of 170 (minimum value of 460, maximum value of 630), an asymmetry coefficient of 0.10, and a median of 548. The mean value of the left eyes in women was 547.78, with an SD of 35.56, a 95% CI of (542.14, 553.42), a range of 170 (minimum value of 470, maximum value of 640), an asymmetry coefficient of 0.31, and a median of 546. The difference between the means of women’s left and right eyes was not statistically significant (P = 0.561).
Our general comparison showed that the left eyes were thicker (553.05) than the right eyes (547.22) for both men and women. Nevertheless, the difference was not statistically significant (P = 0.426).
When we compared the mean CCT value of men’s right eyes (552.52) with the mean value of women’s right eyes (545.44), we encountered differences which came close to being significant (P = 0.08). When we compared men’s left eyes (554.73) with women’s left eyes (547.78), the differences found were also close to being significant (P = 0.085). In general, men’s corneas were thicker (553.62) than women’s (546.61) (P = 0.014). So we may conclude that men’s eyes were thicker than women’s. In general, the CCT values were higher for men (553.62) than for women (546.61) (P = 0.014).
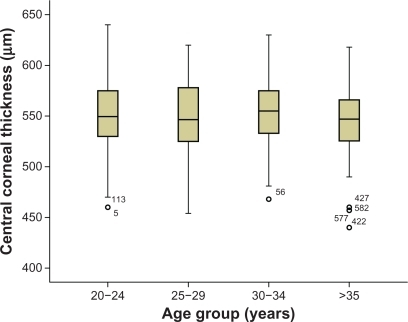
The CCT values in all the age groups are stable (P = 0.553). However, we cannot rule out the null hypothesis of equality in terms of CCT values for all the age groups ().
Figure 5 Comparison of central corneal thickness values among age groups.
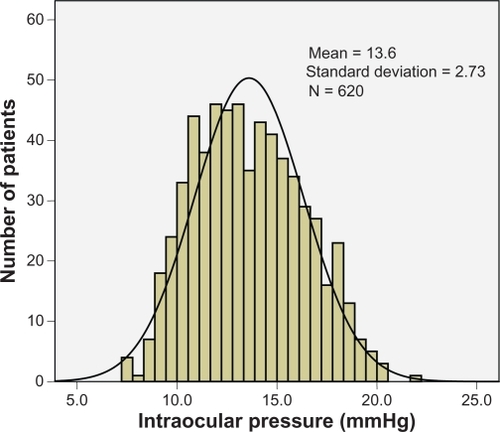
The mean overall IOP of our study population was 13.60 mmHg, with an SD of 2.73, a 95% CI of (13.39, 13.82), a range of 14.30 (minimum value of 7.40, maximum value of 21.70), an asymmetry coefficient of 0.23, and a median of 13.40 ().
Figure 6 Distribution of intraocular pressure (IOP) in the sample.
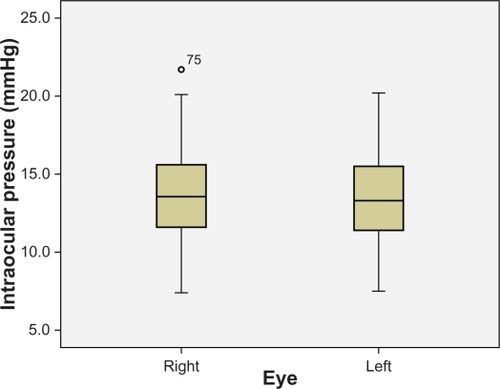
The overall mean of the right eyes was 13.62, with an SD of 2.74, a 95% CI of (13.32, 13.93), a range of 14.30 (minimum value of 7.40, maximum value of 21.70), an asymmetry coefficient of 0.18, and a median of 13.55. The overall mean of the left eyes was 13.58, with an SD of 2.72, a 95% CI of (13.27, 13.88), a range of 12.70 (minimum value of 7.50, maximum value of 20.20), an asymmetry coefficient of 0.28, and a median of 13.30. Because the difference found was not statistically significant (P = 0.614), we cannot conclude that in general that our study population tended to have a higher IOP in their left eyes ().
Figure 7 Comparison of intraocular pressure (IOP) values between right and left eyes in the sample.
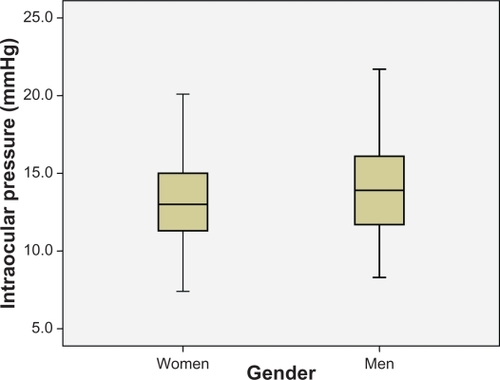
The men’s mean (eyes, n = 310) was 13.93, with an SD of 2.79, a 95% CI of (13.62, 14.25), a range of 13.40 (minimum value of 8.30, maximum value of 21.70), an asymmetry coefficient of 0.12, and a median of 13.90. The women’s mean (eyes, n = 310) was 13.27, with an SD of 2.63, a 95% CI of (12.97, 13.56), a range of 12.70 (minimum value of 7.40, maximum value of 20.10), an asymmetry coefficient of 0.32, and a median of 13. Because the difference was statistically significant (P = 0.002), we concluded that, in general, men had a higher IOP ().
Figure 8 Comparison of intraocular pressure (IOP) values between women and men in the sample.
The men’s mean (n = 155) was 13.93, and the mean of men’s right eyes was 14.03, with an SD of 2.79, a 95% CI of (13.59, 14.47), a range of 13.40 (minimum value of 8.30, maximum value of 21.70), an asymmetry coefficient of −0.01, and a median of 13.90. The mean of men’s left eyes was 13.84, with an SD of 2.80, with a 95% CI of (13.39, 14.28), a range of 11.70 (minimum value of 8.50, maximum value of 20.20), an asymmetry coefficient of 0.25, and a median of 13.80. This difference was not statistically significant (P = 0.170), thus we may conclude that men’s left eyes did not have a higher IOP. The women’s mean was 13.27, and the mean of their right eyes was 13.22, with an SD of 2.64, a 95% CI of (12.80, 13.64), a range of 12.70 (minimum value of 7.40, maximum value of 20.10), an asymmetry coefficient of 0.36, and a median of 13. The mean of women’s left eyes was 13.32, with an SD of 2.63, a 95% CI of (12.90, 13.74), a range of 11.70 (minimum value of 7.50, maximum value of 19.20), an asymmetry coefficient of 0.29, and a median of 13. Because this difference was statistically significant (P = 0.390), we concluded that women’s left eyes did not have a higher IOP.
When we compared the mean IOP of men’s right eyes with the mean IOP of women’s right eyes, we found a statistically significant difference (P = 0.009), but not when we compared men’s and women’s left eyes (P = 0.092). Therefore, we may conclude that men had a higher IOP in their right eyes than women, which did not occur when we compared men’s and women’s left eyes.
Regarding eye groups, IOP were not stable in them all (P = 0.001) as we found differences between the 25 to 29 age group and the 20 to 24 and 30 to 34 age groups ().
Figure 9 Comparison of intraocular pressure (IOP) values among age groups.
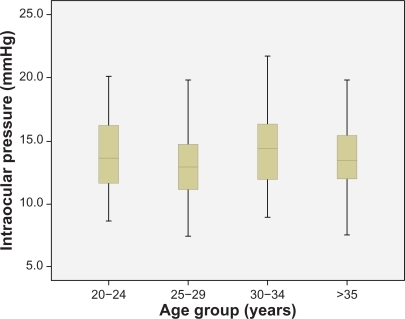
We found a statistically significant difference between those subjects over the age of 30 and those under 30 (P = 0.04).
The mean of the subjects under 30 years (n = 324) was 13.386, with an SD of 2.77, a 95% CI of (13.083, 13.688), a range of 12.7 (minimum value 7.40, maximum value 20.10), an asymmetry coefficient of 0.315, and a median of 13.10. The mean of those aged over 30 (n = 296) was 14.836 with an SD of 2.67, a 95% CI of (13.531, 14.142), a range of 14.2 (minimum value 7.50, maximum value 21.7), an asymmetry coefficient of 0.146, and a median of 13.80 ().
Figure 10 Comparison of intraocular pressure (IOP) values between patients of groups under and over 30 years of age.
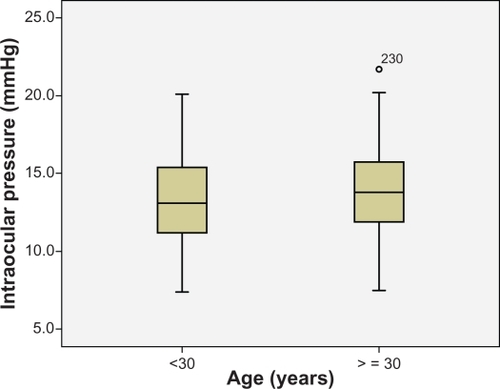
Our results enabled us to conclude that IOP tends to increase after the age of 30, which is not accounted for by structural parameters because the CCT values did not change. We believe that the cause was a functional change (hysteresis) or lessened trabecular or uveoscleral overflow.
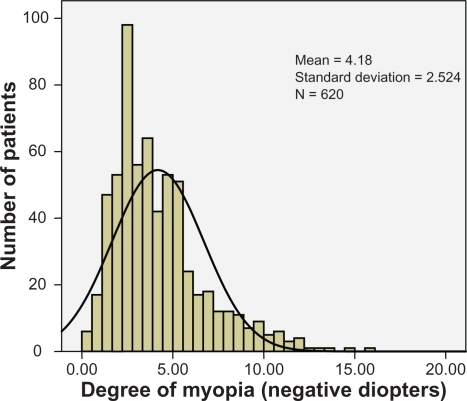
The overall mean degree of myopia (DM) in our study population was 4.18 diopters, with an SD of 2.52, a 95% CI of (3.98, 4.38), a range of 15 (minimum value of 1, maximum value of 16), an asymmetry coefficient of 1.29, and a median of 3.50 ().
Figure 11 Distribution of myopia in the sample.
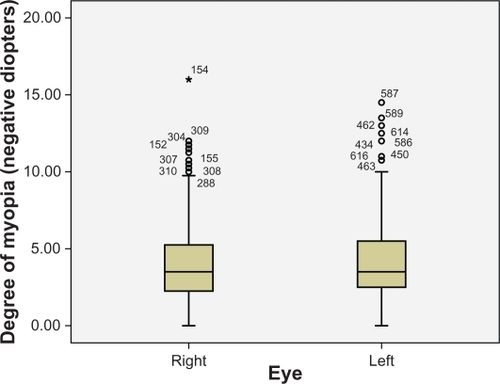
The overall mean in the right eyes was 4.17, with an SD of 2.51, a 95% CI of (3.89, 4.45), a range of 15 (minimum value of 1, maximum value of 16), an asymmetry coefficient of 1.29, and a median of 3.50. The overall mean of the left eyes was 4.19, with an SD of 2.54, a 95% CI of (3.91, 4.48), a range of 13.50 (minimum value of 1, maximum value of 14.50), an asymmetry coefficient of 1.29, and a median of 3.5. Our comparison shows no statistical significance (P = 0.759), although we cannot rule out the null hypothesis of equality for the means found between the left and right eyes ().
Figure 12 Comparison of myopia values between right and left eyes in the sample.
The men’s mean (eyes, n = 310) was 3.82, with an SD of 2.41, a 95% CI of (3.55, 4.09), a range of 15 (minimum value of 1, maximum value of 16), an asymmetry coefficient of 1.46, and a median of 3. The women’s mean (eyes, n = 310) was 4.54, with an SD of 2.59, a 95% CI of (4.25, 4.83), a range of 13.50 (minimum value of 1, maximum value of 14.5), an asymmetry coefficient of 1.17, a median of 4. Statistically significant differences were found (P < 0.001), and we may conclude that the women in this study sample had somewhat more myopia than the men ().
Figure 13 Comparison of myopia values between women and men in the sample.
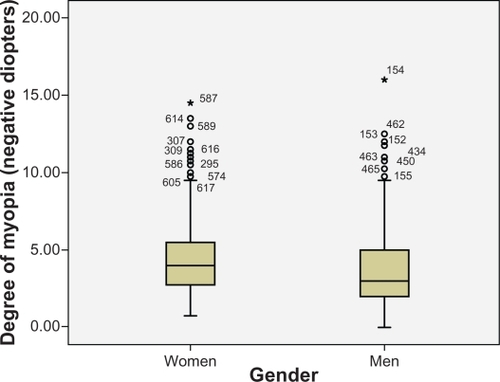
The mean of men’s right eyes was 3.83, with an SD of 2.45, a 95% CI of (3.44, 4.22), a range of 15 (minimum value of 1, maximum value of 16), an asymmetry coefficient of 1.67, and a median of 3. The mean of men’s left eyes was 3.81, with an SD of 2.38, a 95% CI of (3.43, 4.18), a range of 11.5 (minimum value of 1, maximum value of 12.5), an asymmetry coefficient of 1.23, and a median of 3.25. This difference in the means of men’s left and right eyes was not statistically significant (P = 0.817), so we may conclude that men’s myopia is equal in both eyes. The mean of women’s right eyes was 4.50, with an SD of 2.53, a 95% CI of (4.10, 4.91), a range of 11 (minimum value of 1, maximum value of 12), an asymmetry coefficient of 1, and a median of 4. The mean of women’s left eyes was 4.58, with an SD of 2.65, a 95% CI of (4.16, 5.00), a range of 13.50 (minimum value of 1, maximum value of 14.50), an asymmetry coefficient of 1.32, and a median of 4. The difference in means was not statistically significant (P = 0.532), so we may conclude that women’s myopia was equal in both eyes.
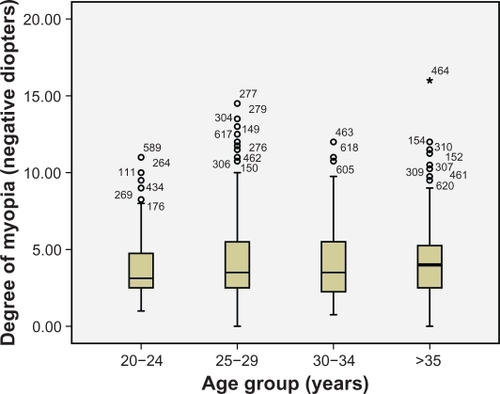
Myopia was seen to be stable in all the age groups (P = 0.089) ().
Figure 14 Comparison of myopia values among age groups.
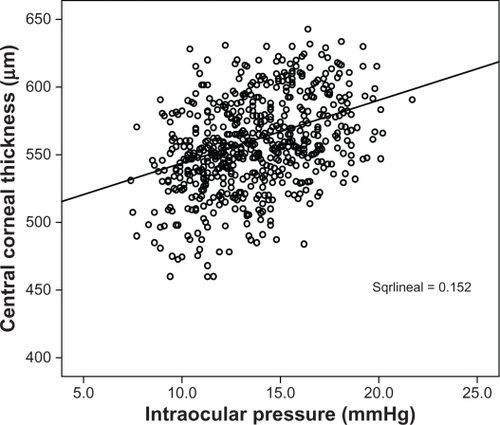
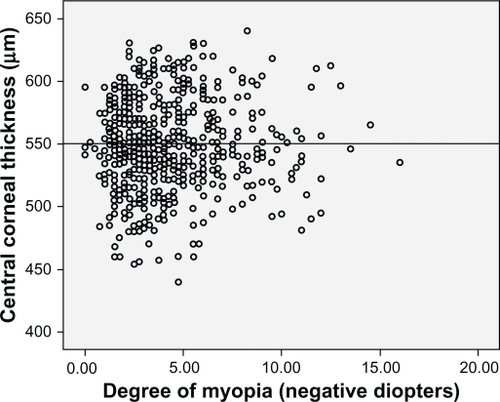
CCT values correlated directly with IOP; that is, the greater the thickness, the higher the pressure (r = 0.39, P < 0.001). It is necessary to know each person’s central corneal thickness to know his/her genuine pressure. The linear determination coefficient was R2 = 0.152; in other words, CCT influences IOP by 15.2% ().
Figure 15 Scatterplot showing how much intraocular pressure (IOP) is affected by central corneal thickness (CCT) in the sample.
When we did the linear regression test, we found no relationship between the DM and IOP (Square = 0, P = 0.102) (). We found no linear correlation between CCT and the DM (Square = 0, P = 0.956) ().
Figure 16 Scatterplot showing the relationship between myopia and intraocular pressure (IOP).
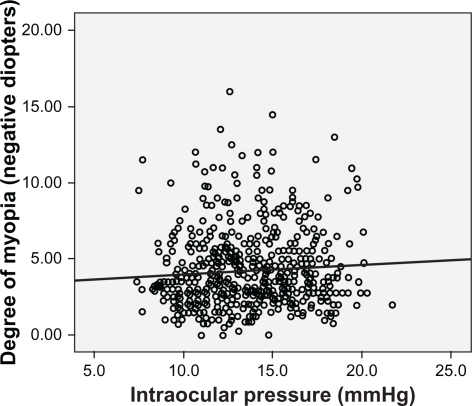
Figure 17 Scatterplot showing the relationship between myopia and central corneal thickness (CCT).
Discussion
We centered our study on a healthy myopic population aged 20 to 40 years because we believe that the period between these ages is one of refractive stabilityCitation6,Citation12 and, therefore, the corneal measurements can be considered stable because they are affected by neither growth nor ageing. Likewise, it was easy to cover this population given the number of patients who come to our consultations.
We obtained a mean corneal thickness value in this study of 550.12 μm. This mean is similar to that obtained in other studies: in Spain, a mean of 544.34 μm was found,Citation7 in Saudi Arabia, 543.80,Citation19 and in Latin individuals, 546.90,Citation17 which was lower than that reportedCitation20 in an American Caucasian population. Nevertheless, these studies were neither undertaken with the same population group (race and age) nor specifically selected healthy myopic individuals, which could be the causes of these differences. Furthermore, these studies did not distinguish between healthy and glaucomatous groups, so a comparison would not be altogether reliable. We should also bear in mind that the use of different pachymeters may also influence the final CCT value result obtained.Citation21–Citation28
We point out that we found no statistically significant differences in the CCT values of these age groups, unlike other authorsCitation7,Citation17,Citation20,Citation27,Citation29 who reported that age was a factor that lowers CCT. Nevertheless, other studies did not observe this relationship: Nemesure et al,Citation11 Shimmyo et al,Citation12 and research in ReykjavikCitation31 and Rotterdam.Citation32 Because none of our patients were over the age of 40 or under 20 years, we have no data available which acknowledge that age may be an influential factor. However, we believe that CCT is not only influenced by age, but also influences IOP, and evidently glaucoma (currently being studied). Therefore, we indicate the need to adjust the IOP in relation to corneal thickness.Citation8,Citation10,Citation14,Citation22,Citation29,Citation32
CCT is essential to establish glaucoma therapeutic guidelinesCitation12,Citation19 and is a determining factor in establishing the patient’s genuine IOP.Citation5,Citation8,Citation14 Since it is well-known that there are drugs responsible for affecting CCT valuesCitation18,Citation33–Citation35 and that these alterations may prove determining factors in the application of specific therapies, eg, latanoprost,Citation18 possible changes in thickness may contraindicate the use of certain drugs for patients having undergone refractive surgery.
The IOP values we obtained in our study (13.6) differ from those encountered by other authorsCitation7,Citation10,Citation26 which range from 13.3 to 19.1, although the variability of these figures may be accounted for by the use of different tonometers to measure pressureCitation18,Citation21,Citation23,Citation25,Citation26,Citation32 and by the population groups not all being the same which, in our case, is a healthy Caucasian non-glaucomatous myopic population.
We should point out the differences we found in men’s and women’s IOPs, which coincide with those found by Nangia et al,Citation36 and which may be explained by the difference between corneal thickness between both genders.Citation28,Citation29 We are well aware of the importance of the influence of CCT on IOP,Citation8,Citation17,Citation20,Citation22,Citation24,Citation30,Citation31,Citation33,Citation37–Citation39 and that CCT is a determining factor in establishing a patient’s genuine IOP.Citation5,Citation8 It is also necessary to consider the possible differences in corneal hysteresis between men and womenCitation9,Citation10 as the cause for this difference.
The tendency of increased IOP in subjects over the age of 30, bearing in mind that the CCT had not increased, indicates that we should consider biomechanical factors, which are affected by corneal aging,Citation40 or the deterioration of the trabecular or uveoscleral overflow function.
As in research by Shimmyo et al,Citation12 Alsbirk et al,Citation41 and Nangia et al,Citation36 we found a statistically significant relationship between IOP and CCT for both the correlation test and the multivariate study.
The study by Shimmyo et alCitation12 estimated an IOP difference of 2.5 mm for every 100 μm of corneal thickness difference. Their results were similar to those described by other authors, but with IOP differences of between 1.1 and 3.2 mmHg.Citation7,Citation13,Citation22,Citation23 Although corneal thickness accounts for only 10% of IOP, it is apparently an important factor to consider in daily patient examinations.
The linear determination coefficient found in our study was R2 = 0.152 which means that the CCT influences the IOP value by 15.2%. Nonetheless, this value does not coincide exactly with that found by other authorsCitation12,Citation17,Citation29,Citation42 who estimated a similar figure of 10%. At this point we stress that this situation has important repercussions for glaucoma.Citation14 The CCT and IOP relationship may have implications when it comes to diagnosing ocular hypertension, open-angle glaucoma, or glaucoma with normal ocular pressure. IOP is still a very important factor in the development of glaucoma.Citation43,Citation44 By correcting IOP with corneal thickness, Copt et alCitation37 and Bron et alCitation38 encountered a high percentage of patients with glaucoma and normal pressure, and with ocular hypertension which had to be reclassified. However the R2 value obtained (0.152) may be regarded as indicating a low degree of association between CCT and IOP. Additional biomechanical factors not considered in this study such as corneal hysteresis and corneal resistance factor could probably have played a role in the measured IOP in addition to CCT.
With regard to the methods employed, those normally used in our clinical practice have been considered because we believe them to be universally accepted and beyond debate.
We are well aware that the results of our study cannot be extrapolated to the general population of the city of Almeria because this study has been carried out with myopic patients. Therefore this study, which has been conducted among myopic individuals, needs to be conducted with emmetropic, hyperopic and astigmatic subjects. In this way, we can gain a general picture of the values of these parameters among the general population of our city. These parameters cannot be applied to all age groups because we have only studied those aged between 20 and 40 years, because we believe this age group shows certain refractive stability after finalizing the growth process. Future studies will be necessary to find the values of those parameters studied herein, in these population groups.
Disclosure
The authors have no commercial interest in any product or procedure mentioned in this manuscript. This study was performed with informed consent and following all the guidelines for experimental investigations required by the local Ethics Committee.
References
- KempenJHMitchellPLeeKEEye Diseases Prevalence Research GroupThe prevalence of refractive errors among adults in the United States, Western Europe and AustraliaArch Ophthalmol2004122449550515078666
- GrosvenorTFlomMCChapter 2Refractive AnomaliesBostonButterworth-Heinemann19901539
- NangiaVJonasJBSinhaAMatinAKulkarniMRefractive error in Central India: the Central India Eye and Medical StudyOphthalmology2010117469369920045569
- FamHBHowACBaskaranMLimKLChanYHAungTCentral corneal thickness and its relationship to myopia in Chinese adultsBr J Ophthalmol200690121451145316916878
- DuekerDKSinghKLinSCCorneal thickness measurement in the management of primary open-angle glaucoma: a report by the American Academy of OphthalmologyOphthalmology200711491779178717822980
- GrosvenorTFlomMCChapter 6Refractive AnomaliesBostonButterworth-Heineman1990104117
- Sánchez-TocinoHBringas-CalvoRIglesias-CortiñasDCorrelation between intraocular pressure, paquimetry and keratometry in a normal populationArch Soc Esp Oftalmol200782526727217516262
- SinghRPGoldbergIGrahamSLSharmaAMohsinMCentral corneal thickness, tonometry, and ocular dimensions in glaucoma and ocular hypertensionJ Glaucoma200110320621011442184
- KamiyaKShimizuKOhmotoFEffect of aging on corneal biomechanical parameters using the ocular response analyzerJ Refract Surg2009251088889319835329
- FontesBMAmbrósioRJrAlonsoRSJardimDVelardeGCNoséWCorneal biomechanical metrics in eyes with refraction of −19.00 to +9.00 D in healthy Brazilian patientsJ Refract Surg200824994194519044236
- NemesureBWuSYHennisALeskeMLBarbados Eye Study GroupCorneal thickness and intraocular pressure in the Barbados eye studiesArch Ophthalmol20032121224024412583791
- ShimmyoMRossAJMoyAMostafaviRIntraocular pressure, Goldmann applanation tension, corneal thickness, and corneal curvature in Caucasians, Asians, Hispanics, and African AmericansAm J Ophthalmol2003136460361314516799
- EysteinssonTJonassonFSasakiHArnarssonASverrissonTSasakiKReykjavik Eye Study GroupCentral corneal thickness, radius of corneal curvature and intraocular pressure in normal subjects using non-contact techniques: Reykjavik Eye StudyActa Ophthalmol Scand2002801111511906297
- LesterMMeteMFigusMFrezzottiPIncorporating corneal pachymetry into the management of glaucomaJ Cataract Refract Surg20093591623162819683164
- SharmaNSinghviASinhaRVajpayeeRBReasons for not performing LASIK in refractive surgery candidatesJ Refract Surg200521549649816209449
- BinderPSAnalysis of ectasia after laser in situ keratomileusis: risk factorsJ Cataract Refract Surg20073391530153817720066
- HahnSAzenSYing-LaiMVarmaRLos Angeles Latino Eye Study Group. Central corneal thickness in LatinosInvest Ophthalmol Vis Sci20034441508151212657586
- DetorakisETArvanitakiVPallirakisIGKymionisGTsilimbarisMKApplanation tonometry versus dynamic contour tonometry in eyes treated with latanoprostJ Glaucoma201019319419819593199
- Al-MezaineHSAl-ObeidanSKangaveDSadaawyAWehaibTAAl-AmroSAThe relationship between central corneal thickness and degree of myopia among Saudi adultsInt Ophthalmol200929537337818587538
- La RosaFAGrossRLOrengo-NaniaSCentral corneal thickness of Caucasians and African Americans in glaucomatous and nonglaucomatous populationsArch Ophthalmol20011191232711146722
- EricksonDHGoodwinDRollinsMBelausteguiAAndersonCComparison of dynamic contour tonometry and Goldmann applanation tonometry and their relationship to corneal properties, refractive error, and ocular pulse amplitudeOptometry200980416917419329059
- FosterPJBaasanhuJAlsbirkPHMunkhbayarDUranchimegDJohnsonGJCentral corneal thickness and intraocular pressure in a Mongolian populationOphthalmology199810569699739627643
- NissenJHjortdalJOEhlersNFrost-LarsenKSorensenTA clinical comparison of optical and ultrasonic pachometryActa Ophthalmol (Copenh)19916956596631776423
- TonnuPAHoTNewsonTEl SheikhAThe influence of central corneal thickness and age on intraocular pressure measured by pneumotonometry, non-contact tonometry, the Tono-Pen XL, and Goldmann applanation tonometryBr J Ophthalmol200589785185415965165
- Sanchez tocinoHBringas CalvoRIglesias CortiñasDComparative study between the non-contact pneumotonometer Canon TX10 and the Goldmann tonometerArch Soc Esp Oftalmol2005801164364916311953
- Martinez de la CasaJMGarcia FeijoJVicoEEffect of corneal thickness on dynamic contour, rebound and goldmann tonometryOpthalmology20061131221562162
- ChoPLuiTComparison of the performance of the Nidek NT-2000 noncontact tonometer with the Keeler Pulsair 2000 and the Goldman applanation tonometerOptom Vis Sci199774151589148267
- SrivannaboonSRelationship between corneal thickness and level of myopiaJ Med Assoc Thai200285216216612081114
- LekskulMAimpunPNawanopparatskulBThe correlations between Central Corneal Thickness and age, gender, intraocular pressure and refractive error of aged 12–60 years old in rural Thai communityJ Med Assoc Thai200588Suppl 3S175S17916858956
- EysteinssonTJonassonFSasakiHCentral corneal thickness, radius of corneal curvature and intraocular pressure in normal subjects using non-contact techniques: Reykjavik Eye StudyActa Ophthalmol Scand2002801111511906297
- WolfsRCKlaverCCVingerlingJRGrobbeeDEHofmanAde JongPTDistribution of central corneal thickness and its association with intraocular pressure: The Rotterdam StudyAm J Ophthalmol199712367677729535620
- KohlhaasMBoehmAGSpoerlEPurstenAGreinHJPillunatLEEffect of central corneal thickness, corneal curvature, and axial length on applanation tonometryArch Ophthalmol2006124447147616606871
- BrandtJDCorneal Thickness in glaucoma screening, diagnosis, and managementCurr Opin Ophthalmol2004152858915021216
- LiuZPflugfelderSCThe effects of long-term contact lens wear on corneal thickness, curvature, and surface regularityOphthalmology2000107110511110647727
- GaoLFanHChengACWangZLamDSThe effects of eye drops on Corneal Thickness in adult myopiaCornea200625440440716670475
- NangiaVJonasJBSinhaAMatinAKulkarniMCentral Corneal Thickness and its Association with Ocular and General Parameters in Indians: The Central India Eye and Medical StudyOphthalmology2010117470571020045561
- CoptRPThomasRMermoudACorneal thickness in ocular hypertension, primary open-angle glaucoma, and normal tension glaucomaArch Ophthalmol1999117114169930155
- BronAMCreuzot-GarcherCGoudeau-BoutillonSd’AthisPFalsely elevated intraocular pressure due to increased central corneal thicknessGraefes Arch Clin Exp Ophthalmol1999237322022410090585
- OliveiraCTelloCLiebmannJRitchRCentral corneal thickness is not related to anterior scleral thickness or axial lengthJ Glaucoma200615319019416778639
- FontesBMAmbrósioRJrAlonsoRSJardimDVelardeGCNoséWCorneal biomechanical metrics in eyes with refraction of −19.00 to +9.00 D in healthy Brazilian patientsJ Refract Surg200824994194519044236
- AlsbirkPHCorneal thickness. I. Age variation, sex difference and oculometric correlationsActa Ophthalmol (Copenh)197856195104580340
- EhlersNBramsenTSperlingSApplanation tonometry and central corneal thicknessActa Ophthalmol (Copenh)197553134431172910
- KassMAHeuerDKHigginbothamEJThe Ocular Hypertension Treatment Study: a randomized trial determines that topical ocular hypotensive medication delays or prevents the onset of primary open-angle glaucomaArch Ophthalmol2002120670171312049574
- AGIS InvestigatorsThe Advanced Glaucoma Intervention Study (AGIS): 9. Comparison of glaucoma outcomes in black and white patients within treatment groupsAm J Ophthalmol2001132331132011530042