
Abstract
The assessment of corneal staining is a commonly conducted procedure in both clinical practice and as part of various research studies. Different grading scales are employed by many clinicians and researchers to undertake this procedure for corneal staining comparisons between eyes, products and over time. This paper describes the development and use of a grading scale for corneal staining undertaken at an academic research site. The scale involves assessment of three factors across five corneal zones: type, area and depth. Staining type and area are graded on a 0–100 scale, and depth is graded on a 0–4 scale. These factors can be combined to create a three- or two-factor staining grade, or the factors may be reported individually. An additional benefit of this scale is that the staining scores may be reported by zone as “zone staining scores” or the scores of zones may be combined to provide an overall corneal “global staining score”.
Introduction
Over the past few years, there has been dispute regarding the conclusions that can be drawn from sodium fluorescein corneal staining.Citation1–Citation3 Despite questions about the clinical significance of corneal staining, particularly those associated with contact lens solutions,Citation1,Citation2 this assessment remains an essential element of ocular examination and thus the ability to record the level of corneal staining is important in clinical practice and is vital in contact lens and dry eye research.
Unfortunately, methods of assessing corneal staining are varied in their approach and there is a need for this assessment to be standardized.Citation4 While there has been growing interest in the development of objective methods to quantify staining and other anterior eye assessments,Citation5–Citation8 these have yet to become mainstream and to date none have been commercialized.
The challenge is to develop a standardized method that provides high sensitivity to detect change. Limitations of current scales prompted discussion within the Centre for Ocular Research & Education (CORE), formerly the Centre for Contact Lens Research, around the creation of a new corneal staining grading scale that would provide advantages over those available. This scale has evolved over several years, being first described in detail in a paper investigating solution-induced staining with silicone hydrogel lenses in 2002Citation9 and further described by Woods et al in 2006.Citation10 This paper describes the further evolution and use of this CORE staining scale.
Scale development
When describing and quantifying corneal staining, ideally three elements need to be considered: location, area and depth.
There are many different corneal staining grading scales currently in use. Examples of those that provide an integer grade for the entire corneal surface include OxfordCitation11 and Sjogren’s Syndrome International Registry scale (SICCA OSS).Citation12 These scales offer varying ranges for this global corneal grade: 0–4, 0–5 and 0–6 integer ranges. Developed to provide more sensitivity, the Efron corneal staining scaleCitation13 is a 0–4 global corneal scale which can be used in steps as small as 0.1. Other staining scales are based on grading the five corneal zones separately ().Citation14 Examples of scales which employ this zonal grading include the US Food and Drug Administration (FDA), the National Eye Institute (NEI) and the Brien Holden Vision Institute (BHVI) scales. In 1994, an FDA guidance document to the contact lens industry suggested that reporting the location of corneal staining would be beneficial to allow distinction of central staining from peripheral location and they suggested a 0–4 integer scale followed by a letter code for the zone affected.Citation15 The NEI report of 1995Citation4 also suggested a grading by zone, but suggested a 0–3 integer scale.
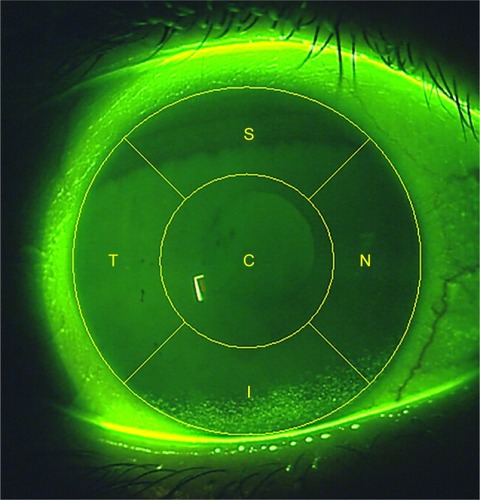
Figure 1 Schematic illustrating the five corneal zones.
The BHVI grading scales (formerly the CCLRU grading scales) were first described in 1993Citation16 and included a multi-factorial corneal staining grading scale, which offered an increased number of steps compared to previous scales, with the intent to provide increased sensitivity.Citation17 This scale involved assessment of staining in each of the five corneal zones instead of just one grade, and included three separate staining factors; type, extent and depth. Each criterion is scored on a 0–4 scale, with steps as small as 0.1.Citation18 The BHVI three-factor scale provided increased descriptive ability compared to a single-number scale. However, despite being more descriptive, and providing a greater ability to detect change compared to other reduced-step scales, its sensitivity was still somewhat limited by the 41 steps of the 0–4 scale in 0.1 steps and by the separate reporting of the three factors. These limitations prompted the creation of the CORE corneal staining scale.
Scales with a small number of steps, such as the Oxford (0–3 integer) and NEI scale (0–15 integer), typically have good repeatability (intraclass correlation coefficient of 0.97 and 0.98, respectively);Citation19 however, they lack sensitivity.Citation20 Creating a scale with more steps can lead to the opposite problem, that is, improved sensitivity but reduced repeatability.Citation19
The purpose behind developing the CORE corneal staining scale was to address several needs:
increase sensitivity compared to 0–4 scales;
enable the location of the staining to be recorded;
facilitate grading of individual criterion of the staining; and
generate continuous data to facilitate parametric data analysis.
It was decided to divide the cornea into five zones, each to be assessed separately: the central (C), superior (S), nasal (N), inferior (I) and temporal (T) zones (). This zone division had already been describedCitation14 and has been supported as being beneficial by a subsequent global vs zonal grading comparison.Citation21
Despite zonal division of the cornea having been described previously, the diameter of the central zone relative to the cornea has not been specified. Some have described the zones as being of equal or similar size, but have stopped short of being more specific than that.Citation16,Citation17 In order for the CORE scale to be applicable to all size eyes and in all clinical situations, the central zone was specified to have a diameter that is one half of the diameter of the cornea. This proportion allows the observer to readily visualize the central zone as distinct from the peripheral zones, because from the center of the cornea, the central zone extends half way to the limbus in all directions. This still means that the five zones have a similar area, though the central zone is slightly larger than the peripheral zones. For example, for a corneal diameter of 11.51 mm, which is the average of mean Chinese and Caucasian corneal diameters reported by Hickson-Curran et al,Citation22 the area of the central corneal zone is 22.53 mm2 and the area of each peripheral corneal zone is 20.77 mm2 (using ∏=3.142). For larger corneas, the difference in area will increase.
In order to describe the staining as fully as possible, it was decided to follow the same multifactorial approach as the BHVI grading scale and describe the same three distinct factors of the staining appearance, separately across each of the five zones:
the type of staining;
the extent (area) that the staining is spread across; and
the depth of the staining.
Consideration was given to expanding the scale to improve sensitivity and create continuous data points that, if normally distributed, would facilitate parametric analysis.
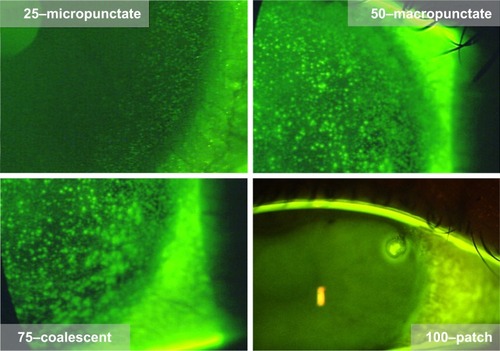
The type of staining was allocated a continuous integer scale, from 0 to 100, with anchors as described in and illustrated in .
Table 1 CORE staining grade for the type of fluorescein staining, 0–100 integer scale
Figure 2 Image reference for staining types.
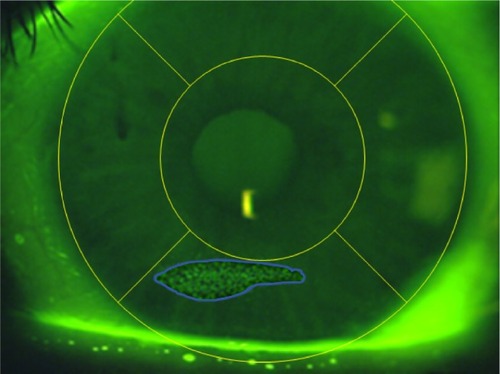
The extent of staining was also allocated a continuous integer scale, from 0 to 100, to represent the percentage area of the individual zone that contains corneal staining. One important feature of the extent grade is that it does not represent the area of all the punctate dots pulled together, but rather it represents the spread of the staining across the zone (). For example, if punctate stain was evident across the entire central zone, then the extent within that zone would be represented by 100, despite the staining dots being small and spread apart from each other.
Figure 3 The blue outline illustrates the extent to be allocated to punctate stain, extent=20.
The depth of corneal staining was already a part of the BHVI grading scale in the form of a 0–4 integer scale with distinct descriptors. Given the limited options available to describe the depth of staining in terms of the penetration of fluorescein into the cornea, this scale was determined to be sufficient for grading the depth of staining and was adopted as the basis for the CORE staining scale ().
Table 2 CORE staining grade for the depth of corneal staining, 0–4 integer scale
Application of core corneal staining scale
Because the central zone has a diameter that is approximately half of the diameter of the cornea for ease of assessment, the central zone has a slightly larger area than each of the other four zones.
Clinical records
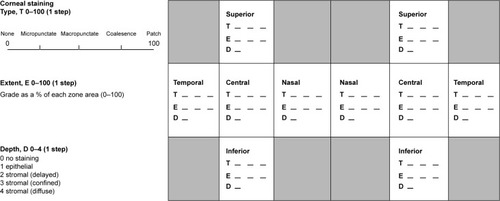
When each zone is graded fully to describe the presence of staining, three values are generated for each zone, as shown in the recording from the example in , that is, for type (1–100), extent (1–100) and depth (1–4). These values are all that are required on a clinical record to describe the staining appearance in each corneal zone, and they provide a simple three-factor description which facilitates monitoring and comparison for change at subsequent clinic visits across all three factors of type, extent and depth.
Figure 4 An example of a clinical recording table for CORE corneal staining scale.
Reporting the staining
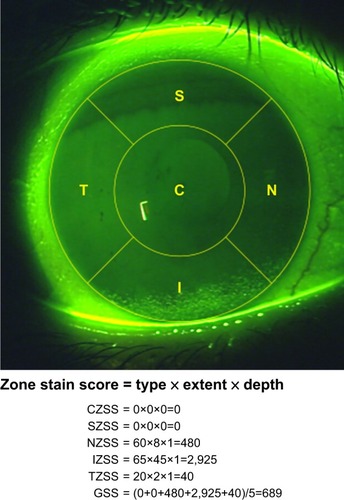
The staining can be reported and analyzed for the individual zones or for the entire cornea as a whole. The scores for the three factors are combined by three-way multiplication to create and spread data even wider to increase sensitivity. The individual zone score is referred to as the “zone staining score” or ZSS, and the scores are abbreviated as CZSS, SZSS, NZSS, IZSS and TZSS for the central, superior, nasal, inferior and temporal zones, respectively. The mean of all the five zones’ stain scores provides the “global staining score” or GSS, which represents the cornea as a whole.
The three values that make up the staining grade can be manipulated in several ways to report the staining, depending on the distribution of the data and the key factor of interest among the three factors. The three common options are listed here.
Three-factor reporting of CORE corneal staining scale
The product of the type, extent and depth grades provides the three-factor grade for each corneal zone, and in this case, the ZSS and the GSS are scored out of a maximum of 40,000 (0–100×0–100×0–4; ).
Figure 5 An example of staining and the representative ZSSs and GSS.
Two-factor reporting of CORE corneal staining scale
In practice, most corneal staining seen in clinical contact lens research, other than in cases of an adverse event, has a depth of 1 (superficial epithelial), resulting in this extended grading scale effectively being truncated back to a two-factor grade, which provides a 0–10,000 scale range. In this case, the ZSS and GSS are effectively the product of just two grading values, that is, type and extent, because the depth grade is always “grade 1”. In this method, the total staining grade could reach a maximum of 10,000.Citation9,Citation23,Citation24
In studies where variability in the staining depth is anticipated, adding the depth as a third factor to reach a full three-factor staining score (type × extent × depth), as described above, will serve to capture the staining more fully and to spread the staining data even wider to aide differentiation between eyes/treatments. In practice, if all staining is superficial (ie, depth grade is 1), then the two-factor grade yields the same value as the three-factor grade.
One-factor reporting of CORE corneal staining scale
There are occasions when the CORE scale has been used to simply report the extent of corneal staining over the corneal surface, either by zone or over the cornea as a whole.Citation25 In specific clinical research projects where the depth of staining is always grade 1 and the type of staining is consistent or of limited interest, it is the extent of the staining that is the key outcome variable. For example, if the corneal staining is micropunctate in all eyes, and is superficial epithelial in all eyes, then the variability of the staining score is captured by the extent grade alone. Reporting extent alone has the advantage of being easily interpreted by the reader because it can be readily “visualized” as the area of the zone, or cornea, which exhibits staining.
Discussion
This grading scale has been used extensively at CORE for over a decade, largely because it is flexible and lends itself to multiple methods of representing the staining numerically and statistically. The expanded scale of 0–100 for the type and extent, and also the manipulation to create the zone and global staining scores, provides a continuous scale for grading the corneal staining. The continuous nature of the data opens the possibility for conducting parametric statistical analysis, which is often favored as being more robust. It also affords the potential for increased sensitivity, which is of particular benefit when attempting to discriminate responses in clinical trials.
There are some disadvantages to increasing the number of steps in a scale. For example, individuals may prefer to use certain numbers more often than others, thereby reducing the number of steps being utilized. It was reported by Fieguth and Simpson that an integer step scale of 0–100 gave rise to a preferential use of numbers that were multiples of five.Citation26 Their investigation involved a bulbar redness scale, but the preferential use of “friendly” values results could also apply to this corneal staining scale. It would perhaps be valuable to conduct a review of historical staining data to investigate if this is the case. Another disadvantage of creating a scale with more steps is that repeatability and inter-observer concordance are often sacrificed. For this reason, the use of this scale among multiple observers necessitates pictorial references, particularly for the staining type, and ongoing concordance assessment and training.Citation18 Variability may exist between different graders (inter-variability) as well as between different time points for the same grader (intra-variability). Using a grading scale to assign a grade to an eye is an inherently subjective task. The key to use any subjective grading scale successfully is to minimize inter- and intra-variability because it is impossible to eliminate it. This can be achieved in both practice and research settings by asking graders to grade a randomized series of images on two separate occasions. The viewing conditions should be controlled between sessions as much as possible, such as using the same room and the same computer screen. The grading results should be compared and retraining conducted where necessary. Variability is a criticism of all grading scales which rely on subjective assessment by an observer.Citation18,Citation27 A grading scale which is truly objective, by means of image analysis, can certainly reduce the variability, but it becomes more costly in terms of supporting hardware and software, which can be prohibitive in a clinical vs research setting.Citation5–Citation8 Furthermore, there is often increased time required to apply the software and review the area of interest identified by the algorithm, before a grading score can be confirmed.Citation5–Citation8
The CORE corneal staining scale provides the ability to record the type, extent and depth of staining by zone or globally across the entire cornea. Using zone scores, it facilitates the reporting of the location of corneal staining. It is often important to understand where on the cornea the staining is observed, and this information is unavailable in grading systems that provide only a single grade for the whole cornea. For example, mid-inferior dehydration-type staining and superior epithelial arcuate lesions both have specific and different implications for a soft contact lens design, and require different management strategies.Citation28
The CORE corneal staining scale has proven to be useful when the location and/or the quantification of corneal staining are of key interest, and when more robust, parametric analysis is desired. Additionally, the scale provides the level of sensitivity often necessary in clinical research, while being simple enough to be adopted in a clinical practice setting. The authors believe the CORE scale has the potential to become a broadly used grading system for recording corneal staining.
Acknowledgments
The authors would like to acknowledge Trefford Simpson for his scientific advice during the development of the CORE grading scale for corneal staining.
Disclosure
This work was directly supported by the Centre for Ocular Research & Education (CORE). CORE has received grants unrelated to this work over the past 3 years from Advanced Vision Research, Alcon, Allergan, Contamac, CooperVision, Essilor, GLChemtech, Inflamax, J&J Vision Care, Menicon, Nature’s Way, Novartis, Shire, TearLab and TearScience.
Ms Jill Woods and Prof Desmond Fonn report personal fees from CooperVision outside the submitted work. Prof Lyndon Jones reports personal fees from Alcon, CooperVi-sion, J&J Vision Care, Novartis, Ophtecs and Santen outside the submitted work. The authors report no other conflicts of interest in this work.
References
- WardKWSuperficial punctate fluorescein staining of the ocular surfaceOptom Vis Sci200885181618174837
- MorganPBMaldonado-CodinaCCorneal staining: do we really understand what we are seeing?Cont Lens Anterior Eye2009322485419181563
- EfronNPutting vital stains in contextClin Exp Optom201396440042123051047
- LempMAReport of the national eye institute/industry workshop on clinical trials in dry eyesClao J19952142212328565190
- WolffsohnJSIncremental nature of anterior eye grading scales determined by objective image analysisBr J Ophthalmol200488111434143815489489
- PetersonRCWolffsohnJSObjective grading of the anterior eyeOptom Vis Sci200986327327819165123
- ChunYSYoonWBKimKGParkIKObjective assessment of corneal staining using digital image analysisInvest Ophthalmol Vis Sci201455127896790325406292
- PritchardNYoungGColemanSHuntCSubjective and objective measures of corneal staining related to multipurpose care systemsCont Lens Anterior Eye20032613916303491
- JonesLMacdougallNSorbaraLGAsymptomatic corneal staining associated with the use of balafilcon silicone-hydrogel contact lenses disinfected with a polyaminopropyl biguanide-preserved care regimenOptom Vis Sci2002791275376112512683
- WoodsJWoodsCVarikootyJJonesLSimpsonTFonnDA novel method of recording corneal staining that facilitates parametric analysisOptometry and Vision Science20068365236
- BronAJEvansVESmithJAGrading of corneal and conjunctival staining in the context of other dry eye testsCornea200322764065014508260
- WhitcherJPShiboskiCHShiboskiSCA simplified quantitative method for assessing keratoconjunctivitis sicca from the Sjögren’s Syndrome International RegistryAm J Ophthalmol2010149340541520035924
- EfronNGrading scales for contact lens complicationsOphthalmic Physiol Opt19981821821869692040
- JosephsonJECafferyBECorneal staining after instillation of topical anesthetic (SSII)Invest Ophthalmol Vis Sci1988297109610992458327
- FDAGuidance document1994 Available from: http://www.fda.gov/downloads/MedicalDevices/DeviceRegulationandGuidance/Guidance-Documents/ucm080968.pdfAccessed January 13, 2018
- TerryRLSchniderCMHoldenBACCLRU standards for success of daily and extended wear contact lensesOptom Vis Sci19937032342438483586
- JalbertISweeneyDFHoldenBAThe characteristics of corneal staining in successful daily and extended disposable contact lens wearersClin Exp Optom199982141012482301
- TerryRSweeneyDWongRPapasEVariability of clinical investigators in contact lens researchOptometry and Vision Science199572Supplement16
- Sook ChunYParkIKReliability of 4 clinical grading systems for corneal stainingAm J Ophthalmol201415751097110224513097
- BaileyILBullimoreMARaaschTWTaylorHRClinical grading and the effects of scalingInvest Ophthalmol Vis Sci19913224224321993595
- BegleyCGBarrJTEdringtonTBLongWDMckenneyCDChalmersRLCharacteristics of corneal staining in hydrogel contact lens wearersOptom Vis Sci19967331932008725022
- Hickson-CurranSYoungGBrennanNHuntCChinese and Caucasian ocular topography and soft contact lens fitClin Exp Optom201699214915626928568
- PetersonRCFonnDWoodsCAJonesLImpact of a rub and rinse on solution-induced corneal stainingOptom Vis Sci201087121030103621076354
- VarikootyJSchulzeMMDumbletonKClinical performance of three silicone hydrogel daily disposable lensesOptom Vis Sci201592330131125628269
- WoodsJJonesLWPilot Study to Determine the Effect of Lens and Eye Rinsing on Solution-Induced Corneal Staining (SICS)Optom Vis Sci201693101218122727441740
- FieguthPSimpsonTAutomated measurement of bulbar rednessInvest Ophthalmol Vis Sci200243234034711818375
- PetersonRCWolffsohnJSSensitivity and reliability of objective image analysis compared to subjective grading of bulbar hyperaemiaBr J Ophthalmol200791111464146617475716
- CampbellBHenryVAWooSSoft lens problem solvingBennettESHenryVAClinical Manual of Contact Lenses4th edPhiladelphia, PALippincott Williams and Wilkins2014326327