
Abstract
Purpose
To assess the reproducibility of quantitative morphometrical evaluation of the choriocapillaris imaged with swept-source optical coherence tomography angiography (SS-OCTA).
Subjects and methods
This observational, cross-sectional case series included 35 eyes of healthy individuals and 32 eyes of 32 patients. Two images of the fovea were taken using SS-OCTA with 3×3 mm squares. Images of the choriocapillaris within 800×800 pixel squares centered at the fovea were analyzed morphometrically using open-source software “AngioTool” that applies a Gaussian recursive filter and multiscale Hessian enhancement. This program’s vessel thickness and intensity parameters can be changed to aid vessel detection. We measured the pairs of images per eye with different parameter sets and calculated the intraclass correlation (ICC) for the morphometrical results. After determining the parameters that produced high reproducibility, we evaluated regional variations in 800×800 pixel mm squares within the fovea.
Results
The ICCs for vessel area, total vessel length, vessel diameter index, and mean lacunarity were over 0.9 using the parameters of “vessel thickness” 3–4 and intensity 15 in the group including all subjects. When measurements were performed using these same parameter values, the vessel density and mean vessel diameter index were 60.5% and 19.1±0.389, respectively. Vessel density, vessel length, vessel diameter index, and mean lacunarity did not change significantly within an 800×800 pixel square centered at the fovea except for the 200×200 pixel square at the foveal center.
Conclusion
SS-OCTA images of the choriocapillaris can be measured with high reproducibility by morphometrical evaluation using open-source software with multiscale Hessian enhancement. Such automated morphometric analysis can provide an objective evaluation of the choriocapillaris.
Introduction
The choroid is a membranous vascular tissue between the retina and sclera, the main function of which is to supply oxygen and nutrients to the photoreceptor cells.Citation1 For this purpose, the choroid has a unique structure, the choriocapillaris, which is a mesh-like structure of capillaries in the innermost choroid.Citation2 Previous reports have suggested that disorders of the choriocapillaris may be associated with macular diseases, such as age-related macular degenerationCitation3,Citation4 and central serous chorioretinopathy (CSC).Citation5 It is essential to investigate the morphology and physiology of the choriocapillaris to elucidate the pathology of these diseases.
A novel technology, optical coherence tomography angiography (OCTA), provides information about retinal and choroidal blood flow in en-face images. Several studies have evaluated the choriocapillaris using OCTA images.Citation6–Citation8 Most reports have measured the area after thresholding of the original OCTA images. However, measurements using thresholding changes can differ depending on the method of thresholding and the threshold value. In addition, it is difficult to compare the results of thresholding with results from histopathological studies. For the purpose of vessel structure analysis, multiscale Hessian enhancement has been used to extract vessels on CT angiography and MRI angiography.Citation9 This enhancement method can be applied to the analysis of the choriocapillaris. AngioTool is an open-source software program provided by the National Cancer Institute (National Institutes of Health, Bethesda, MD, USA) for vessel structure analysis. The program performs multiscale Hessian enhancement using a Gaussian recursive filter.Citation10 This program allows users to change the parameters of the Gaussian recursive filter for the detection of various sizes of vessels. The size of the filter depends on the size of the vessels being measured and the quality of the images being analyzed. Morphometric parameters measured by AngioTool were described as total vessel area, vessel density, total vessel length, vessel diameter index, and mean lacunarity.
Swept-source (SS)-OCTA can depict the line structure of the choriocapillaris to some extent. The morphology of the choriocapillaris on SS-OCTA images varies according to anatomical variations, the angle and directions of the vessel, striation of the tissue, and the resolution of images. Because the image of the choriocapillaris can reflect the original structure although the lateral resolution of SS-OCTA is limited,Citation11 morphometrical evaluation may be possible. Initially, we did not know the optimal parameters for accurate measurements of the choriocapillaris when applying AngioTool to SS-OCTA images.
Reproducibility is the key for evaluating anatomical changes in the vasculature. The current study first evaluated the parameters of AngioTool and then explored the reproducibility of morphometric results in the measurement of the choriocapillaris on SS-OCTA images with different parameters of AngioTool. Finally, we analyzed the regional variation of the choriocapillaris in 800×800 pixel squares centered at the fovea with the optimal parameters.
Subjects and methods
Subjects
The Fukushima Medical University Institutional Review Board approved this study, which adhered to the tenets of the Declaration of Helsinki. We examined one eye of each of 35 healthy volunteers and 32 patients. All participants provided written informed consent. Healthy individuals with no visual symptoms and no history of previous chorioretinal disease were eligible for this study. The choice of test eye for each healthy individual was based on their own preference. Highly myopic eyes (more than six diopters) were excluded. The set of patient eyes was composed of 17 with resolved CSC; five with resolved diabetic macular edema; five with age-related maculopathy, with dry maculae after treatment; three with resolved uveitis; and two with resolved macular edema, which was due to branch retinal vein occlusion. All eyes of the patients had been treated appropriately. All eyes had not received any treatment at the examination. No eyes had retinal hemorrhages or either intraretinal or subretinal fluid. Eyes treated with anti-vascular endothelial growth factor therapy more than three months ago were not excluded.
Image acquisition and analysis
Between November 1 and December 27, 2017, two 3×3 mm images of each eye were taken sequentially within a few minutes using SS-OCTA (PlexElite9000, Carl Zeiss Medics, Dublin, CA, USA) after one drop of compounding mydriatics (5 mg/mL, tropicamide and 5 mg/mL phenylephrine sodium chloride, Santen Pharmaceutical Co. Ltd., Osaka, Japan). The 100-kHz SS-OCTA instrument has a central wavelength of 1,060 nm, a bandwidth of 100 nm, A-scan depth of 3.0 mm in tissue, full width at a half-maximal axial resolution of about 5 µm in tissue, and lateral resolution at the retinal surface of about 20 µm. The FastTrac motion-correction software that is built into the SS-OCTA was used while the images were acquired. Poor-quality images, with blurred or duplicated retinal vessels, were discarded.
The 3×3-mm (1,024×1,024 pixels) total retinal and choriocapillaris slabs were exported for image analysis after removing projections of the retinal vessels from the choriocapillaris slab using the review software installed on the OCTA machine. The choriocapillaris was sampled as a 20-µm-thick slab, starting 29 µm posterior to the segmentation between the retinal pigment epithelium (RPE) and the Bruch’s membrane complex. Fiji, an open-source software, an expanded version of ImageJ version 1.51a (National Institutes of Health), available at fiji.sc, was used for preprocessing of the images. The region of interest in 800×800 pixel squares centered at the fovea was cropped from the choriocapillaris image. The foveal center was determined manually by inspection on the retinal image and transferred to the choriocapillaris image using the synchronization function. The contrast of the images was adjusted with the Contrast Limited Adaptive Histogram Equalization (CLAHE) method with block size =127 and slope =3, in the Fiji processing menu (). Thirty-five pairs of images from healthy individuals and 32 pairs of images from patients were analyzed with AngioTool. In brief, the analysis of vessel structure in AngioTool works as follows:Citation10 enhancement of vessel structure with the multiscale Hessian analysis is applied after smoothing with a recursive Gaussian filter. Then vessels are segmented and skeletonized. Finally, morphometrical parameters of the vessel are calculated. The choices of parameters in this study were vessel thicknesses of 2, 3, 4, or 5, or a combination of 2–3, 3–4, 2–3–4, and vessel intensity 15 or 20. The option checkboxes, “Removed small particles” and “Fill holes” were not selected for the measurements. We analyzed five morphometric results of the choriocapillaris: total vessel area (mm2), vessel density ([total vessel area]/[total measured area]%), total vessel length (mm), vessel diameter index, and mean lacunarity. Here, the vessel diameter index (µm) equals (the vessel area)/(total vessel length)×1,000. Lacunarity is a parameter indicating spatial dispersion.Citation12 A high value of lacunarity indicates extensive dispersion. Because each side of the 3×3 mm image is 1,024 pixels long, each pixel was calculated to be 2.929 µm. The intraclass correlation (ICC) was calculated between the two images per subject for each set of the parameters.
Figure 1 Analyzed images.
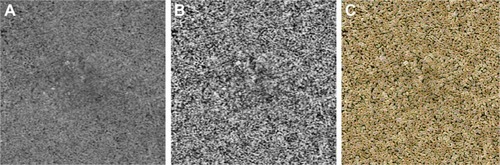
For comparison, the original image was analyzed with the thresholding method. The 800×800-square original image without CLAHE was binarized by auto local adjustment using Phansalkar’s methodCitation6 with parameter 15. After the images were inverted between black and white, the number and size of white areas, which indicate flow voids (FVs, ie, areas without vessels or without blood flow), and the %FV were measured using “analyze particle” in the “Analyze” menu of Fiji. Here, %FV is equal to (total area size of flow void)/(total measured area).
All images were randomized before analysis. Two operators determined the region of interest and confirmed the analysis results after automatic image processing by Fiji and AngioTool.
Statistical analysis
Descriptive statistics (mean ± SD, coefficient of variation [CV], and ICC) were calculated using a commercially available statistical software program (SPSS for Windows, version 25, IBM/SPSS, Chicago, IL, USA) and JMP (for Windows, version 12 SAS Institute Inc., Cary, NC, USA).
Results
shows the parameters of the healthy individuals and the patients. The mean ages of the healthy individuals and the patients were 27.9±5.8 years and 59.1±12.8 years, respectively. The ages of the two groups were significantly different (P<0.001). The mean spherical equivalents were −1.23±1.17 diopters (D) in healthy individuals and −0.86±1.61 D in the patients (P=0.295).
Table 1 Parameters in healthy individuals and patients’ groups
shows the results of the thresholding methods. In healthy individuals, the number of flow voids in an 800×800 pixel OCTA image was 2,552±192 (mean ± SD) (CV: 7.5) in the first image set and 2,560±177 (CV: 6.9) in the second image set. The average size of flow void was 3.30±1.25×10⁻⁴ mm2 (CV: 39.2) in the first image set and 3.15±1.16×10⁻⁴ mm2 (CV: 36.9) in the second image set from the healthy individuals. %FV was 14.62%±4.57% (CV: 31.2) in the first image set and 14.44%±4.35% (CV: 30.1) in the second image set in healthy individuals. In the patients, the number of flow voids was 2,252±197 (CV: 8.7) in the first image set and 2,252±188 (CV: 8.3) in the second image set. The average size of flow void was 4.56±1.52×10⁻⁴ mm2 (CV: 33.3) in the first image set and 4.64±1.47×10⁻⁴ mm2 (CV: 31.8) in the second image set from the patients. %FV was 18.29%±4.47% (CV: 24.4) in the first image set and 18.65%±4.44% (CV: 23.8) in the second image set in the patients. The ICCs of number, average size, and %FV in healthy individuals between the first image set and the second image set were 0.873, 0.950, and 0.915, respectively. In the same manner, the ICCs of number, average size, and %FV in the healthy individuals and the patients ranged over 0.9. The results of thresholding showed good reproducibility. The CVs indicated wide variation in the average size of flow void and %FV across subjects.
Table 2 Measurement of flow void by thresholding
We measured the images with 11 parameter sets (vessel thickness 2–5 and intensity thresholds 15–20) in healthy individuals (). The images from the patients’ group and from the combined group of healthy individuals and patients were each measured with seven parameter sets (vessel thickness 2–5 and intensity threshold 15). In total, the SS-OCTA images were measured in 25 conditions. In healthy individuals, vessel area in the 800×800 pixel (2.34×2.34 mm =5.493 mm2) square was as low as 2.772 (vessel density, 50.6%) mm2 when measuring with vessel thickness 5 and intensity 20. The vessel area in healthy individuals ranged up to 3.939 (vessel density, 60.9%) mm2 when measuring with vessel thickness 2, 3, and 4 (2–3–4) and intensity 15. The ICCs of the vessel area ranged from 0.548 to 0.853. The ICC was highest (0.853) with the parameters vessel thickness 3 and 4 (3–4) and intensity 15. When measuring with the parameter set of vessel diameter 3–4 and intensity 15, the ICCs were 0.877 for total vessel length, 0.843 for vessel diameter index, and 0.874 for mean lacunarity. In healthy individuals, the ICCs was over 0.8 for vessel area, total vessel length, vessel diameter index, and mean lacunarity when measuring with 3 of the 11 parameter sets: vessel thickness 4 with intensity 15, vessel thickness 3–4 with intensity 15, and vessel thickness 4 with intensity 20. The CVs ranged from 1.1 to 1.5 when measuring images from healthy individuals. In the patients, the ICCs were over 0.8 for vessel area, total vessel length, vessel diameter index, and mean lacunarity when measuring with 3 of the parameter sets: vessel diameter 3 and intensity 15, vessel diameter 2–3 and intensity 15, and vessel diameter 3–4 and intensity 15. In the combined group of healthy individuals and patients, the ICCs were over 0.9 for vessel area, total vessel length, vessel diameter index, and mean lacunarity only when measuring with the parameter set of vessel diameter 3–4 and intensity 15. In this instance, the CVs were 1.1 for vessel area, 3.6 for total vessel length, 2.0 for vessel diameter index, and 8.9 for mean lacunarity. Intensity changes did not seem to contribute to improvement in the ICCs. The default value (15–255) was used in the remaining parts of this study.
Table 3 Measurement parameters and reproducibility in images treated with local contrast enhancement
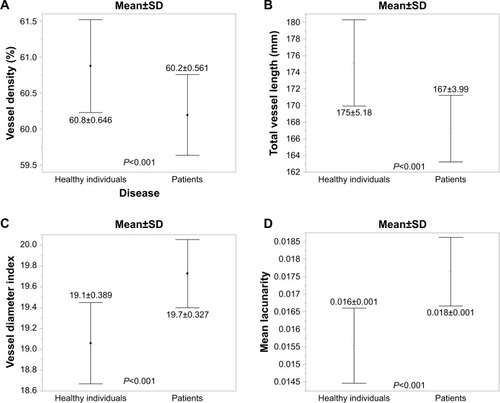
When measuring with the parameter set vessel diameter 3–4 and intensity 15, vessel density was 60.8%±0.64% in healthy individuals and 60.2%±0.56% in the patients (P<0.001). Total vessel length was 175±5.18 mm in healthy individuals and 167±3.99 mm in the patients (P<0.001). The vessel diameter index was 19.1±0.389 in healthy individuals and 19.7±0.327 in patients (P<0.001). Mean lacunarity was 0.016±0.001 in healthy individuals and 0.018±0.001 in patients (P<0.001) ().
Figure 2 Comparisons of the results analyzed using AngioTool, with vessel thickness 3–4 and intensity 15 between healthy individuals and the patients.
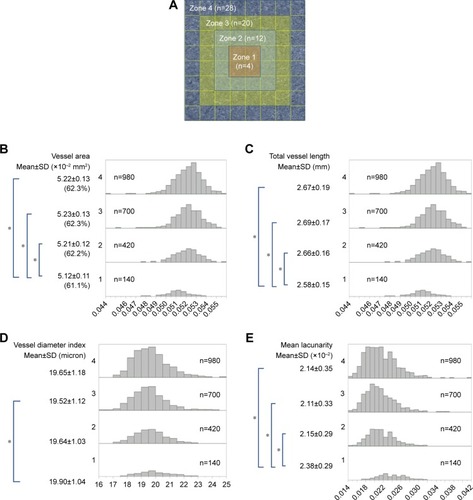
The 800×800 pixel OCTA images of 35 healthy individuals were divided into 64 regions, each with a 100×100-pixel square area (in total, 2,240 areas in all patients), and were measured using the parameter of vessel thickness 3–4 and intensity 15. The 64 regions per image were divided into four zones (). The mean vessel area was low (5.12±0.11×10⁻² mm2) in zone 1 (), with a significant difference between zone 1 and outer zones 2, 3, and 4 (P<0.05, Tukey–Kramer test). The mean total vessel length was lowest (2.58±0.15 mm) in zone 1 () and significantly different from the total vessel length in outer zones 2, 3, and 4 (P<0.05, Tukey–Kramer test). The mean vessel diameter index was slightly, but significantly larger in zone 1 (19.55±1.04) than in zone 3 (P=0.002, Tukey–Kramer test) (). The mean lacunarity was highest in zone 1 (2.38±0.29×10⁻²). There was a significant difference in the mean lacunarity between zone 1 and outer zones 2, 3, and 4 (P<0.05, Tukey–Kramer test) ().
Figure 3 Regional variations of morphometrical results in healthy individuals.
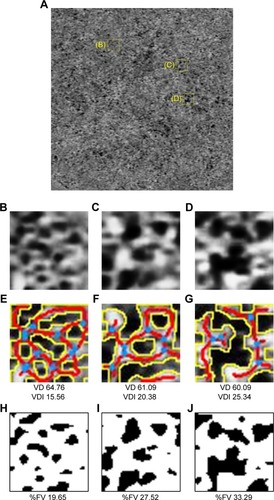
To verify the feasibility of measurements in focal lesions, a square range of 50×50 pixels was measured, in this case, from one eye with resolved CSC (). Three areas with CLAHE were chosen (). These images were accessed with AngioTool with vessel thickness 3–4 and intensity 15. The vessel densities in the three areas () were 64.76%, 61.09%, and 60.09%, respectively. The vessel diameter indices in the three areas () were 15.57 µm, 20.38 µm, and 25.34 µm, respectively. %FV of the images treated with Phansalkar’s method () increased in order from H (19.65%) to I (27.52%) to J (33.29%). As %FV increased, vessel density decreased and vessel diameter index increased.
Figure 4 Morphometrical evaluation of focal lesions.
Abbreviations: %FV, the percentage of flow void measured on the image thresholding; VD, vessel density; VDI, vessel diameter index.
Discussion
Previous analyses of the choriocapillaris on OCTA images have been done mainly with thresholding,Citation7,Citation8,Citation13,Citation14 which showed high reproducibility and repeatability. The ICCs of the flow voids showed high scores across healthy individuals and patients in this study. However, image evaluation with thresholding has some limitations. The thresholding results may change depending on the thresholding values or methods. Wang et alCitation14 reported a vessel density of 44.5%, but Alten et al reported a density of 99%.Citation8 In the current study, (100-%FV) was defined as the vessel density; it was 85.38% in the first image set and 85.56% in the second image set. Another issue regarding thresholding is the large variation in the measurements in images from healthy individuals.
The histologically measured diameters of the choriocapillaris were 8–20 µm,Citation15 whereas the lateral resolution of commercially available OCTA instruments is 15–20 µm.Citation11 Although the lateral resolution is insufficient to delineate the choriocapillaris completely, the linear structure of the choriocapillaris can be seen on SS-OCTA image; thus, morphometrical evaluation may be possible. AngioTool is open-source software using a fast, multiscale, Hessian-based filter with a fast recursive Gaussian filter for enhancement of the vessel structure.Citation9,Citation10,Citation16,Citation17 After vessel segmentation, the image was skeletonized and the morphometric parameters were analyzed. The recursive Gaussian filter is applied to choose the optimal size of the vessels to be measured, which is specified as the vessel thickness on the graphical user interface (GUI). The vessel intensity is also chosen by the user. We sought optimal parameters resulting in high reproducibility in the current study. In general, an ICC over 0.8 is interpreted as substantial agreement.Citation18 The measurements with vessel thickness 3–4 and intensity 15 showed high ICCs (over 0.8) and low CVs for each item of morphometrical evaluation in the healthy individuals, the patients, and across the combined group. The ICC was over 0.9 in each item measured in the combined group of healthy individuals and patients. Therefore, morphometrical evaluation is possible on the choriocapillaris images from SS-OCTA. Because intensity changes did not improve the results, the default value (15–255) was used in this study.
Vessel density in the choriocapillaris previously has been measured histologicallyCitation19 and on OCTA images.Citation8,Citation14,Citation20,Citation21 The mean vessel density in the healthy individuals in this study (mean age, 27.9 years) was 60.88%±0.65% (range, 59.60–62.23). Histologically, the mean vessel density at this age was 65.5%, which was calculated using the linear regression formula reported by Ramrattan.Citation19 The mean vessel density measured by adaptive optics (AO)-OCTA was 54.4% for subjects at similar ages to our subjects’, as calculated with a linear regression formula.Citation20 Uji et al reported that the vessel density was 61.9% when measuring with one spectral domain (SD)-OCTA image or 70.7% when measuring with the averaged image from healthy individuals whose mean age was similar to the mean age of the current healthy individuals.Citation21 Thus, the vessel density of healthy individuals in this study appears to be within the range from the histologic studyCitation19 and the studies using OCTA.
As reported previously, the vessels in the choriocapillaris are more densely packed in the posterior pole than in the periphery.Citation22 The regional variations of vessel density in the posterior pole are not fully understood. The vessel density at the foveal center was the same as that in the parafoveal area when the density was measured by thresholding on SD-OCTA images.Citation14 The vessel density in the choriocapillaris was slightly low at the foveal center on the SS-OCTA images,Citation23 which was consistent with our result. In the current study, the vessel density decreased and the lacunarity increased at the foveal center compared with those in the parafoveal area. Because the intercapillary distance at the fovea was reported to be 5–20 µm,Citation15 one possibility for the decrease in vessel density at the center of the fovea is that the current OCTA resolution could not isolate the blood vessels separately in this area. The decrement in the optical transparency of the RPE at the foveal center was considered as another reason.Citation21 The striations in the choriocapillaris are another issue. Projection of the overlying retinal vessels, which could not be removed completely by image processing, may affect the images of the choriocapillaris. The amount of projection artifact may differ based on the wavelength of the machine and the imaging algorithm. The choriocapillaris slab is 29–49 µm below the RPE in the Zeiss PLEX Elite 9,000. Adequate striation by this machine was not validated in the present study.
The vessel diameter index can reflect the diameter of the choriocapillaris, although vessel crossing or branching is not considered in this index. Histopathological studies have reported that the vascular diameter decreases with decreasing blood vessel density in elderly persons and patients with age-related macular degeneration.Citation19,Citation24 In contrast, the vessel density index appeared to increase as vessel density decreased in the group of patients (), whose mean age was significantly higher than that of the healthy individuals in the current study. The measurements using AO-OCTA also suggested that vessel diameter increased slightly with age.Citation20 We suggest three possibilities for increasing vessel diameter with age on OCTA images. One possible reason is associated with the resolution of the OCTA or high packing density of the choriocapillaris at the foveal center. Because thin intercapillary space may not be depicted, a few narrow vessels may be delineated as one vessel. As a result, the vessel diameter may seem to increase. Another possibility is a diversion of blood flow. We speculate that blood flow may disappear or decrease in histopathologically narrowed blood vessels, causing the blood flow in surrounding blood vessels to increase; thus, the surrounding blood vessel diameter may increase. The third possibility relates to the difference in the direction of observations. The vessel diameter was measured anteroposteriorly in histologic studies.Citation19,Citation24 However, the choriocapillaris is observed transversely on an OCTA image. If the lumen of the choriocapillaris decreases anteroposteriorly with aging or in patients with the disease, the blood vessel may flatten and the blood vessel diameter may appear thickened in en-face images.
This study had several limitations. The resolution of OCTA may be insufficient. Projection artifacts of the retinal vessels and the striation of the choriocapillaris were not studied. The correlation to histopathological models is needed to resolve these problems in the further studies.
Conclusion
In conclusion, images of the choriocapillaris on SS-OCTA images can be assessed with high reproducibility by morphometrical evaluation using open-source software that applies the multiscale Hessian enhancement. Automated morphometric analysis can provide an objective evaluation of the choriocapillaris.
Abbreviations
| CLAHE | = | contrast limited adaptive histogram equalization |
| CSC | = | central serous chorioretinopathy |
| CV | = | coefficient of variation |
| D | = | diopters |
| GUI | = | graphical user interface |
| ICC | = | intraclass correlation |
| OCT | = | optical coherence tomography |
| OCTA | = | OCT angiography |
| %FV | = | percentage flow void |
| SD | = | standard deviation |
| SD-OCT | = | Spectral-domain OCT |
| SS-OCTA | = | Swept-source OCTA |
Acknowledgments
The authors thank Claire Barnes, PhD, from Edanz Group (www.edanzediting.com/ac) for editing a draft of this manuscript. This work was supported by JSPS KAKENHI grant number JP17K11427. The funding organization had no role in the design or conduct of this research.
Disclosure
The authors report no conflicts of interest in this work.
References
- FlowerRWPhysiology of the developing ocular vasculatureBirth Defects Orig Artic Ser19882411291463140907
- HoganMJUltrastructure of the choroid. Its role in the pathogenesis of chorioretinal diseaseTrans Pac Coast Otoophthalmol Soc Annu Meet196142618713908216
- BorrelliEUjiASarrafDSaddaSRAlterations in the choriocapillaris in intermediate age-related macular degenerationInvest Ophthalmol Vis Sci201758114792479828973325
- PauleikhoffDSpitalGRadermacherMBrummGALommatzschABirdACA fluorescein and indocyanine green angiographic study of choriocapillaris in age-related macular diseaseArch Ophthalmol1999117101353135810532443
- KitayaNNagaokaTHikichiTFeatures of abnormal choroidal circulation in central serous chorioretinopathyBr J Ophthalmol200387670971212770966
- SpaideRFChoriocapillaris flow features follow a power law distribution: implications for characterization and mechanisms of disease progressionAm J Ophthalmol2016170586727496785
- Al-SheikhMAkilHPfauMSaddaSRSwept-Source OCT Angiography Imaging of the Foveal Avascular Zone and Macular Capillary Network Density in Diabetic RetinopathyInvest Ophthalmol Vis Sci20165783907391327472076
- AltenFHeiduschkaPClemensCREterNExploring choriocapillaris under reticular pseudodrusen using OCT-AngiographyGraefes Arch Clin Exp Ophthalmol2016254112165217327193430
- SatoYNakajimaSShiragaNThree-dimensional multi-scale line filter for segmentation and visualization of curvilinear structures in medical imagesMed Image Anal19982214316810646760
- ZudaireEGambardellaLKurczCVermerenSA computational tool for quantitative analysis of vascular networksPLoS One2011611e2738522110636
- SpaideRFFujimotoJGWaheedNKSaddaSRStaurenghiGOptical coherence tomography angiographyProg Retin Eye Res20186415529229445
- PlotnickREGardnerRHHargroveWWPrestegaardKPerlmutterMLacunarity analysis: A general technique for the analysis of spatial patternsPhys Rev E Stat Phys Plasmas Fluids Relat Interdiscip Topics1996535546154689964879
- SpaideRFIsing model of choriocapillaris flowRetina2018381798328169877
- WangQChanSYangJYVascular density in retina and choriocapillaris as measured by optical coherence tomography angiographyAm J Ophthalmol20161689510927183862
- OlverJMFunctional anatomy of the choroidal circulation: methyl methacrylate casting of human choroidEye19904Pt 22622722379644
- KhanKBKhaliqAAJalilAShahidMA robust technique based on VLM and Frangi filter for retinal vessel extraction and denoisingPLoS One2018132e019220329432464
- FrangiAFNiessenWJVinckenKLViergeverMAMultiscale vessel enhancement filteringWellsWMColchesterADelpSMedical Image Computing and Computer-Assisted Intervention, Lecture Notes in Computer ScienceBerlin, HeidelbergSpringer1998130137
- LandisJRKochGGThe measurement of observer agreement for categorical dataBiometrics1977331159174843571
- RamrattanRSvan der SchaftTLMooyCMde BruijnWCMulderPGde JongPTMorphometric analysis of Bruch’s membrane, the choriocapillaris, and the choroid in agingInvest Ophthalmol Vis Sci1994356285728648188481
- KurokawaKLiuZMillerDTAdaptive optics optical coherence tomography angiography for morphometric analysis of choriocapillaris [Invited]Biomed Opt Express2017831803182228663867
- UjiABalasubramanianSLeiJBaghdasaryanEAl-SheikhMSaddaSRChoriocapillaris imaging using multiple en face optical coherence tomography angiography image averagingJAMA Ophthalmol201713511119728983552
- YoneyaSTsoMOAngioarchitecture of the human choroidArch Ophthalmol198710556816873619746
- Al-SheikhMFalavarjaniKGPfauMUjiALePPSaddaSRQuantitative features of the choriocapillaris in healthy individuals using swept-source optical coherence tomography angiographyOphthalmic Surg Lasers Imaging Retina201748862363128810037
- SpraulCWLangGEGrossniklausHEMorphometric analysis of the choroid, Bruch’s membrane, and retinal pigment epithelium in eyes with age-related macular degenerationInvest Ophthalmol Vis Sci19963713272427358977488