
Abstract
Purpose
To present a home-based visual field examination method using a PC monitor or virtual reality glasses and evaluate the reliability of the method by comparing the results with those of the Humphrey perimeter, in order to assess the possibility of glaucoma screening through the Internet.
Materials and methods
Software implementing a supra-threshold algorithm for the central 24° (52 points) of visual field at three threshold levels: 1) −4 db, 2) −8 db, and 3) −12 db, from the age-expected sensitivity was used for the purpose of testing. The software uses the web camera as a “virtual photometer” in order to detect room luminosity and allows self-testing using a computer monitor or virtual reality glasses using an Android smartphone with a 6-inch display. The software includes an expert system to analyze the visual field image and validate the reliability of the results. It also allows the physician to combine the results from two or more tests into a single test in order to achieve higher statistical accuracy of the final result. A total of ten patients, 20 eyes tested×52 points per eye=1,040 visual field test points, were compared point to point to those obtained using the Humphrey perimeter for the same patients, as they appeared randomly and consecutively at the glaucoma department within hours.
Results
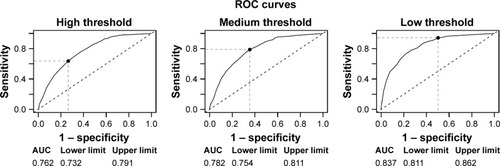
Good receiver operating characteristic/area under the curve coefficient was found, ranging from 0.762 to 0.837 (P<0.001). Sensitivity ranged from 0.637 to 0.942, and specificity ranged from 0.735 to 0.497.
Conclusion
The home-based visual field test exhibits a reasonable receiver operating characteristic curve when compared to the Humphrey perimeter, without the need of specialized equipment. The test may be useful for glaucoma screening.
Introduction
Glaucoma represents a diverse group of disorders that have common characteristic changes in the optic nerve neuroretinal rim tissue and is a major cause of blindness. It is estimated that half of glaucoma cases are undiagnosed.Citation1 The prevalence of glaucoma in the general US population 40 years of age and older is 2.1%, and ~2.4 million people in the US have undetected and untreated glaucoma.Citation2
Visual field testing remains one of the most important exams for determining the stage of glaucoma, the efficacy of medical or surgical treatment, and the prognosis, as well as for assessing the patient’s quality of life and his/her ability to perform the activities of daily living. Increasing the frequency of visual field testing leads to earlier detection of glaucoma progression.Citation3
The most widely used method to assess visual field deficits in glaucoma is automated perimetry. Despite the several advantages of automated perimetry, there are a few disadvantages. Often, it is tiring and difficult for patients to concentrate throughout the test and a large majority of the patients who have visual field test examination belong to the age group over 50. Automated perimeters are objective and accurate devices, but they are also bulky and heavy and are neither portable nor available for home use.
Online visual field testing is interesting for its potential to be used as a low-cost method for glaucoma screening. The potential benefits of an effective online telemedicine system are plentiful, especially in countries with high prevalence of glaucoma or in developing countries, and may save costs to patients and costs to the health care system as a whole.
In the past, various computerized visual field systems were tested, such as: 1) Peristat, 2) Visual Fields Easy (VFE), 3) Testvision.org, and so on.Citation4–Citation7
Peristat is an online visual field. It is based on Adobe/Flash technology and runs in a web browser. Flash technology is becoming obsolete. Adobe is planning to remove support for it by the end of 2020 and encourages content creators to migrate to new open formats such as HTML5. Flash technology had security issues. Chrome, Microsoft Edge, and Safari browsers have all been blocking Flash over the past year. In 2010, Steve Jobs banished Adobe Flash from the iPhone. It was too insecure, Jobs wrote, and too resource intensive.
VFE runs on a small smartphone screen (iPhone) which must be held steady by the patient using his/her hands throughout the whole test.
Testvision.org is a test based on ophthalmokinetic perimetry. It is based on Flash technology and has similar limitations to Peristat.
Visual field testing is affected by ambient luminosity. The test has to be performed under specific luminosity conditions in order to achieve standardization in testing conditions, but personal computers/smartphones do not have photometers. None of the previous systems has the ability to check room luminosity.
Visual field testing is also a subjective examination. The patient must be able to understand the testing instructions and must fully cooperate and complete the entire test in order to provide useful information. As a result, visual fields tests have high within-test and between-test variability and it is not rare to have false-positive or false-negative responses.Citation8–Citation10 For such reasons, the widespread use of these systems has been limited.
To overcome these issues, a telemedicine visual field test with novel features is presented in this paper. The system 1) uses the web camera as a “virtual photometer” to detect ambient luminosity in order to make sure that the test is performed under standard conditions (dark room); 2) analyzes the visual field image and validates the test results in order to prevent a patient from sending a test to his/her physician if the test was not performed correctly; and 3) allows the physician to combine the results from two or more tests into a single test to achieve higher statistical accuracy of the final result.Citation11 The test is based on Microsoft’s .NET technology as well as on Google’s Android platform.
The purpose of this study was to check the diagnostic ability of the test and calculate its receiver operating characteristic (ROC)/area under the curve (AUC) characteristics as well as the optimal cut-off points when compared with the Humphrey perimeter.
Materials and methods
To test the reliability of the method, proprietary software implementing a supra-threshold visual field test algorithm at three threshold levels, 1) −4 db (high level), 2) −8 db (medium level), and 3) −12 db (low level), from the age-expected sensitivity, at the central 24°/(52 points) of visual field was used.Citation12
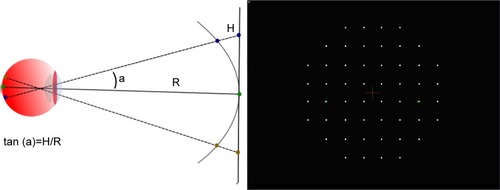
The points are projected using proper trigonometry calculations to compensate for classical perimeter bowl for liquid crystal display (LCD) monitor, so that the stimuli appear on the retina as if they were projected from a classical bowl perimeter. The white/gray stimuli were projected on black background ().
Figure 1 Trigonometry relation between display and bowl perimeter, 52 points 24° to be tested.
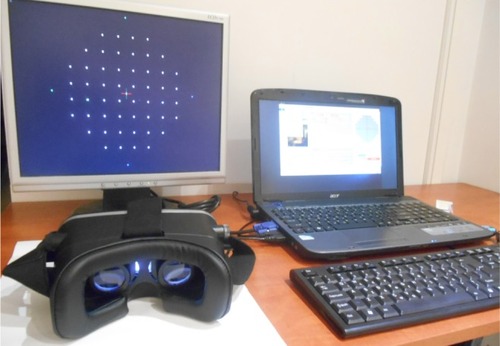
The software alternatively allows the use of virtual reality glasses with a 6-inch Android smartphone for visual field testing (). If the smartphone uses the same display technology (LCD) as the computer monitor, the results are expected to be comparable.
Figure 2 Monitor or virtual reality glasses can be used for visual field testing.
Display adjustment
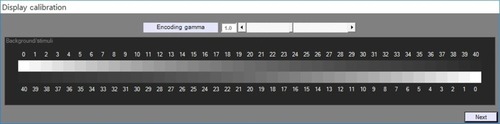
Visual field testing requires specific display luminosity settings. Gamma describes the relationship between the pixel levels and the luminance of the monitor (the light energy it emits). LCD displays show S-shaped curve between the input digital values and the output luminance unlike the conventional cathode ray tube monitor represented by a power function. The relationship between the voltage in an LCD pixel and the light intensity is an S-shaped curve that is nearly linear for the large region between the foot and shoulder of the s-curve.Citation13 For this reason, LCD displays are approximately linear devices. Contrast sensitivity decreases by age.Citation14 Brightness, contrast, and gamma were adjusted before testing using a step-wedge gray scale. The step-wedge gray scale has 40 distinct shades/steps of gray from black to white, with equal differences in brightness between each step. The display was adjusted so that all the shades of gray were distinct and clearly visible. This was about 50% of the maximum available brightness ().Citation15,Citation16
Figure 3 Display – gamma calibration using a gray scale step-wedge.
When the brightness is properly adjusted, 36–38 dB should be the approximate upper limit for contrast sensitivity in young observers.Citation12 Contrast sensitivity data between different perimeters are similar, albeit not exactly the same.Citation17–Citation20
Software features
Supra-threshold strategy, 52 points, central 24° of visual field (nasally and temporally from the fixation point), at three threshold levels, 1) −4 db (high level), 2) −8 db (medium level), and 3) −12 db (low level), from the age-expected sensitivity. White/gray on black background or black/gray on white background stimuli are available.
The software uses the Heijl–Krakau blind spot method to monitor fixation and head position by projecting the stimuli at maximum luminosity at possible blind spot locations until finding the correct response and adjusts stimuli positions and size automatically.Citation21
Supra-threshold stimuli are used to check for false-negative results. The software also checks for false-positive responses by recording positive responses when no response was expected.
Variable stimuli presentation rate, adjusted to patient’s response time.
Stimuli presentation time 250 ms.
Statistics. False positive, false negative, fixation losses.
Web camera used as virtual “photometer” to detect room luminosity, so that the test is performed under standard conditions (dark room) and records the (red, green, blue) luminosity data in the printout, to provide this information to the doctor.
An expert system to analyze the visual field image and detect tests that were not performed correctly.
The software allows the doctor to combine the results from two or more tests into a single test to achieve higher statistical accuracy.
Examination procedure
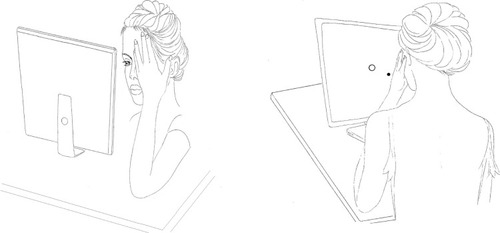
During testing, the user sits comfortably in front of a screen and stares at the central fixation point, while using a mouse to click whenever he/she sees a visual stimulus on the screen. The software has only manual response option. Each eye is tested separately. The users wear their near correction glasses if it is necessary. The eye that is not being tested is covered with the palm of the hand ().
Figure 4 Patient testing in front of a monitor.
All the patients tolerated the test well and they said they found the test simple and easy to perform. The user can test his/her visual field at home and send the results to his/her doctor for evaluation. If the results are not within normal limits, the doctor may advise the patient accordingly, whether or not further examinations are required.
Testing procedure
To find the right distance from the screen, the following procedure is used. The user closes/covers one eye and stares perpendicularly at the central cross target with the other eye. The user is aware of the blind spot dot, but he/she should not look at it. The user should instead keep his/her eye on the central target. Then, the user slowly moves toward the display, while still staring at the cross target with his/her open eye. At a distance, somewhere around 1–1.2× the height of the display from the computer screen, the blind spot dot will disappear and the area where the blind spot was will be all black. This is the right distance from the computer display. If the user moves closer to the screen or farther away, the blind spot dot will reappear. At just the right distance, the blind spot dot disappears. Peristat online perimetry test uses a similar procedure. Alternatively, the user places his/her eye at a distance ~1–1.2× the height of the display from the computer screen and stares perpendicularly at the central cross target. The software then locates the blind spot automatically by projecting the stimuli at possible blind spot locations and recording the responses until the user does not see the stimulus/blind spot. Then the locations and sizes of test points are adjusted automatically. If the user is out of limits (too far away or too near from the screen), the blind spot stimuli are visible. In that case, the process fails and a message appears. These methods cannot be applied if there is a scotoma affecting the blind spot or in hemianopic field defects. In that case, all that the patient can do is to place his/her eye at a distance ~1× the height of the display from the computer screen, stare perpendicularly at the center of the display, and start the test.
The user can select three sensitivity levels either under the guidance of his/her doctor or his/her self-preference. High sensitivity might detect shallow defects, but has more false-positive findings. Low sensitivity detects deep scotoma only, but has a lower false-positive findings rate. Medium sensitivity gives intermediate results. The system includes eye tracking capability using AForge.NET computer vision and artificial intelligence General Public License library and is able to track the pupil in order to set the central target’s location accordingly on the display ().
Figure 5 Examination form of the software, eye tracking.
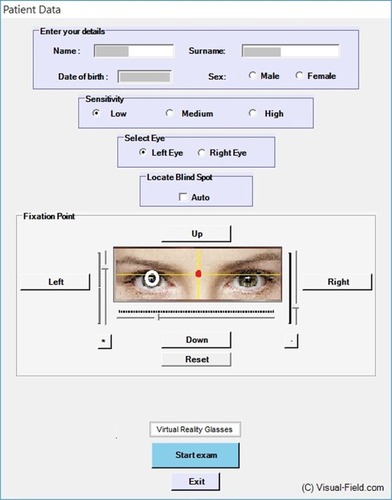
Test sensitivity is selected at the start of the test. The room should be dark during testing. The web camera is used as a “photometer” to check and record room luminosity before testing starts. The average RGB color values are calculated. RGB color values range from 0 (dark) to 255.
The tests were performed using a 22″ LCD display, albeit a smaller or bigger monitor could be used because the software can detect the blind spot automatically and calculate the distance between the display and the patient in order to adjust the locations of the projected points as well as their sizes automatically.
During testing, the software projects stimuli at the selected threshold level, at each point tested. If the patient clicks/sees the stimulus, the response is recorded as positive: 1; if the patient does not respond, it is recorded as a zero response: 0. Testing stops when a response, either 1 or 0, is recorded for each point. The purpose of the test is only to record whether the patient sees or does not see the threshold stimuli. The test is fast (2–3 minutes per eye) because only the selected threshold is tested at each point. The system checks for fixation losses by projecting stimuli at the blind spot. It also checks for false-positive responses and false-negative responses by projecting supra-threshold stimuli at points where the threshold stimulus is found to be visible.
The stimulus presentation rate is variable. The maximum response – waiting time is adjusted to the patient’s response time, within limits.
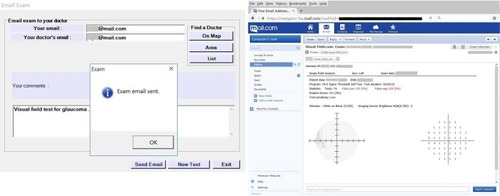
In the results/printout, false-negative test errors are marked in red, while false-positive test errors are marked in green, so that the doctor knows, for example, if a “scotoma” is due to a false-negative test error or a non-scotoma is due to a false-positive test error. Points where false-negative and false-positive errors were recorded are marked in yellow color. The exam output is binary (seen/clicked=1, not seen/not clicked/missed=0). At the end of the test, the image is analyzed and the results are validated in order to prevent a user from sending a test to his/her doctor, if the test was not performed correctly. A test is considered as “valid” if 1) the blind spot is detected/located at the expected position and 2) the false-positive, false-negative, and fixation losses are all <25%. If the test is valid, the user can send the test results by email (as an embedded image) to his/her doctor for review ().
Figure 6 Exam sent by email.
If the results are not within normal limits, the doctor will advise the patient accordingly whether or not standard automated perimetry and/or further/other examinations are required.
Study participants
Permission was obtained from the Scientific and Ethical Committee of the General Hospital of Athens “G. Gennimatas” to perform the study. Written informed consent was obtained from all participating patients, and the study adhered to the tenets of the Declaration of Helsinki.
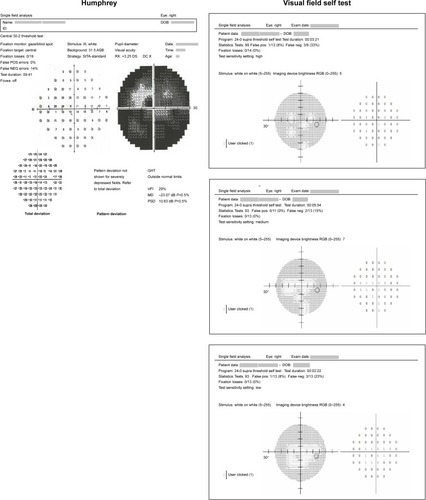
A total of ten patients, 20 eyes tested×52 points per eye=1,040 visual field test points, were compared point to point to those obtained using the Humphrey perimeter for the same patients as they appeared consecutively at the glaucoma department within hours for comparisonCitation22,Citation23 (). All the patients completed the test and were included in the study. The mean age was 67.9 years (SD=12, ranging from 47 to 81).
Figure 7 Eye 1 of 20. Humphrey field analyser test compared with three screening tests at high, medium, and low sensitivity levels (brightest stimulus, −12 dB).
The results from the visual field screening tests were binary (seen/not seen). ROC curves are widely used in the biomedical sciences and give us the ability to assess the performance of a binary classifier over its entire operating range using a graphical approach. The results were statistically analyzed and the ROC curves for each threshold level as well as the generalized Youden Index and the optimal cut points were computed using easyROC, an interactive, open-source web tool for ROC curve analysis using R Language Environment.Citation24 The easyROC uses the “OptimalCutpoints” software package to determine the cut-off values for diagnostic testsCitation25 (; ). The reliability indices were also calculated (). The results were similar, albeit not identical because the algorithms and the technology used were different.
Table 1 Threshold data at high, medium, and low sensitivity
Table 2 Reliability indices
Figure 8 ROC curves for each threshold.
Statistical analyses
The patients were tested successively using a Humphrey perimeter and the telemedicine method. Telemedicine visual field screening tests were 24° (52 points), while Humphrey field analyser (HFA) tests were 30° (76) points because the patients were tested with HFA as part of their scheduled/routine examination and not because of this study. Only the inner common (52) points matching the 24° central degrees between the HFA and the screening test were compared.
Results
The results show that the AUC was 0.762 (P<0.001) for high threshold, 0.782 (P<0.001) for medium threshold, and 0.837 (P<0.001) for low threshold.
In summary, we see that as the threshold tested gets lower, the sensitivity increases while the specificity decreases and vice versa. The optimal cut-off point for Humphrey data was 28 dB for the high threshold, 25 dB for the medium threshold, and 16 dB for the low threshold.
Black/gray stimuli on white background were also tested with similar results, but they are not included in this paper.
In practice, when a single test is used repeatedly in routine screening, the same screening threshold is typically used at each screening visit. One possible alternative is to adjust the threshold at successive visits according to individual-specific characteristics.Citation26 The test results can be combined in series or in parallel.Citation27 Parallel testing is recommended for ruling in diagnoses, while series testing is recommended for ruling out diagnoses.Citation28 The software allows the user to select and combine the results from two or more tests into a single test. The sum of positive responses at each point merged is shown.
Discussion
Telemedicine visual field screening testing has many similarities to classical bowl perimetry, but there are some differences due to the hardware used.
We presented a visual field test with novel features and evaluated the reliability of the method by comparing the results with those of Humphrey perimeter.
The purpose of the test is to help glaucoma patients become aware of their problem, albeit other disorders that affect the visual field might be detected as well.
The advantages of our system are that it uses the web camera as a “photometer” and validates the reliability of the results when the test is completed. This system also allows the patient to send the results to his/her doctor by email and allows the doctor to combine the results from two or more tests into a single test to achieve higher statistical accuracy.
The test is simple, easy, and fast and does not require specialized equipment. It only takes 2–3 minutes per eye and can be repeated as many times as needed. The patients were asked at the end of the test and they reported that it was easy and simple.
The test implements a supra-threshold visual field test algorithm at three sensitivity levels. It is intended to indicate whether there are findings in the visual field that might require further examinations. Standard automated perimetry test should be used to quantify the defects. The test is not intended to monitor the progression of diagnosed cases, but to be used as a screening test.
The optimal cut-off points as well as the ROC/AUC characteristics of this test were calculated when comparing the results with those obtained from the Humphrey perimeter for the same group of patients. ROC analysis is a widely used method for evaluating the accuracy of medical diagnostic systems. The most desirable property of ROC analysis is that the accuracy indices derived from this technique are not distorted by fluctuations caused by the use of arbitrarily chosen decision criteria or cut-offs. In other words, the indices of accuracy are not influenced by the decision criterion. Using this as a measure of a diagnostic performance, one can compare individual tests or judge whether the various combination of tests can improve diagnostic accuracy.Citation29 Good ROC/AUC coefficient was found, ranging from 0.762 to 0.837 (P<0.001). Sensitivity ranged from 0.63 to 0.94, and specificity ranged from 0.73 to 0.49.
Other systems have found similar results. Peristat online perimetry had comparable ROC curves and Spearman’s rank correlation coefficient ranging from 0.55 to 0.77 (all P<0.001) when compared with the Humphrey perimeter.Citation30 VFE, which is an iPad application for visual field testing, had ROC/AUC ranging from 0.687 to 0.784.Citation31,Citation32
The prevalence of glaucoma increases with age. It is most common in adults in their 70s and 80s. The main limitation of this test is that many older people never learned to use computers. Barriers may include physical and mental limitations. As with any other computer system, older people may still need a little help and support by younger people, family, or professionals who care for older adults.
Conclusion
The ROC characteristics of this low-cost test show it is reliable at least when compared with the Humphrey perimeter and does not require specialized equipment. The test may be useful for home-based glaucoma screening.
Data sharing statement
The datasets generated during and/or analyzed during the current study are available from the corresponding author on reasonable request. Non-profit institutions can freely avail the software by contacting the corresponding author or by sending an email to [email protected].
Ethics approval and consent to participate
Permission was obtained from the Scientific and Ethical Committee of the General Hospital of Athens “G. Gennimatas” to perform the study. Written informed consent was obtained from all participating patients, and the study adhered to the tenets of the Declaration of Helsinki.
Disclosure
The authors report no conflicts of interest in this work.
References
- ShaikhYYuFColemanALBurden of undetected and untreated glaucoma in the United StatesAm J Ophthalmol201415861121112925152501
- GuptaPZhaoDGuallarEKoFBolandMVFriedmanDSPrevalence of glaucoma in the United States: the 2005–2008 National Health and Nutrition Examination SurveyInvest Ophthalmol Vis Sci20165762905291327168366
- Nouri-MahdaviKZareiRCaprioliJInfluence of visual field testing frequency on detection of glaucoma progression with trend analysesArch Ophthalmol2011129121521152721825177
- Bruun-JensenJVisual field screening with a laptop computer systemOptometry201182951952721871394
- IanchulevTPhamPMakarovVFrancisBMincklerDPeristat: a computer-based perimetry self-test for cost-effective population screening of glaucomaCurr Eye Res20053011615875358
- VingrysAJHealeyJKLiewSValidation of a tablet as a tangent perimeterTransl Vis Sci Technol2016543
- DamatoBGroenewaldCMultifixation campimetry on line: a perimeter for the detection of visual field loss using the internetBr J Ophthalmol200387101296129814507769
- WallMKutzkoKEChauhanBCVariability in patients with glaucomatous visual field damage is reduced using size V stimuliInvest Ophthalmol Vis Sci19973824264359040476
- AndersonAJSignificant glaucomatous visual field progression in the first two years: what does it mean?Transl Vis Sci Technol2016561
- ChauhanBCGarway-HeathDFGoñiFJPractical recommendations for measuring rates of visual field change in glaucomaBr J Ophthalmol200892456957318211935
- ChristodouleasDCNemiroskiAKumarAAWhitesidesGMBroadly available imaging devices enable high-quality low-cost photometryAnal Chem201587189170917826241835
- AndersonAJJohnsonCAFingeretMCharacteristics of the normative database for the Humphrey matrix perimeterInvest Ophthalmol Vis Sci20054641540154815790927
- ToLWoodsRLGoldsteinRBPeliEPsychophysical contrast calibrationVision Res201390152423643843
- BowlingBKanski’s Clinical Ophthalmology: a systematic approach8th edUnited KingdomElsevier2016209
- XiaoKFuCKaratzasDWuergerSVisual gamma correction for LCD displaysDisplays20113211723
- ColomboEDerringtonAVisual calibration of CRT monitorsDisplays20012238795
- AndersonDRFeuerWJAlwardWLSkutaGLThreshold equivalence between perimetersAm J Ophthalmol198910754935052712132
- WongAYDodgeRMRemingtonLAComparing threshold visual fields between the Dicon TKS 4000 automated perimeter and the Humphrey Field AnalyzerJ Am Optom Assoc199566117067118576536
- LewisRAJohnsonCAKeltnerJLLabermeierPKVariability of quantitative automated perimetry in normal observersOphthalmology19869378788813763131
- BrentonRSArgusWAFluctuations on the Humphrey and Octopus perimetersInvest Ophthalmol Vis Sci19872857677713570687
- HeijlAKrakauCEA note of fixation during perimetryActa Ophthalmol1977555854861578643
- BlochDAComparing two diagnostic tests against the same “gold standard” in the same sampleBiometrics199753173859147604
- HanleyJAMcneilBJA method of comparing the areas under receiver operating characteristic curves derived from the same casesRadiology198314838398436878708
- GoksulukDKorkmazSZararsizGKaraağaoğluAEeasyROC: an interactive web-tool for ROC curve analysis using R language environmentR J201682213230
- López-RatónMRodríguez-ÁlvarezMXSuárezCCSampedroFGCadarso SuarezCGude SampedroFOptimalCutpoints: an R package for selecting optimal cutpoints in diagnostic testsJ Stat Softw2014618136
- ThompsonMLAssessing the diagnostic accuracy of a sequence of testsBiostatistics20034334135112925502
- LewisGSheringhamJBernalJLCrayfordTMastering Public Health: A Postgraduate Guide to Examinations and Revalidation2nd edBoca Raton, FLCRC Press/Taylor & Francis Group2014190191
- ZouKHBhagwatJGCarrinoJAStatistical combination schemes of repeated diagnostic test dataAcad Radiol200613556657216627197
- Hajian-TilakiKReceiver operating characteristic (ROC) curve analysis for medical diagnostic test evaluationCaspian J Intern Med20134262763524009950
- LowryEAHouJHenneinLComparison of Peristat online perimetry with the Humphrey perimetry in a clinic-based settingTransl Vis Sci Technol2016544
- KongYXHeMCrowstonJGVingrysAJA comparison of perimetric results from a tablet perimeter and Humphrey field analyzer in glaucoma patientsTransl Vis Sci Technol2016562
- JohnsonCAThapaSGeorge KongYXRobinALPerformance of an iPad application to detect moderate and advanced visual field loss in NepalAm J Ophthalmol201718214715428844641