Abstract
Background
The purpose of this study is to report the use of activity-based cost analysis to identify areas of practice efficiencies and inefficiencies within a large academic retinal center and a small single-specialty group. This analysis establishes a framework for evaluating rapidly shifting clinical practices (anti-vascular endothelial growth factor therapy, microincisional vitrectomy surgery) and incorporating changing reimbursements for care delivery (intravitreal injections, optical coherence tomography [OCT]) to determine the impact on practice profitability. Pro forma modeling targeted the impact of declining reimbursement for OCT imaging and intravitreal injection using a strategy that incorporates activity-based cost analysis into a direct evaluation schema for clinical operations management.
Methods
Activity-based costing analyses were performed at two different types of retinal practices in the US, ie, a small single-specialty group practice and an academic hospital-based practice (Bascom Palmer Eye Institute). Retrospective claims data were utilized to identify all procedures performed and billed, submitted charges, allowed charges, and net collections from each of these two practices for the calendar years 2005–2006 and 2007–2008. A pro forma analysis utilizing current reimbursement profiles was performed to determine the impact of altered reimbursement on practice profitability. All analyses were performed by a third party consulting firm.
Results
The small single-specialty group practice outperformed the academic hospital-based practice on almost all markers of efficiency. In the academic hospital-based practice, only four service lines were profitable, ie, nonlaser surgery, laser surgery, non-OCT diagnostics, and injections. Profit margin varied from 62% for nonlaser surgery to 1% for intravitreal injections. Largest negative profit contributions were associated with office visits and OCT imaging.
Conclusion
Activity-based cost analysis is a powerful tool to evaluate retinal practice efficiencies. These two distinct practices were able to provide significant increases in clinical care (office visits, ophthalmic imaging, and patient procedures) through maintaining efficiencies of care. Pro forma analysis of 2011 data noted that OCT payments to facilities and physicians continue to decrease dramatically and that this payment decrease further reduced the profitability for the two largest aspects of these retinal practices, ie, intravitreal injections and OCT retinal imaging. Ultimately, all retinal practices are at risk for significant shifts in financial health related to rapidly evolving changes in patterns of care and reimbursement associated with providing outstanding clinical care.
Introduction
Health care continues to remain a vital public health focus, with the emphasis on improving quality of care while reducing health care costs.Citation1,Citation2 This approach leads to a potential quandary for the practicing clinician because costs of care (new imaging technologies, expanding therapeutic armamentariums) continue to increase, while reimbursements (optical coherence tomography [OCT] imaging, intravitreal injections) continue to decline.Citation3 The ability of a practice or an individual physician to evaluate cost of care has not been a priority in typical medical practices.Citation4 It seems clear that in this evolving environment of health care, that an understanding of how clinical practice patterns contribute to the cost of care for individual diseases and even individual patients may allow the clinician, and practice, to appropriate limited resources with the potential for greatest impact.Citation5,Citation6 Analysis of retinal practices have focused on improvements in productivity but have often neglected the hidden practice costs associated with increased care delivery. Additionally, multiple therapeutic strategies are now available to the retinal specialist, often without an understanding of the associated practice costs.
Previous financial evaluations of practice profitability have focused on revenue-based cost assignment. Revenue-based cost assignment is limited by incorporation of an equal profit margin assumption that does not acknowledge differences within a practice associated with either above-average or below-average profitability of individual practitioners. Cooper and Kramer have argued that these “inaccuracies and distortions” in cost allocation are impact factors in the decision for higher-profit practitioners to depart the group practice.Citation7–Citation9 In Cooper and Kramer’s analysis, activity-based costing was utilized to allocate costs by individual activity directly, achieving an immediate shift in evaluation of practice profitability at the individual clinician level, as well as the practice level.Citation7
This paper presents an established method of cost calculation (activity-based costing) that is amenable to use in both physician-based and hospital-based retinal practices, irrespective of practice size. Activity-based costing is a cost calculation technique that associates costs with individual and grouped activities, known as cost centers.Citation10,Citation11 This technique enables an organization, or retinal practice, to determine actual costs of service on the basis of resources consumed.Citation12,Citation13 This accounting system has been applied to health care most recently in the evaluation of a large single-specialty retinal practice.Citation4 Activity-based costing provides the link between organizational revenue/expenses to enable a focus on efficiency/profitability.
Dugel and Tong utilized activity-based costing analysis to determine practice efficiencies and inefficiencies as they related to care of the patient with retinal disease within a single- specialty practice.Citation4 In this study, we apply activity-based cost analysis to two common retinal practice environments, ie, the small single-specialty retinal group and the large academic retinal center. Finally, we use pro forma analysis of the determined data set to model the impact of changes in reimbursement on the practice’s profit margin.
Methods
Activity-based costing analyses were performed at three different types of retinal practices in the US, ie, a small single-specialty group practice, a large single-specialty group practice, and an academic hospital-based practice. All analyses were performed by a third party consulting firm (Quorum Consulting Inc, San Francisco, CA).
Due to unique differences in the operational structures of these practices, there was slight variation in the specific methodologies applied, but the general concept remained the same. Dugel and Tong provided the methodology for the study performed at the large single-specialty group practice, and here we describe the application of these methods in evaluating two unique study sites.Citation4
Identification of primary activity centers
As in the study described by Dugel and Tong, we identified seven distinct revenue-generating activities for retinal physicians (hereafter referred to as service lines), ie, nonlaser surgery, laser surgery, evaluation and management (OCT), non-OCT diagnostics, intravitreal injections, and research.Citation4 Each service line was populated by the relevant group of Current Procedural Terminology (CPT) and Healthcare Common Procedure Coding System (HCPCS) codes for procedures that are described by the general service category. While research services were identified as a separate service line, we did not include it in any of our analyses because we chose to focus solely on the core retinal services that would be provided at both academic and nonacademic hospitals.
Small single-specialty group practice
Data sources
The analysis was conducted at a two-physician retinal practice located in the Western US. We reviewed calendar year (CY) 2005 and CY 2007 physician claims and expense reports for all retinal services performed in those timeframes. These claims were then analyzed to identify CPT and HCPCS codes billed, submitted charges, allowed charges, and net collections.
Revenue allocation methodologies
The physician claims billed by the two retinal physicians at this practice were analyzed to identify the revenues generated by each service line in both CY 2005 and CY 2007 based on the payment amounts collected for each relevant CPT and HCPCS code billed.
Cost allocation methodologies
The cost allocation methodologies that were applied to this practice mirror those employed at the large single-specialty group practice as described by Dugel and Tong. In order to assign practice costs across individual service lines in CY 2007 (the only year for which we were able to obtain detailed practice expense reports), physician salary expenses were allocated based on the distribution of relative value units for all CPT codes billed in that year, rental expenses were allocated according to the percentage of physician office space used per service line, and nonphysician staff salaries were allocated by the estimated time spent on each service line. Relative value units are used by the Centers for Medicare and Medicaid Services in the US as a metric for the extent of physician time and effort involved in each procedure reported by a CPT or HCPCS code. Therefore, in the absence of prospective measurements of physician time, we believed that a relative value units-based methodology would be appropriate to identify the distribution of physician time across the six service lines.
Academic hospital-based practice
Data sources
The analysis was conducted at a 100-bed ophthalmology specialty hospital affiliated with a tertiary academic center located in the Southeastern US. We reviewed fiscal year (FY) 2006 and FY 2008 data from the hospital claims billing systems and general ledger to obtain information on the revenues and expenses for the hospital’s retinal practice. Both facility and physician claims were reviewed in this case.
Nine physicians common to both the facility and physician claims datasets in FY 2006 and FY 2008 were identified as full-time providers representative of retinal practice at the hospital. Using relative value units as a proxy for physician time based on the CPT codes billed by each physician, we were able to identify three distinct types of retinal service patterns that correspond to three physician subgroups: a “surgical” group focused mainly on surgical therapy (greater than 65% of relative value units allocated to the nonlaser and laser surgery service lines); a “medical” group that predominantly provided medical therapy (greater than 50% of relative value units allocated to injections); and a “mixed” group characterized by approximately equal provision of surgical and medical therapies. Specifically, we identified two physicians in the surgical group, one in the medical group, and six in the mixed group. See for each group’s overall distribution of relative value units across service lines.
Table 1 Relative value unit distributions by retinal physician subgroup
Revenue allocation methodologies
All hospital and physician claims billed by the nine retinal physicians were extracted, and the corresponding revenues assigned to one of the six core service lines based on the payment amounts collected for each relevant CPT and HCPCS code billed. This was done for claims in both FY 2006 and FY 2008, with the resulting revenue allocations further broken down by the three physician subgroups.
Cost allocation methodologies
Physician expenses comprised salary and benefit costs. Estimated annual salary figures in FY 2008 for each of the nine retinal physicians were provided by the academic center, and benefits were determined to represent an additional 39% of salary costs.
As discussed above, we decided to use a relative value unitsbased methodology to estimate the distribution of physician time across service lines. We calculated the total relative value units associated with each service line (identified by groups of related CPT codes) for each physician and physician subgroup, thus providing an approximate distribution of time by which we allocated physician expenses in FY 2008. To determine the overall distribution of time for all physicians, the total relative value units associated with each service line was divided by the sum of the relative value units for all services.
The hospital provided FY 2008 expense reports for all 113 departments, of which we identified 10 as direct cost contributors to the retinal practice, 75 as indirect cost contributors, and the remaining 28 as zero cost contributors.
To determine the facility costs contributed to each service line by each indirect cost department, we first calculated the proportion of CPT/HCPCS units billed by the nine retinal physicians divided by the total number of units billed by all physicians who appeared in the entire hospital claims dataset for FY 2008 (which includes physicians who did not provide retinal services). This ratio was then multiplied by each indirect cost department’s reported total annual expenses to obtain the cost amount attributable to the retinal practice. The same methodology was used to delineate further the indirect costs associated with the surgical, medical, and mixed retinal physician subgroups, respectively.
To allocate direct facility costs, we employed two main methodologies that we refer to as “proxy” and “unit cost” allocations. For the proxy allocation, we consulted with the hospital’s accounting staff to identify several ratios that, where reasonable, could be applied to break out retinal-related expenses from the overall costs reported by direct cost departments. These ratios or proxies include:
Retinal service charges to total hospital charges
Retinal inpatient charges to total hospital inpatient charges
Retinal service square footage to total hospital square footage
Number of retinal patient visits to total number of hospital patient visits
Number of retinal surgery cases to total number of hospital surgery cases
In some cases, estimates were provided directly by the department manager instead (eg, 15% of expenses incurred by the physician logistics department may be attributable to retinal services).
After using one of these proxies to identify the retinal-related portion of a direct cost department’s overall expenses, retinal practice expenses were then allocated across service lines based on the distribution of the number of CPT/HCPCS units billed on hospital claims in FY 2008 (since each CPT/ HCPCS code is assigned to a specific service line).
When retinal-related expenses for a particular department could not be broken out from the total department costs by applying a proxy allocation, we used a “unit cost” approach to determine the amount attributable to each retinal service line. To do so, we first calculated the number of staff hours worked per “service unit” within each service line based on the staff time data provided by the hospital for each department. For each service line, the proportion of this figure to the total number of staff hours worked by the department was then multiplied by the total expenses incurred by that department to arrive at the per unit cost. Therefore, where applicable, the retinal-related departmental expenses associated with each service line is the sum of the per unit cost multiplied by the corresponding number of service units billed on hospital claims in FY 2008. See for a summary of the expense allocation schemes applied to each of the 10 hospital departments contributing direct costs to the retinal practice.
Table 2 Expense allocation schemes for direct cost departments
Pro forma estimate of impact of changes in Medicare payment rates in 2011
Much has been written about changes in CPT coding and Medicare reimbursement rates for ophthalmology services. In particular, three new CPT codes were issued effective 2011 for OCT procedures replacing CPT code 92135. The greatest impact on revenues of these new codes is in the fact that they now represent unilateral or bilateral procedures, whereas previously OCT was a unilateral procedure that could be billed and reimbursed twice for the same patient during the same encounter. Given these recent changes, we also modeled the revenue and profitability implications of Medicare reimbursement rates in 2011, assuming the same volume of services and no changes in commercial payment.
Results
Small single-specialty group practice
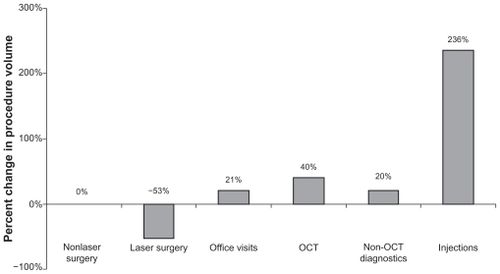
Between CY 2005 and CY 2007, total procedure volume at this practice (as indicated by the number of CPT units billed in each year) increased by a modest 24%. However, within individual service lines, injections saw the most dramatic increase of 236%, with the exception of laser surgery, which actually decreased by 53%, the volume of all other service lines (nonlaser surgery, office visits, OCT, non-OCT diagnostics) increased by 0%–40%, ().
Figure 1 Small single-specialty group practice: percent change in procedure volume.
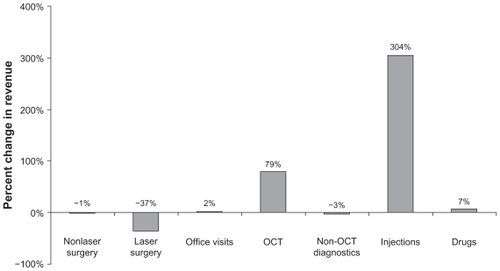
Aligned with these trends in procedure volume changes between CY 2005 and CY 2007, the largest percentage increase in revenue was observed for injections (304%), while OCT was a distant second with a 79% increase in the same timeframe. Of the four remaining service lines, except for office visits, all saw less revenue in CY 2007 compared with CY 2005. We also observed a 7% increase in reimbursements received for drugs as a standalone revenue source ().
Figure 2 Small single-specialty group practice: percent change in revenue.
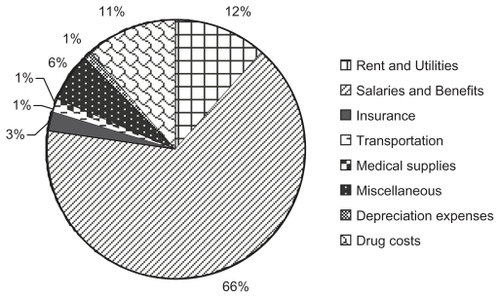
Based on practice expense reports obtained for CY 2007, the majority of practice costs were attributed to office visits (33%), followed by injections (17%) and non-OCT diagnostics (17%). Alternatively, when analyzing the specific cost centers that constitute practice expenses, salaries and benefits contributed a 66% majority, followed by rent and utilities (12%) and drug acquisition costs (11%). See and for the detailed cost breakdowns by individual service lines and cost centers, respectively.
Figure 3A Small single-specialty group practice: distribution of costs by service line.
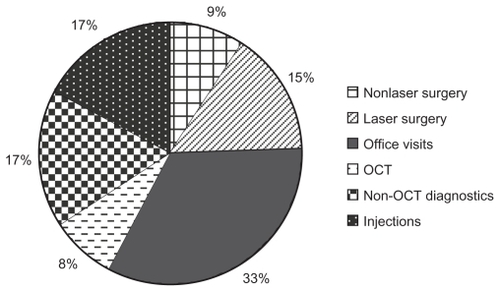
Figure 3B Small single-specialty group practice: distribution of costs by cost center.
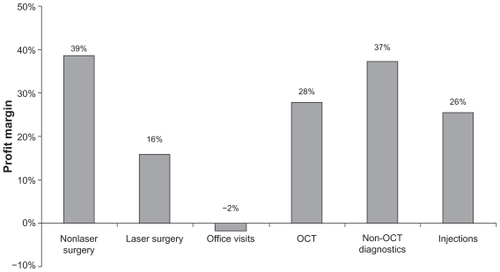
Overall, with the exception of office visits, all service lines were profitable at this small retinal group practice in CY 2007. Profit margin (profit divided by revenue) is an economic measure of how efficiently revenue is converted into profit, or in this case, how efficiently costs are controlled for a particular service line. At this practice, nonlaser surgery demonstrated the highest profit margin at 39%, whereas office visits had the lowest at −2%. All other service lines (laser surgery, OCT, non-OCT diagnostics, and injections) had profit margins in the range of 16%–37% ().
Figure 4 Small single-specialty group practice: profit margin across service lines.
Academic hospital-based practice
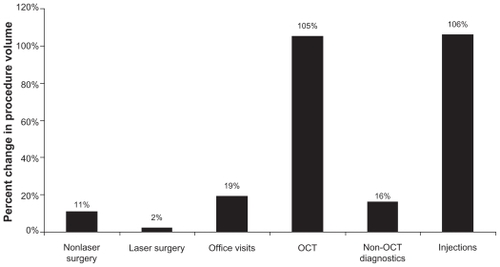
Between FY 2006 and FY 2008, all service lines grew in terms of procedure volume, and injections and OCT saw the most significant increases of 106% and 105%, respectively, while laser surgery increased by the smallest margin of 2% ().
Figure 5 Academic hospital-based practice: percent change in procedure volume.
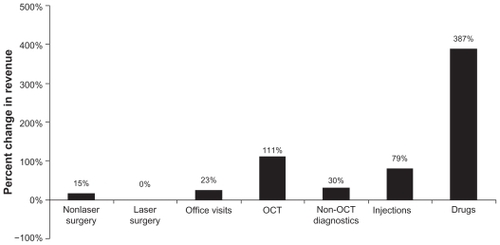
These results were generally mirrored in the growth trends in revenue observed in this timeframe. In this section, revenues refer to the aggregate payments received for both facility and physician claims billed. Due to the significant increase in intravitreal injections performed, drug revenue at this practice saw a dramatic increase of 387% that was largely driven by rising collections for ranibizumab. Following drugs, revenues for OCT and injections experienced growth of 111% and 79%, respectively ().
Figure 6A Academic hospital-based practice: percent change in revenue.
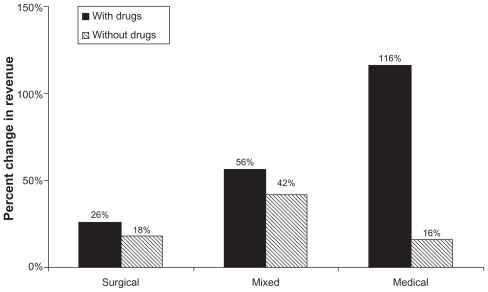
We also analyzed overall changes in revenue for each retinal physician subgroup, and subsequently observed the largest percentage increase in total revenue for the medical group (116%) when collections for drugs were taken into account, followed by the mixed (56%) and surgical (26%) groups. This finding is not surprising in light of the significant revenue contributions provided by the highly reimbursed drugs used for intravitreal injections. However, when drug collections were excluded from the revenue analysis, the mixed group offered the largest percentage increase in total revenue (42%), whereas the medical group saw the smallest growth (16%). See for an overview of revenue changes for each retinal physician subgroup.
Figure 6B Academic hospital-based practice: percent change in revenue by retinal physician subgroup.
Total expenses incurred at this academic hospital-based practice include both facility (eg, medical supplies, operating room overheads) and physician costs (physician salaries, benefits). The majority of total practice expenses in FY 2008 were contributed by injections (28%), with office visits a close second (25%). Laser surgery represented the lowest-cost service line, constituting 4% of total expenses ().
Figure 7A Academic hospital-based practice: distribution of costs by service line.
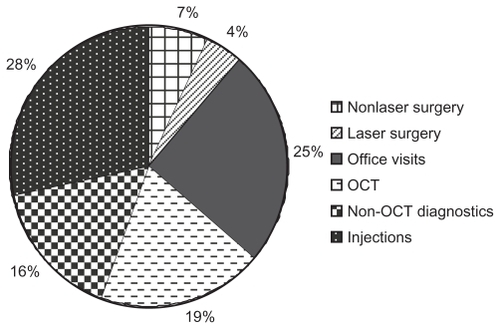
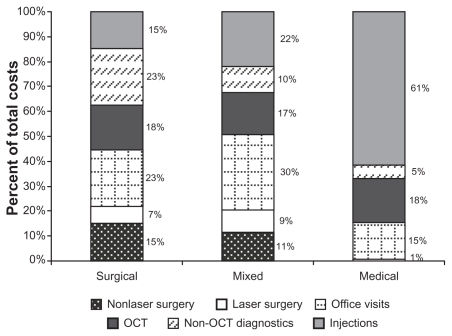
When evaluating the distribution of costs for each retinal physician subgroup, office visits were the majority cost contributor in both the surgical and mixed groups, with shares of 23% and 30%, respectively (for the surgical group, however, non-OCT diagnostics also tied with office visits to represent 23% of total costs). In contrast, injections constituted the highest percentage of total costs in the medical group by far at 61% ().
Figure 7B Academic hospital-based practice: distribution of costs by retinal physician subgroup.
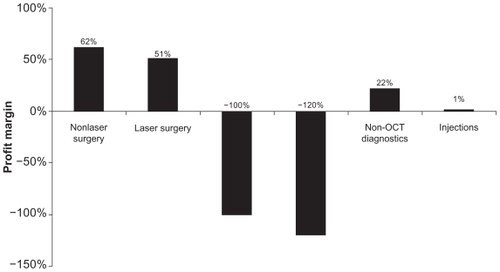
Overall, only four service lines, ie, nonlaser surgery, laser surgery, non-OCT diagnostics, and injections, were profitable at this academic hospital-based practice in FY 2008; losses were incurred in both office visits and OCT. A profit margin analysis identified nonlaser surgery as the service line with the highest profit margin (62%), followed by laser surgery (51%) and non-OCT diagnostics (22%), see . Injections, the only other profitable service line, demonstrated a very low profit margin of 1%. In line with the negative profit contributions associated with office visits and OCT, both of these service lines were found to have profit efficiencies of −100% or less.
Figure 8 Academic hospital-based practice: overall profit margin across service lines.
Pro forma estimate of the impact of changes in Medicare payment rates in 2011
There were several changes in Medicare reimbursement rates that affected retinal providers which became effective in January 2011. Each year, the Centers for Medicare and Medicaid Services adjusts hospital (facility) reimbursement rates under the Outpatient Prospective Payment System. These rates have typically gone up across the board, given higher labor and other costs incurred by hospital facilities.
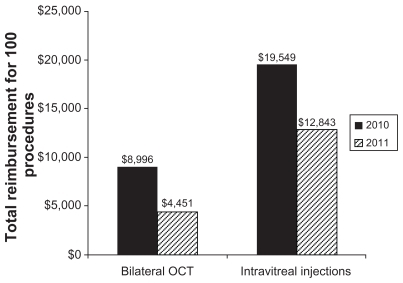
However, physician professional fees can vary year to year based on a myriad of inputs including: changes to relative value units, often performed every five years as part of routine updates; changes in the conversion factor, which has been a political “football” given controversies surrounding the sustainable growth rate; and changes in CPT coding and other limitations, which may affect rules surrounding when procedures may be billed during the same patient encounter. One of the biggest changes in ophthalmology, effective January 1, 2011, was that the single OCT CPT code was withdrawn in 2011 and replaced by three separate codes, one each for the optic nerve, retina, and anterior segment. More importantly, the new OCT codes were written to include the phrase “unilateral or bilateral”, resulting in a single payment regardless of whether the OCT was performed unilaterally or bilaterally. Hence, while the Centers for Medicare and Medicaid Services payment levels for the new codes are similar to what was previously paid for CPT 92135, the new codes have effectively reduced reimbursements by about 50% if patients are imaged bilaterally (https://www.cms.gov/MLNProducts/65_ophthalmology.asp), see .
Figure 9 Medicare national physician payment for bilateral OCT and intravitreal injections between 2010 and 2011.
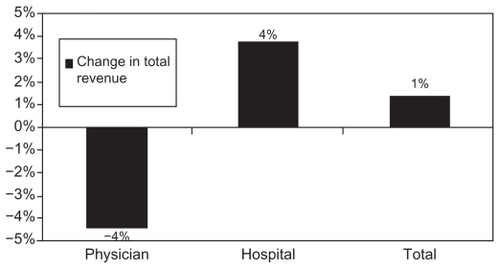
indicates the impact on Medicare revenues and hospital profits when adjusting for 2011 Medicare payment rates. Non-Medicare payments, volume of services, and expenses were held constant based on 2008 data. While hospital facility rates have increased slightly, changes to OCT coding show the greatest negative impact. Furthermore, across the three different practice types, medical practices were most impacted (negatively) compared with surgical and mixed practices (see –, – and –). As expected, contribution to profit also changed, shifting away from OCT.
Figure 10 Average change in Medicare reimbursement between 2008 and 2011 across service lines.
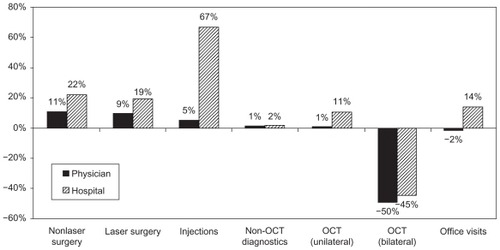
Figure 11A Mixed practice: 2008 distribution of revenue by service line.
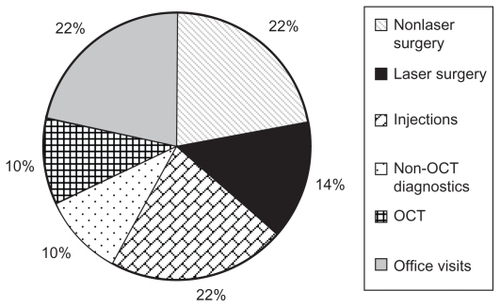
Figure 11B Mixed practice: 2011 distribution of revenue by service line (assuming OCT procedures are performed bilaterally).
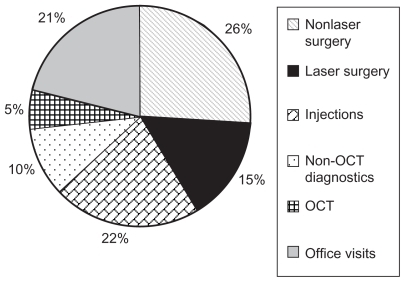
Figure 11C Mixed practice: change in total revenue between 2008 and 2011.
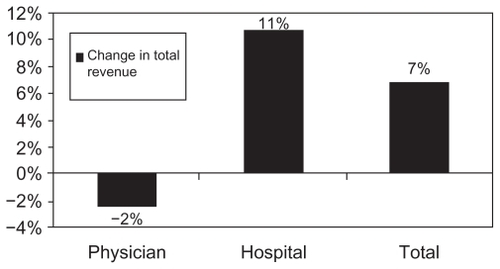
Figure 12A Surgical practice: 2008 distribution of revenue by service line.
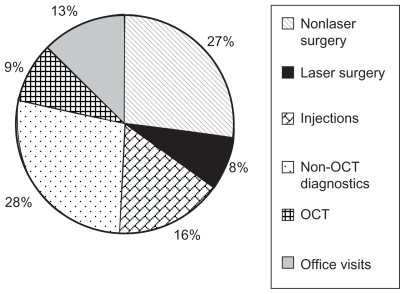
Figure 12B Surgical practice: 2011 Distribution of revenue by service line (Assuming OCT procedures are performed bilaterally).
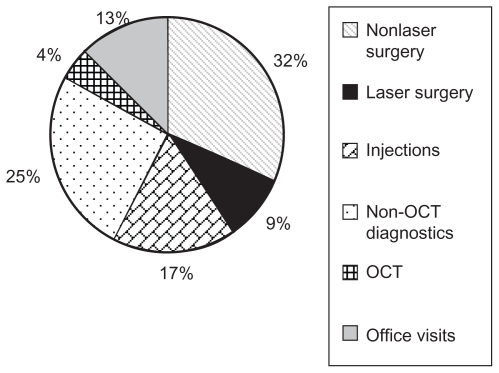
Figure 12C Surgical practice: change in total revenue between 2008 and 2011.
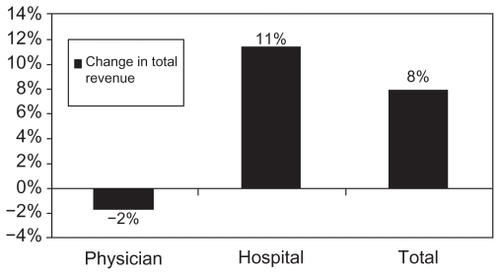
Figure 13A Medical practice: 2008 distribution of revenue by service line.
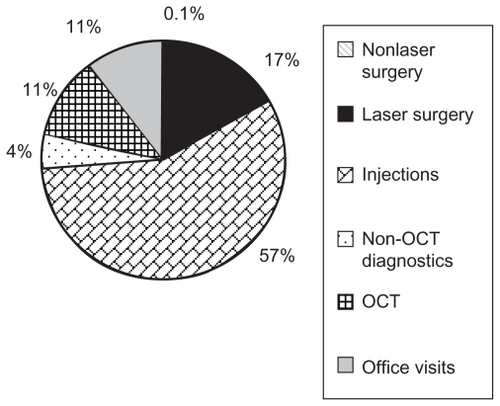
Figure 13B Medical practice: 2011 distribution of revenue by service line (assuming OCT procedures are performed bilaterally).
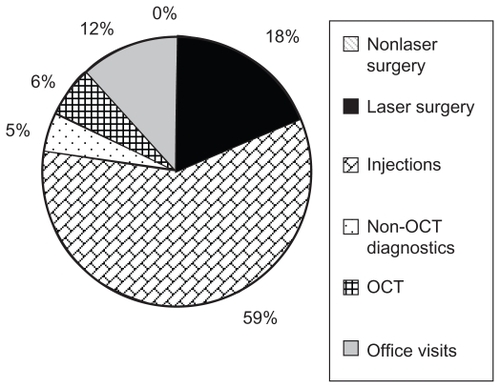
Figure 13C Medical practice: change in total revenue between 2008 and 2011.
Discussion
Ophthalmology in general, and retinal in particular, have seen tumultuous changes in practice patterns over the last five years. Most significantly, advances in diagnostic imaging (OCT), intravitreal pharmacotherapy (bevacizumab/ranibizumab/triamcinolone acetonide) and vitreoretinal surgery (microincisional vitrectomy surgery) have fundamentally changed the practice patterns of most retinal specialists.Citation14 These changes have had a profound impact on clinical volumes (increasing follow-up intervals for many disease processes from every six months to every four weeks), treatment paradigms (shifting from laser/ observation to intravitreal injection), and diagnostic evaluations (moving from fluorescein angiography to OCT imaging) that have required increasing practice overheads by expanding clinical space, front and back office billing, and administrative personnel, and increased technology (OCT units) and specialized nursing care (intravitreal injections).Citation15–Citation19
Evaluating the impact of this changing clinical environment is difficult and has been beyond the purview of most clinicians.Citation20,Citation21 Advances in health care economic practices have utilized various instruments to determine the impact of clinical patient care on practice profitability.Citation22–Citation24 Previously, activity-based costing was used by Dugel and Tong to assess the impact of these changes on a large single-specialty retinal practice. In this study, the authors noted an increase in practice collections of over 42% during the study interval which, due to increases in operating costs and decreasing reimbursement, led the practice to an overall decline in profit margin by 14%.Citation4 Activity-based costing allows for specific evaluation of service line impacts on overall practice profitability, but is also targeted to evaluate the actual and modeled impact of changes in each practice procedure (ie, increasing frequency of intravitreal injections versus decreasing frequency, decreasing reimbursement for OCT, impact of novel therapy such as vascular endothelial growth factor trap (including treatment cost, treatment interval, and imaging analysis).
Pro forma modeling, utilizing activity-based costing, allows the practice to determine the impact of changes in clinical care provision, “overhead” operating costs, and reimbursement. There were significant changes in reimbursement for 2011, “highlighted” by reduced reimbursements for intravitreal injection (67028) and posterior segment OCT imaging (92135 to 92133/4). Reimbursement for intravitreal injections showed a decline from approximately $159 in 2010 to $107 in 2011. The coding change for OCT imaging from a unilateral code (92135) in 2010 to “unilateral OR bilateral” codes (92133/4) in 2011 means that reimbursement for bilateral OCT imaging is essentially halved because the reimbursement rate is now the same regardless of whether the procedure is performed on one or both eyes. The recent devaluations in many ways portend the future for retinal specialists. Particular targets for revaluation of reimbursement include rapidly evolving usage which, for intravitreal injection, went from approximately 4000 procedures in 2000 to approximately 1,000,000 in 2010. OCT imaging skyrocketed during a similar period, with approximately 150,000 procedures in 2000 to over 8,000,000 procedures in 2008. Based on our analysis of the 2003–2009 Physician/ Supplier Procedure Summary for CPT codes 67028 (intravitreal injection) and 92135 (OCT), the Centers for Medicare and Medicaid Services allowed units increased from 38,799 in 2003 to 1,297,524 in 2009 for intravitreal injections, while for OCT imaging Centers for Medicare and Medicaid Services allowed units increased from 2,163,115 in 2003 to 7,687,443 in 2009.
Limitations to this study focus on the choice of both a single academic retinal service (Bascom Palmer Eye Institute, University of Miami Miller School of Medicine) and a small, community-based retinal practice (Tornambe Eye Institute). We chose these two practices to delineate better the breadth of retinal clinical practice approaches to establish the viability of activity-based cost analysis (to establish financial parameters) and to evaluate efficiencies of care. Activity-based costing analysis was previously applied by Dugel and Tong to evaluate a large, community-based retinal practice. In all three settings, varied efficiencies of each practice were established, but overall analysis established several defining practice patterns, ie, increasing clinical volumes, decreasing reimbursement for OCT and intravitreal injections, increasing operating overheads (office space, support staff, coding/billing), and declining retinal practice profitability. Uniquely, we did not see regional influences on practice patterns and reimbursement that could potentially have skewed the data analysis. Finally, although we accounted for salary and benefits within our activity-based costing analysis, we did not incorporate nonclinical revenue sources that are ubiquitously present in current academic retinal and community-based retinal practices. These support dollars often negate significant clinical losses to enable overall profitability of an academic department. These dollars are outside of the impact of clinical care delivery and reimbursement. Nonetheless, these limitations are critically important in the extrapolation of these data widely within the retinal community.
In ophthalmological retinal care practices, the major clinical focus has been provision of outstanding patient-focused clinical care. Cost issues in care provision have been largely ignored in the decision-making for patient care in this evolving environment. This focus on best patient care continues to be a hallmark of retinal care delivery. Nonetheless, an understanding of the potential and real impact of changes in practice costs and reimbursements is critical to the economic survival of our best academic and clinical practices. Evolving efficiencies in clinical practice will continue to push the ophthalmologist’s approach to declining reimbursement and increasing practice costs. Unique approaches to care delivery have recently been employed and have come under targeted scrutiny, most notably pharmaceutical-based rebate programs in the management of neovascular AMD (http://www.aao.org/newsroom/release/20101223.cfm). Rebate programs of this nature were not included in the pro forma analysis, but have major practice reimbursement impact. Ultimately, alternative strategies for reimbursement may be necessary as treatment costs escalate in the face of expanding at-risk patient populations.
Conclusion
In this study, assessing a critical window of change in the retinal field, a large academic hospital-based retinal center and a small single-specialty retinal group were evaluated with activity-based cost analysis to establish the impact of these changing clinical environments on the economic health of these practices. The understanding of the interface between cost of care and its impact on clinical decision-making is likely to become a pivotal point in the retinal specialist’s ability to navigate rapidly changing health care policy during this decade.
Disclosure
The authors report no conflicts of interest in this work.
References
- WagnerAKGravesAJReissSKLecatesRZhangFRoss-DegnanDAccess to care and medicines, burden of health care expenditures, and risk protection: results from the World Health SurveyHealth Policy20111002–315115820828854
- ErlyanaEDamrongplasitKKMelnickGExpanding health insurance to increase health care utilization: will it have different effects in rural vs urban areas?Health Policy20111002–327328121168932
- SinaikoADRosenthalMBIncreased price transparency in health care – challenges and potential effectsN Engl J Med20113641089189421388306
- DugelPUTongKBDevelopment of an activity-based costing model to evaluate physician office practice profitabilityOphthalmology2011118120320820709400
- GinsburgPBRapidly evolving physician-payment policy – more than the SGRN Engl J Med2011364217217621142529
- GinsburgPBWide variation in hospital and physician payment rates evidence of provider market powerRes Briefs20101611121117341
- CooperRKramerTRRevenue-based cost assignment: a potent but hidden threat to the survival of the multispecialty medical practiceAcad Med201085353854720182135
- CooperRKramerTRRevenue-based cost assignment: the hidden and inaccurate equal-profit-margin assumptionMGMA Connex200884447
- CooperRKramerTRRBRVS costing: the inaccurate wolf in expensive sheep’s clothingJ Health Care Finance200834361818468375
- GrandlichCUsing activity-based costing in surgeryAORN J200479118919214763586
- LievensYvan den BogaertWKestelootKActivity-based costing: a practical model for cost calculation in radiotherapyInt J Radiat Oncol Biol Phys200357252253512957266
- EmmettDForgetRThe utilization of activity-based cost accounting in hospitalsJ Hosp Mark Public Relations2005152798916201419
- CaoPToyabeSKurashimaSOkadaMAkazawaKA modified method of activity-based costing for objectively reducing cost drivers in hospitalsMethods Inf Med200645446246916964366
- SturzlingerHGenserDFroschlBEvaluation of optical coherence tomography in the diagnosis of age related macula degeneration compared with fluorescence angiographyGMS Health Technol Assess20073Doc0221289936
- PatelJJMendesMABounthavongMChristopherMLBoggieDMorrealeAPCost-utility analysis of bevacizumab versus ranibizumab in neovascular age-related macular degeneration using a Markov modelJ Eval Clin Pract9162010 [Epub ahead of print]
- MyungJSBhatnagarPSpaideRFLong-term outcomes of intravitreal antivascular endothelial growth factor therapy for the management of choroidal neovascularization in pseudoxanthoma elasticumRetina201030574875519996818
- SpaideRFThe as-needed treatment strategy for choroidal neovascularization: a feedback-based treatment systemAm J Ophthalmol200914811319540983
- BrownGBrownMMLet us wake the nation on the treatment for age-related macular degenerationCurr Opin Ophthalmol201021316917120397317
- BrownMMLuoBBrownHCBrownGCComparative effectiveness: its role in the healthcare systemCurr Opin Ophthalmol200920318819419425205
- ShipmanSALanJChangCHGoodmanDCGeographic maldistribution of primary care for childrenPediatrics20111271192721172992
- BrownMMBrownGCLeiskeHBLieskePAHealthcare costs, buyer alertCurr Opin Ophthalmol201122314915121460725
- CruessAFZlatevaGXuXEconomic burden of bilateral neovascular age-related macular degeneration: multi-country observational studyPharmacoeconomics2008261577318088159
- CruessAZlatevaGXuXRochonSBurden of illness of neovascular age-related macular degeneration in CanadaCan J Ophthalmol200742683684318026200
- CunninghamPJFellandLEGinsburgPBPhamHHQualitative methods: a crucial tool for understanding changes in health systems and health care deliveryMed Care Res Rev2011681344021075752