Abstract
Background
The purpose of this study was to investigate the correlations between microcirculation in the optic disc, average peripapillary retinal nerve fiber layer thickness cupping parameters, and visual field defects in glaucoma patients with the generalized enlargement disc type.
Methods
A total of 38 eyes from 38 glaucoma patients with the generalized enlargement disc type were included. The microcirculation of the optic nerve head was examined with laser speckle flow graphy, and the mean blur rate in all areas, in vessel area, and in tissue area were calculated using the laser speckle flow graphy analyzer software. Average peripapillary retinal nerve fiber layer thickness was measured using Stratus optical coherence tomography, and cupping parameters were accessed using the Heidelberg retina tomograph. The mean deviation in the Humphrey field analyzer (30-2 SITA standard) was analyzed. The correlation between these parameters was evaluated using the Spearman rank correlation coefficient.
Results
The correlation coefficient of mean blur rate in all optic disc area to the average peripapillary retinal nerve fiber layer thickness, vertical C/D, and mean deviation were r = 0.7546 (P < 0.0001), r = −0.6208 (P < 0.0001), and r = 0.6010 (P = 0.0001), respectively. The mean blur rate in tissue area of the optic disc showed r = 0.7305 (P < 0.0001), r = −0.6438 (P < 0.0001), and r = 0.6338 (P < 0.0001).
Conclusion
We found that the mean blur rate in the optic disc was significantly correlated with the average peripapillary retinal nerve fiber layer thickness, vertical C/D, and mean deviation in patients with the generalized enlargement disc type of glaucoma. In particular, the mean blur rate in tissue area was more highly correlated than the vessel area with other results of examination in glaucoma patients with the generalized enlargement disc type.
Introduction
Glaucoma is characterized by optic nerve fiber atrophy, which causes visual field lossCitation1 and affects over 70 million people worldwide. It is also the second most common cause of blindness.Citation2,Citation3 In Asia, especially in Japan, normal-tension glaucoma is the major type of open-angle glaucoma,Citation4,Citation5 and the proportion of patients with normal-tension glaucoma was reportedly four-fold higher than that of high-tension glaucoma patients in a large Japanese-American clinic population.Citation6 Therefore, when we treat Japanese patients with glaucoma, it is necessary to refer to not only results from multicenter analyses in Western countries but also results from Asian countries. A number of studies have shown that visual field abnormalities are detected only after 20%–50% of the retinal ganglion cells have been lost, as measured by standard automated perimetry.Citation7–Citation9 The decrease in retinal nerve fiber layer thickness and change in morphology of the optic disc precede the visual field defects in glaucoma.Citation10–Citation12 Thus, the latest objective instruments, based on laser confocal systems or optical coherence systems,Citation13–Citation15 are better for the earlier detection of glaucoma. Importantly, the findings of these objective instruments are also correlated with the degree of mean deviations of the Humphrey field analyzer.Citation16–Citation18 Automated perimetry is now part of standard follow-up for glaucoma, and objective measuring instruments would be more valuable if they could also be used for follow-up.
It is well known that glaucoma is a multifactorial disease. Citation19 Various shapes of optic discs have also been clinically recognized in patients with glaucoma. Nicolela and Drance classified optic disc appearances into four types, ie, focal ischemic, myopic, senile sclerotic, and generalized enlargement disc types.Citation20 They found that classifying the optic disc had a variety of benefits for understanding the mechanism of optic neuropathy in glaucoma and for predicting the prognosis of patients with the disease.Citation21 We used their methodology and found that, in patients with the myopic glaucoma disc type, if the temporal retinal nerve fiber layer thickness was thinner than 38 μm, visual acuity would be decreased due to glaucoma.Citation22 Furthermore, the association between Heidelberg retina tomograph (HRT) II parameters and impaired visual fields was strong in patients with the generalized enlargement disc type but not in those with the focal ischemic disc type.Citation23 In addition, we found that patients with severe high-tension glaucoma had a significantly higher proportion of the generalized enlargement disc type of glaucoma. Thus, a study that evaluates patients by disc type may provide informative data.Citation24
Among the risk factors for glaucoma, in addition to intraocular pressure, the microcirculation in the optic disc is critical, especially in normal-tension glaucoma.Citation25 Fluorescein angiography, scanning laser Doppler flowmetry,Citation26,Citation27 and color Doppler imagingCitation28,Citation29 have been used in previous studies; however, all of these devices had limitations in accurately quantifying the ocular blood flow. Laser speckle flow graphy (LSFG) allows quantification of the microcirculation of the optic nerve head, choroid, and retinal vessels separately in living eyes with no contact, using the laser speckle phenomenon. Citation30 The machine is equipped with a fundus camera, a diode laser, an image sensor, an infrared charge- coupled device camera, and a high-resolution digital charge-coupled device camera. The mean blur rate, a parameter representing the retinal micro-circulation, is theoretically an exact measurement that is proportional to blood flow velocity, and has been correlated with blood flow measured by older instruments.Citation27,Citation31 It takes only a few seconds to acquire an image of the ocular circulation. After analysis, the three-heartbeat data are converted into one-heartbeat data. Then a one-color map is formed to show the distribution of the retinal circulation. Thus, the LSFG method is suitable for monitoring the time course of the change in tissue circulation at the same site in the same eye at various intervals, ranging from seconds to months.Citation27,Citation30,Citation32–Citation35
In this study, we investigated the extent of correlation between the mean blur rate measured with laser speckle flowgraphy system LSFG-NAVI (Softcare, Ltd, Fukuoka, Japan) and the objective results of other glaucoma examinations (eg, from HRT II) in patients with the generalized enlargement disc type of glaucoma.
Methods and materials
Patient eligibility
Thirty-eight eyes from 38 Japanese adults aged > 40 years (mean age 62.7 ± 8.6 years) with glaucoma of the generalized enlargement disc type were studied. The generalized enlargement disc type was classified according to the system previously described by Nicolela and DranceCitation20 and in our publicationsCitation23,Citation24 (). Patients were excluded from the study if they had glaucoma with other types of optic disc patterns, any other ocular diseases, systemic diseases affecting the visual field or blood flow, a history of intraocular surgery, or refractive errors (spherical equivalent up to −4 diopters [D]). Best-corrected visual acuity was measured with a standard Japanese decimal visual acuity chart and converted to logarithm of the minimum angle of resolution (logMAR) units. If both eyes met the inclusion criteria, the eye with the lower mean deviations on the Humphrey field analyzer (Carl Zeiss Meditec, Dublin, CA) was used in the statistical analyses. Baseline intraocular pressure was measured by Goldmann applanation tonometry before treatment, and if the patient’s intraocular pressure was more than 21 mmHg with intraocular pressure-lowering eye drops, the case was excluded. Systolic and diastolic blood pressures were recorded before measurement of LSFG, and the ocular perfusion pressure was calculated as ocular perfusion pressure = 2/3 (1/3 systolic blood pressure + 2/3 diastolic blood pressure) – intraocular pressure. The procedures used in this retrospective study followed the tenets of the Declaration of Helsinki and were approved by the Institutional Review Board of the Tohoku Graduate School of Medicine.
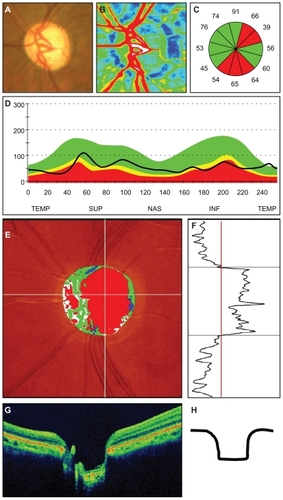
Figure 1 Representative photographs of a patient with the generalized enlargement disc type of glaucoma. (A) Fundus photograph of the left optic disc. (B) Color map from LSFG-NAVI (Softcare, Ltd, Fukuoka, Japan). (C) Average thickness of the retinal nerve fiber layer thickness in the clock area. (D) Circumferential retinal nerve fiber layer thickness pattern in a patient with glaucoma. (E, F) Results of Heidelberg retina tomograph II. (G) Vertical section through the center optic nerve by three-dimensional optical coherence tomography.
Diagnosis
Glaucoma was diagnosed based on the presence of cupping of the optic disc with defects in the corresponding visual field. Visual field defects were categorized as glaucomatous according to the Anderson-Pattela system if the following criteria were met: the results of the glaucoma hemifield test were outside normal limits; there was a cluster of three or more nonedge points at a location typical for glaucoma, all depressed on the pattern deviation plot at P < 0.05, and at least one depressed at P < 0.01; and the corrected pattern standard deviation was significant at P < 0.05. To evaluate the visual fields, the mean deviation values were obtained by the Swedish interactive threshold algorithm standard strategy of the 30-2 program of the Humphrey field analyzer. Only the mean deviations of reliable visual field results (<20% fixation errors, <33% false positives, and <33% false negatives) were used. Perimetric data selected for the statistical analyses were those collected within 3 months of the LSFG examination.
Laser speckle flow graphy
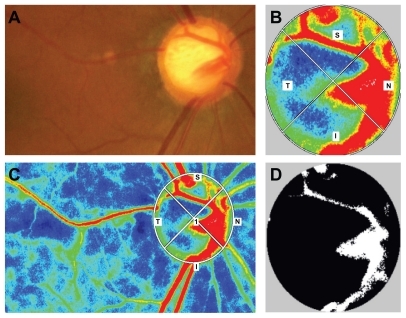
To evaluate microcirculation at the optic nerve head, the mean blur rate of the optic disc () was determined by LSFG-NAVI. Mean blur rates in three areas of the optic disc were calculated using LSFG analyzer software (version 3.0.43.0; ); the mean blur rate in all area (MA) of optic disc (disc MA) was the average mean blur rate over the entire optic disc (), mean blur rate in vessel area (MV) of optic disc (disc MV) was average over the vessel area (, white area), and mean blur rate in tissue area of the optic disc (MT) of optic disc (disc MT) was the average of the mean blur rate of the optic disc area minus the vessel area (, black area). These three parameters were measured at the same time, and the averages were used in the statistical analyses.
Figure 2 Color map and binary image of laser speckle flow graph in a patient with the generalized enlargement disc type of glaucoma. (A) Fundus photograph of the left optic disc in a patient with the generalized enlargement disc type of glaucoma (64-year-old female, baseline intraocular pressure 17 mmHg, Humphrey field analyzer mean deviation −8.01 dB). (B) Color map image of the optic nerve head. (C) Color map image of the whole area and the optic nerve head depicted by region of interest. (D) Binary map of the optic nerve head. The white area indicates the vessel, and the black area indicates tissue.
Measurement of OCT and HRT II
The patients’ pupils were dilated before examination. Retinal nerve fiber layer thickness around the optic disc was determined using the Stratus optical coherence tonometer (OCT, Carl Zeiss Meditec), and the average retinal nerve fiber layer thickness was used for analysis. Fifteen HRT parameters were determined using the HRT II (Heidelberg Engineering Inc, CA), ie, disc area, cup area, rim area, cup/disc area ratio, rim/disc area ratio, cup volume, rim volume, mean cup depth, maximum cup depth, height variation contour, cup shape measure, mean retinal nerve fiber layer thickness and cross-sectional area, horizontal cup/disc area ratio, and vertical cup/disc area ratio. The optic disc contour line was manually drawn at the inner edge of the scleral ring by one experienced glaucoma specialist. If the standard deviation of the mean topographic image was more than 40 μm, the data were excluded.
Statistical analyses
Relationships between LSFG values and degree of alterations, including mean deviation values, retinal nerve fiber layer thickness, and HRT II parameters, were determined by a simple regression analysis. A P value <0.05 was considered to be statistically significant.
Results
This study examined 38 patients with the generalized enlargement disc type of glaucoma, comprising 22 (58%) women and 16 (42%) men, of mean age 62.7 ± 8.6 years. Patient demographic data are listed in . The average spherical equivalent was −0.67 ± 1.88 D, the average value ± mean deviation on the Humphrey field analyzer was −8.0 ± 6.8 dB, the average peripapillary retinal nerve fiber layer thickness was 71.6 ± 18.4 μm, and the best-corrected visual acuity (logMAR) was 0.032 ± 0.090. The mean values for MA of the optic disc (disc MA), MV of the optic disc (disc MV), and MT of the optic disc (disc MT) were 20.6 ± 5.5, 44.6 ± 2.5, and 11.5 ± 2.1, respectively. The average values for the HRT II parameters are listed in .
Table 1 Patient demographic data
Table 2 Mean values of HRT II parameters
The correlation between the disc MA and the Humphrey field analyzer mean deviation was significant (r = 0.6010, P = 0.0001), as was the correlation between the disc MA and the average peripapillary retinal nerve fiber layer thickness (r = 0.7546, P < 0.0001). These data are listed in and . Next, we investigated the correlation between disc mean blur rate and several HRT II parameters (). Correlations between the disc MA and HRT II parameters were significant for the cup area (r = 0.3637, P = 0.0248), rim area (r = 0.5588, P = 0.0003), cup/disc area ratio (r = −0.5437, P = 0.0004), rim/disc area ratio (r = 0.5437, P = 0.0004), cup volume (r = −0.3636, P = 0.0248), rim volume (r = 0.3430, P = 0.0350), height variation contour (r = −0.4261, P = 0.0076), mean retinal nerve fiber layer thickness (r = 0.4096, P = 0.0106), cross-sectional retinal nerve fiber layer area (r = 0.4418, P = 0.0055), and vertical cup/disc ratio (r = −0.6208, P < 0.0001). The correlation was strongest for the vertical cup/disc area ratio.
Table 3 Relationship between mean blur rate and mean deviation (MD)
Table 4 Relationship between mean blur rate and average RNFLT
Table 5 Relationship between mean blur rate and Heidelberg retina tomograph II parameters
We used the LSFG analyzer software to measure the mean blur rate in the vessel area and in the tissue area separately. There was a significant correlation between the disc MV and the Humphrey field analyzer mean deviation (r = 0.3346, P = 0.0401), average peripapillary retinal nerve fiber layer thickness (r = 0.4825, P = 0.0022), and vertical cup/disc ratio (r = −0.3226, P = 0.0482). However, the disc MT was more strongly associated with the Humphrey field analyzer mean deviation (r = 0.6338, P < 0.0001), average peripapillary retinal nerve fiber layer thickness (r = 0.7305, P < 0.0001), and vertical cup/disc ratio (r = −0.6438, P < 0.0001) than was the disc MV. Interestingly, the disc MT showed stronger correlations with the mean blur rate and the various parameters assessed in the glaucoma examination than did the disc MV.
Discussion
In this study, we investigated whether there were associations between mean blur rate, a new parameter of blood flow determined using LSFG-NAVI, and other traditional parameters used in examination for glaucoma, which included Humphrey field analyzer mean deviation, average peripapillary retinal nerve fiber layer thickness, and HRT II in patients with generalized enlargement disc type glaucoma. We found that the disc MA and disc MT were significantly correlated with values recorded using the Humphrey field analyzer, OCT, and HRT II. The strongest correlation was between the disc MA and the average peripapillary retinal nerve fiber layer thickness (r = 0.7546, P < 0.0001). These data suggest that the mean blur rate from LSFG-NAVI is useful as an objective measurement in patients with glaucoma.
We focused on patients with the generalized enlargement disc type of glaucoma. To evaluate the potential of using the mean blur rate from LSFG-NAVI as an objective measure for patients with glaucoma, we needed to compare the mean blur rate values with other parameters used in examination for glaucoma. In a previous study, we found that classification of the optic disc type was beneficial for accurate investigation of the correlation between Humphrey field analyzer mean deviation and other objective instruments used for glaucoma.Citation23 In that study, the group with the generalized enlargement disc type showed the strongest association between HRT II parameters and the Humphrey field analyzer mean deviation.Citation23 Furthermore, we found that the generalized enlargement disc type was significantly more common than the other disc types in patients with severe high-tension glaucoma in our hospital-based study.Citation24 These data prompted us to focus on patients with the generalized enlargement disc type.
The disc MA was significantly associated with the degree of visual field damage in patients with glaucoma. Mean blur rate represented blood flowCitation36 and was strongly and positively correlated with the degree of visual field damage (r = 0.6010, P = 0.0001). Decreased blood flow has previously been demonstrated in patients with glaucoma using fluorescein angiography,Citation37–Citation40 color Doppler flowmetry,Citation41 and scanning laser Doppler flowmetry.Citation42 In a rabbit model of vascular dysfunction using intravitreal administration of endothelin-1, the endothelin-1-induced decrease in mean blur rate in the optic disc led to cupping after 1 month.Citation43 In our human study, the mean blur rate showed a high correlation with the Humphrey field analyzer mean deviation, which suggests that LSFG-NAVI, like OCT and HRT II, is a suitable device for assessment of patients with glaucoma.
When we examined the associations between disc MV and disc MT with the other parameters, the disc MT showed stronger correlations than did the disc MV. When we separated the optic nerve head into the nerve fiber layer, lamina cribrosa, and prelaminar region, it was evident that the vasculature of the nerve fiber layer fed from the branch of the central retinal artery. The vasculature of the prelaminar region and lamina cribrosa fed from the post-ciliary artery.Citation44 These data suggest that the vessel mean is composed of the retinal central artery and vein, and the tissue mean is composed of the post-ciliary artery. On the other hand, for the HRT II disc parameters, only the rim area, maximum cup depth, height variant contour, and vertical cup/disc area ratio were associated with the disc MV, and this association was weak. Taken together, the stronger associations between the disc MT and the other cupping parameters from HRT II provide support for the important contribution of the post-ciliary artery to the pathogenesis of optic neuropathy in patients with glaucoma.
Here, the correlation between mean blur rate and average peripapillary retinal nerve fiber layer thickness (r = 0.7546) was stronger than that between mean blur rate and Humphrey field analyzer mean deviation (r = 0.6010) in patients with the generalized enlargement disc type of glaucoma. Generally, decreased retinal nerve fiber layer thickness is preceded by decreased Humphrey field analyzer mean deviation in the glaucoma disease process.Citation10 It would be interesting to study further whether the higher association between mean blur rate and average peripapillary retinal nerve fiber layer thickness indicates that blood flow also shows abnormalities, like the retinal nerve fiber layer thickness (ie, whether decreased blood flow in the optic disc can be detected earlier than visual field loss) in the glaucoma disease process.
In conclusion, mean blur rate with LSFG-NAVI in patients with the generalized enlargement disc type of glaucoma provided valuable information, and the parameters studied correlated with retinal nerve fiber layer thickness, cupping parameters, and visual function.
Disclosure
This manuscript was presented and nominated as one of the top ten best presentations at the Japanese Glaucoma Society meeting in 2010. The abstract was published in the International Glaucoma Review meeting report (IGR December 12–13, 2010). The authors report no conflicts of interest in this work.
References
- WeinrebRNKhawPTPrimary open-angle glaucomaLancet20043631711172015158634
- QuigleyHANumber of people with glaucoma worldwideBr J Ophthalmol1996803893938695555
- ResnikoffSPascoliniDEtya’aleDGlobal data on visual impairment in the year 2002Bull World Health Organ20048284485115640920
- IwaseASuzukiYAraieMThe prevalence of primary open-angle glaucoma in Japanese: the Tajimi StudyOphthalmology20041111641164815350316
- CedroneCMancinoRCerulliAEpidemiology of primary glaucoma: prevalence, incidence, and blinding effectsProg Brain Res200817331418929097
- PekmezciMVoBLimAKThe characteristics of glaucoma in Japanese AmericansArch Ophthalmol200912716717119204234
- HarwerthRSCarter-DawsonLSmithELNeural losses correlated with visual losses in clinical perimetryInvest Ophthalmol Vis Sci2004453152316015326134
- Kerrigan-BaumrindLAQuigleyHAPeaseMENumber of ganglion cells in glaucoma eyes compared with threshold visual field tests in the same personsInvest Ophthalmol Vis Sci20004174174810711689
- QuigleyHADunkelbergerGRGreenWRRetinal ganglion cell atrophy correlated with automated perimetry in human eyes with glaucomaAm J Ophthalmol19891074534642712129
- SommerAKatzJQuigleyHAClinically detectable nerve fiber atrophy precedes the onset of glaucomatous field lossArch Ophthalmol199110977831987954
- QuigleyHAKatzJDerickRJAn evaluation of optic disc and nerve fiber layer examinations in monitoring progression of early glaucoma damageOphthalmology19929919281741133
- ZeyenTGCaprioliJProgression of disc and field damage in early glaucomaArch Ophthalmol199311162658424726
- MardinCYJunemannAGThe diagnostic value of optic nerve imaging in early glaucomaCurr Opin Ophthalmol20011210010411224715
- BadalaFNouri-MahdaviKRaoofDAOptic disk and nerve fiber layer imaging to detect glaucomaAm J Ophthalmol200714472473217868631
- NaithaniPSihotaRSonyPEvaluation of optical coherence tomography and Heidelberg retinal tomography parameters in detecting early and moderate glaucomaInvest Ophthalmol Vis Sci2007483138314517591883
- BrusiniPMonitoring glaucoma progressionProg Brain Res2008173597318929102
- SaarelaVAiraksinenPJHeidelberg retina tomograph parameters of the optic disc in eyes with progressive retinal nerve fibre layer defectsActa Ophthalmol20088660360818752515
- KalaboukhovaLFridhammarVLindblomBGlaucoma follow-up by the Heidelberg retina tomograph – new graphical analysis of optic disc topography changesGraefes Arch Clin Exp Ophthalmol200624465466216220279
- DownsJCRobertsMDBurgoyneCFMechanical environment of the optic nerve head in glaucomaOptom Vis Sci20088542543518521012
- NicolelaMTDranceSMVarious glaucomatous optic nerve appearances: clinical correlationsOphthalmology19961036406498618765
- NicolelaMTMcCormickTADranceSMVisual field and optic disc progression in patients with different types of optic disc damage: a longitudinal prospective studyOphthalmology20031102178218414597527
- OmodakaKNakazawaTYokoyamaYCorrelation between peripapillary macular fiber layer thickness and visual acuity in patients with open-angle glaucomaClin Ophthalmol2010462963520668666
- OmodakaKNakazawaTOtomoTCorrelation between morphology of optic disc determined by Heidelberg Retina Tomograph II and visual function in eyes with open-angle glaucomaClin Ophthalmol2010476577220689792
- NakazawaTFuseNOmodakaKDifferent types of optic disc shape in patients with advanced open-angle glaucomaJpn J Ophthalmol20105429129520700795
- CaprioliJColemanALBlood pressure, perfusion pressure, and glaucomaAm J Ophthalmol201014970471220399924
- MelamedSLevkovitch-VerbinHLaser scanning tomography and angiography of the optic nerve head for the diagnosis and follow-up of glaucomaCurr Opin Ophthalmol1997871210168361
- YaoedaKShirakashiMFunakiSMeasurement of microcirculation in the optic nerve head by laser speckle flowgraphy and scanning laser Doppler flowmetryAm J Ophthalmol200012973473910926981
- YamazakiYHayamizuFComparison of flow velocity of ophthalmic artery between primary open angle glaucoma and normal tension glaucomaBr J Ophthalmol1995797327347547783
- YamazakiYDranceSMThe relationship between progression of visual field defects and retrobulbar circulation in patients with glaucomaAm J Ophthalmol19971242872959439354
- SugiyamaTAraieMRivaCEUse of laser speckle flowgraphy in ocular blood flow researchActa Ophthalmol20108872372919725814
- NagaharaMTamakiYTomidokoroAIn vivo measurement of blood velocity in human major retinal vessels using the laser speckle methodInvest Ophthalmol Vis Sci2011521879220702824
- TamakiYAraieMKawamotoENoncontact, two-dimensional measurement of retinal microcirculation using laser speckle phenomenonInvest Ophthalmol Vis Sci199435382538347928179
- TamakiYAraieMKawamotoENon-contact, two-dimensional measurement of tissue circulation in choroid and optic nerve head using laser speckle phenomenonExp Eye Res1995603733837789417
- TamakiYKawamotoEAraieMAn application of laser speckle phenomenon for noninvasive two-dimensional evaluation of micro-circulation in ocular fundus – a preliminary reportJpn J Ophthalmol1993371781868230843
- YaoedaKShirakashiMFunakiSMeasurement of microcirculation in optic nerve head by laser speckle flowgraphy in normal volunteersAm J Ophthalmol200013060661011078839
- KonishiNTokimotoYKohraKNew laser speckle flowgraphy system using CCD cameraOptical Review20029163169
- PlangeNKaupMHuberKFluorescein filling defects of the optic nerve head in normal tension glaucoma, primary open-angle glaucoma, ocular hypertension and healthy controlsOphthalmic Physiol Opt200626263216390479
- PlangeNKaupMWeberAFluorescein filling defects and quantitative morphologic analysis of the optic nerve head in glaucomaArch Ophthalmol200412219520114769596
- SihotaRSaxenaRTanejaNTopography and fluorescein angiography of the optic nerve head in primary open-angle and chronic primary angle closure glaucomaOptom Vis Sci20068352052616840877
- TalusanEDSchwartzBWilcoxLMJrFluorescein angiography of the optic disc. A longitudinal follow-up studyArch Ophthalmol198098157915877425919
- QuarantaLHarrisADonatoFColor Doppler imaging of ophthalmic artery blood flow velocity: a study of repeatability and agreementOphthalmology19971046536589111259
- MichelsonGSchmaussBLanghansMJPrinciple, validity, and reliability of scanning laser Doppler flowmetryJ Glaucoma19965991058795741
- SugiyamaTMashimaYYoshiokaYEffect of unoprostone on topographic and blood flow changes in the ischemic optic nerve head of rabbitsArch Ophthalmol200912745445919365024
- HayrehSSThe 1994 Von Sallman Lecture. The optic nerve head circulation in health and diseaseExp Eye Res1995612592727556490