Abstract
Objective:
To compare measurements obtained by Goldmann applanation tonometry (GAT) and Pascal dynamic contour tonometry (DCT), and to study their relationship to corneal thickness and biomechanical properties in nonglaucomatous eyes.
Methods:
This is a prospective and randomized study of 200 eyes from 200 non-glaucomatous subjects who underwent intraocular pressure (IOP) measurements by GAT and DCT. The two methods were compared and assessed for agreement by means of the Bland–Altman plot. Central corneal thickness (CCT) and corneal hysteresis (CH) were obtained by ultrasound pachymeter and Ocular Response Analyzer, respectively. The effect of CH and CCT was correlated with the DCT/GAT IOP differences.
Results:
Mean age was 57.4 ± 14.7 years (range 24–82 years). Mean IOP measurements obtained were 16.7 ± 3.2 mmHg by GAT and 19.4 ± 3.3 mmHg by DCT. DCT showed a statistically significant higher mean IOP (2.7 ± 1.9 mmHg, P < 0.001) compared with GAT. Mean CCT and CH were 546.5 ± 40 μm and 10.85 ± 2.0 mmHg, respectively. The differences in IOP (DCT – GAT) were significantly correlated with CCT and CH (Pearson’s correlation coefficient r = −0.517 and −0.355, P < 0.0001, respectively). The difference between the two correlation coefficients was statistically significant (P < 0.05, Z-statistic). According to the Bland–Altman plot, the results of the two methods were clinically different.
Conclusion:
Significantly higher IOP readings were obtained by DCT than by GAT in nonglaucomatous subjects. The IOP differences between the two methods were associated with CCT and CH, suggesting that DCT was less dependent on corneal parameters. Each method provides clinically different IOP values, indicating that DCT and GAT should not be used interchangeably.
Introduction
The accurate measurement of intraocular pressure (IOP) plays the most important role in the diagnosis, monitoring, and treatment of glaucoma.Citation1,Citation2 Goldmann applanation tonometry (GAT) is currently the most widely used method for the determination of IOP.Citation3 However, GAT measurements can be influenced by several factors, such as central corneal thickness (CCT), corneal curvature, axial length, and the biomechanical properties of the ocular wall.Citation4–Citation14 In order to determine the “true” IOP in a more reliable manner, research has turned to alternative tonometry methods.Citation15–Citation17 Pascal dynamic contour tonometry (DCT) has attracted much attention in recent years as a promising novel method that provides direct transcorneal IOP measurements, and is influenced to a lesser degree by interindividual variations in CCT.Citation18–Citation28 Most studies report that IOP readings obtained by DCT are higher than those obtained by GAT.Citation18–Citation33 However, there are contradictory results for the magnitude of these IOP differences,Citation27,Citation28,Citation32–Citation34 as well as their association with the geometrical and biomechanical properties of the cornea.Citation28–Citation34 The biomechanical response of the cornea not only depends on its thickness, but also on its viscoelasticity, which is associated with stromal hydration, collagen composition, and probably other unidentified structural factors.Citation12,Citation35–Citation38 Corneal hysteresis (CH), as measured by the Ocular Response Analyzer (ORA; Reichert Ophthalmic Instruments, Buffalo, NY) device, has been suggested to reflect the viscoelastic properties of the cornea.Citation17 Little is known about the effect of the corneal biomechanics on DCT measurements.Citation32,Citation39 Furthermore, the clinical value of DCT compared with GAT has not yet been completely delineated. The objective of this study was to evaluate GAT and DCT IOP measurements in nonglaucomatous eyes and to analyze them in relation to CCT and CH.
Methods
This was a prospective study of 200 nonglaucomatous subjects, who visited the outpatient clinic of the “Hellenic Red Cross” General Hospital. The study was approved by the hospital’s Scientific Board. Written informed consent, according to the principles of the Declaration of Helsinki, was obtained from each participant. Ophthalmological examination included medical history, automated refraction, Javal’s keratometry, best corrected visual acuity with Snellen chart, slit lamp examination, fundoscopy with a 78-D lens, IOP measurement, and CH and CCT calculation. Patients with glaucoma, ophthalmic surgery or trauma, active ocular inflammation, refractive error/astigmatism of > ±2.00 D, corneal abnormalities, or refractive procedure were excluded from the study. Glaucoma suspects with IOP measurements >21 mmHg underwent further investigation with optical coherence tomography (Stratus, Zeiss) and automated Humphrey perimetry, in order to detect glaucomatous damage. Only subjects with ocular hypertension have been included in the study.
After instillation of proparacaine 0.5% topical anesthetic, IOP measurements were obtained by GAT and by DCT in randomized order, with a time interval of 5 minutes between them.
All IOP measurements were obtained by the same examiner in a masked fashion. GAT and DCT values were recorded by the same observer. GAT was performed on a slit lamp (Haag-Streit AG, Koeniz, Switzerland) with a tonometer calibrated according to the manufacturer’s guidelines. Two GAT readings were obtained for each eye, and mean IOP was recorded.
Dynamic contour tonometry was performed with the Pascal digital tonometer (dynamic contour tonometer, DCT-PASCAL, Ziemer Ophthalmic Systems Group Co, Switzerland), mounted to the slit lamp. DCT uses contour matching. The head of the DCT tonometer has a 10.5 mm radius and a 7.0 mm diameter, which is the approximate shape of a normal cornea. When the external pressure becomes equal with the IOP, the integrated piezoresistive pressure sensor automatically begins to acquire data, measuring the pulsative IOP continuously 100 times per second. Each measurement usually requires from 6 to 10 seconds and is simultaneously accompanied by an audio feedback, which helps the clinician to maintain good positioning on the cornea. The IOP value and a quality score (Q) indicating the reliability of the measurement are digitally displayed. According to the manufacturer’s instructions, Q1 and Q2 are characterized “excellent,” Q3 “acceptable,” Q4 and Q5 “not acceptable.” The average IOP of two measurements with a Q1 or Q2 score of each eye were evaluated for the analysis.
Fifteen minutes after DCT and GAT, CH and CCT measurements were obtained. CH was determined using the ORA. The ORA utilizes noncontact tonometry principles. The release of a precisely metered air pulse causes the cornea to shift inward, passing from a flat to a concave state. As the air pulse decreases, the cornea moves outward, returning first to a flat state, and then to its initial convex shape. An electro-optical collimator-detector monitors the central 3.0 mm of the corneal diameter during a 20-millisecond period, and records two applanation events produced by the bidirectional movement of the cornea. Two separate IOP readings, corresponding to the applanation events, are provided in a single measurement. The IOP measured during the first applanation event is always higher than the IOP measured during the second event. The difference between the two IOP values is the measure of CH, which reflects the viscoelastic properties of the cornea. Applanation signal peaks for each measurement were reviewed for quality, according to the manufacturer’s instructions (adequate magnitude and symmetry). When three ORA measurements of acceptable quality had been obtained in each eye, the average CH was calculated. Finally, CCT was determined using a hand-held ultrasound pachymeter (Pocket II; Quantel Medical SA, Clermont-Ferrand, France). The mean value of three CCT readings within a range of ±5 μm has been evaluated.
One eye was randomly selected and included in the analysis. Randomization was achieved using a randomization list generated by the http://www.randomization.com website.
Statistical data analysis was performed using medcalc 9.3.7.0 (Med-Calc Software, Mariakerke, Belgium). The Kolmogorov–Smirnov test was used to check for a normal distribution of quantitative data, which are provided as means and their standard deviations. Comparisons of the measurements between the two instruments were made using the paired t-test. In order to explore the difference of IOP measurements between DCT and GAT, in correlation with CCT and CH (power and direction of a linear relationship), we used the Pearson’s analysis (Pearson’s correlation coefficient) and Z statistics. Furthermore, the two methods were compared for bias and agreement with the Bland–Altman plot. Significance was set at P < 0.05.
Results
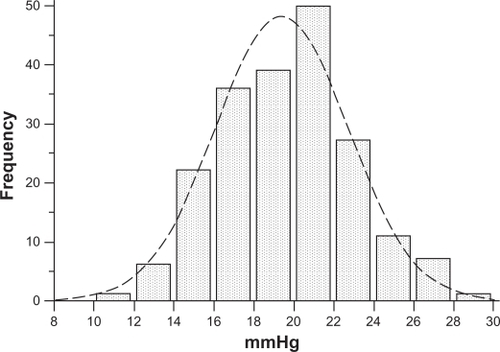
Of the 200 nonglaucomatous individuals, 93 were male and 107 were female, with an average age of 57.4 ± 14.7 years (range 24–82 years). Means and standard deviations of IOP measured by GAT and by DCT were 16.7 ± 3.2 (range 10–24) mmHg and 19.4 ± 3.3 (range 12–28.5) mmHg, respectively. IOP measured by GAT and by DCT had a normal distribution (one-sample Kolmogorov–Smirnov test). Differences in IOP measurements between DCT and GAT (ΔDCT – GAT, ie, the algebraic difference of IOP obtained by subtracting IOP by GAT from IOP by DCT for each eye) were statistically significant (2.7 ± 1.9 mmHg, paired t-test P < 0.001). The entire IOP distribution curve by DCT is shifted to the right compared with the IOP distribution curve by GAT ( and ). IOP > 21 mmHg was obtained by GAT in 28 eyes (14%) and by DCT in 94 eyes (47%).
Figure 1 IOP normal distribution according to GAT measurements in 200 nonglaucomatous eyes, 28 (14%) of which had an IOP > 21 mmHg.
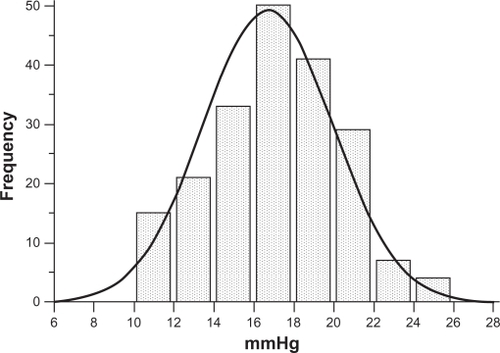
Figure 2 IOP normal distribution according to DCT measurements in 200 nonglaucomatous eyes. Compared with the GAT IOP curve in , a shift of the entire DCT IOP distribution curve to the right is observed. Ninety-four (47%) eyes had an IOP > 21 mmHg.
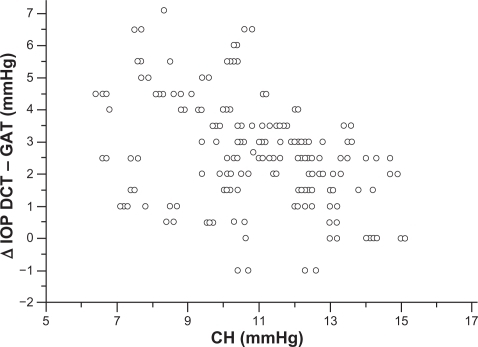
Mean corneal curvature, calculated from the mean values of the two readings, obtained by the Javal’s keratometry for each eye, was 43 ± 1.2 dpt. Mean CCT found in nonglaucomatous eyes was 546.5 ± 40 (range 450–630 μm), and mean CH was 10.85 ± 2.0 mmHg (range 6.4–15.1 mmHg). CCT, CH and corneal curvature, had a normal distribution (one-sample Kolmogorov–Smirnov test). A significant negative correlation was found between CCT and ΔDCT – GAT (Pearson’s correlation coefficient r = −0.517, P < 0.0001, 95% CI −0.612 to −0.408) (). A significant negative correlation was found also between CH and ΔDCT – GAT (Pearson’s correlation coefficient r = −0.355, P < 0.0001, 95% CI −0.492 to −0.254) (). The difference between the two correlation coefficients was statistical significant (P = 0.0460, Z-statistic = 1.996).
Figure 3 CCT measurements plotted against the difference between DCT and GAT IOP measurements show a strongly negative correlation (Pearson’s correlation coefficient r = −0.517, P < 0.0001). IOP differences tend to increase in eyes with thinner corneas and to decrease in eyes with thicker corneas.
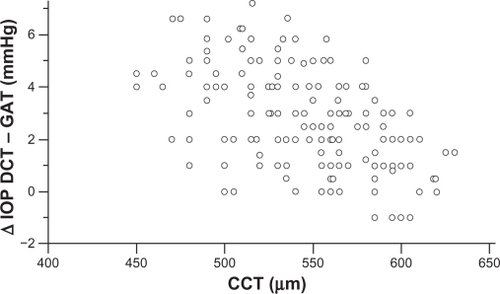
Figure 4 CH measurements plotted against the difference between DCT and GAT IOP measurements show a significantly negative correlation (Pearson’s correlation coefficient r = −0.355, P < 0.0001). The IOP differences tend to increase in eyes with lower CH and to decrease in eyes with higher CH.
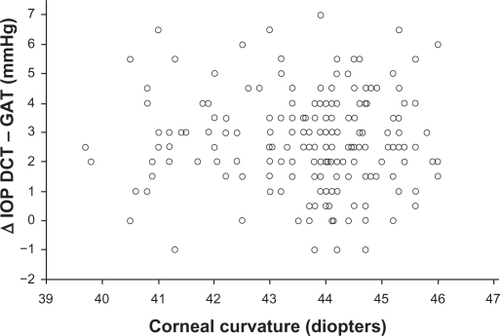
No statistical significance was found between the corneal curvature and ΔDCT – GAT () (Pearson’s correlation coefficient r = −0.028, P = 0.689, 95% CI −0.166 to 0.110).
Figure 5 Corneal curvature measurements plotted against the difference between DCT and GAT IOP measurements do not show a statistically significant correlation (Pearson’s correlation coefficient r = −0.028, P = 0.689).
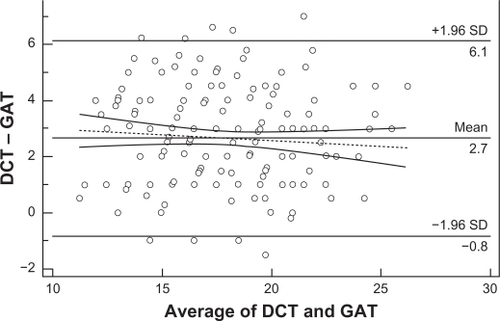
displays a scatter diagram of the differences plotted against the averages of the two measurements. Horizontal lines are drawn at the mean difference, and at the mean difference ±1.96 times the standard deviation of the differences. When two methods show excellent agreement, the mean difference will be near zero. According to the Bland–Altman plot, the results of the two methods differed clinically, since the measurements were on average >2.7 mmHg apart. The trend towards a reduction of the IOP differences at higher IOP levels was not statistically significant ( dotted line, r = −0,083, P = 0,242, 95% CI −0.219 to 0.0562).
Figure 6 Bland–Altman plot testing the clinical agreement of the IOP measurements obtained by DCT and GAT. The results of the 2 methods are clinically different, since the measurements are on average >2.7 mmHg apart. Therefore, the 2 methods are not interchangeable. The tendency of the IOP differences to decrease at higher IOPs was not statistically significant (dotted line, r = −0.083, P = 0.242).
Discussion
Fifty years ago, Goldman had pointed out that the theoretical model of applanation tonometry, which relied on the Imbert-Fick law,Citation3 concealed errors in clinical practice. It is well known that the GAT IOP value in thicker corneas is falsely higher, while in thinner corneas it is falsely lower.Citation4,Citation7–Citation10 The impact of the biomechanical properties of the ocular wall on GAT IOP measurements, as well as on glaucoma pathogenesis, has also been demonstrated.Citation12,Citation13,Citation39–Citation43 New tonometry methods have been developed to improve the accuracy of IOP determination, among which great attention has been gained by DCT.
In the present study, significantly higher IOP readings (by 2.7 mmHg on average) were obtained in nonglaucomatous eyes by DCT than by GAT. In order to enhance the reliability of DCT measurements, we evaluated only Q1 and Q2 IOP readings, ie, those of “excellent” testing quality, according to the manufacturer’s instructions. Similar results in nonglaucomatous subjects were found by other authors.Citation22,Citation24,Citation25 Kaufmann et al reported lower IOP differences (1.7 mm on average) between the two methods by using a prototype of the Pascal tonometer in healthy volunteers.Citation18 Kniestedt et al, performing manometry in cadaver eyes, showed that GAT IOPs were on average lower (by almost 4 mmHg) than DCT IOPs.Citation44,Citation45
Several investigators have clinically documented that, compared with GAT, DCT overestimates IOP by values ranging on average from 0.7 to 4.4 mmHg. The range of the results in those studies may be due to the recruitment of nonhomogenous populations including glaucomatous, nonglaucomatous, mixed or racially dissimilar individuals, or variation in visual endpoint for different GAT observers. It has been reported recently that the mean difference of IOP values between GAT and DCT is not the same in glaucomatous eyes as in nonglaucomatous eyes.Citation25,Citation31 In addition, race is associated with variable corneal parameters,Citation10,Citation46–Citation48 which may considerably influence GAT versus DCT measurements.
Most authors agree that DCT IOP measurements are less affected by CCT, compared to GAT,Citation18–Citation28 although a few contradictory findings have also been reported.Citation29–Citation34 Important evidence for the impact of corneal parameters on DCT versus GAT measurements is derived from the field of refractive surgery.Citation35,Citation49–Citation51 Studies comparing the two methods before and after refractive surgical procedures showed that measurements by DCT were significantly more consistent.Citation49–Citation51 We found that the differences of measurements between DCT and GAT are strongly correlated with CCT (). These IOP differences are more pronounced in eyes with thinner corneas, whereas in most eyes with thicker corneas they tend to be minimal. Surprisingly, however, as shown in , a noteworthy number of eyes with thicker corneas (>550 μm) had IOP differences of ≥3 mmHg, while some eyes with thinner corneas (<550 μm) had IOP differences of ≤2 mmHg. The effect of corneal curvature on DCT measurements is controversial.Citation18,Citation23,Citation24 This study, including eyes with < ± 2.0 dpt ammetropia, did not reveal any significant impact of the corneal curvature on the IOP differences between the two methods (). Hence, our findings indicate that, in addition to corneal thickness, other characteristics of the cornea, such as its biomechanical response, may be implicated in the discrepancies between DCT and GAT IOP measurements. It is reported that CH is associated with CCT.Citation41,Citation52 Similarly to CCT, we found that CH was also significantly negatively correlated with the differences between DCT and GAT measurements (), ie, in eyes with a higher CH value these IOP differences were lower, and vice versa. However the correlations of CCT () and CH () showed a significant difference, which implies that CCT and CH may have a different impact on DCT versus GAT. This finding could explain the discrepancies between DCT and GAT IOP measurements in a number of eyes with thicker or thinner corneas. Apparently, among eyes with the same CCT, the difference between DCT and GAT measurements may not be identical, due to different viscoelastic properties. The effect of corneal factors other than CCT on tonometry has been proposed in several studies. Feltgen et al, comparing intracameral with applanatory tonometry, concluded that GAT IOP is not methodically influenced by CCT.Citation53 Kniestedt et al reported that the relationship between CCT and GAT is not linear.Citation19 In a recent study, using the Ehlers-correction coefficient, CCT error-free GAT IOPs were not consistent with DCT IOPs.Citation54 It is suggested that the development of various correction coefficients for a “true” GAT IOP determination, taking into account only CCT, has not given reliable results.Citation15,Citation19,Citation51,Citation53,Citation55 The authors of a meta-analysis on CCT-induced GAT IOP measurement errors suggest different correction coefficients between normal and glaucomatous eyes.Citation9 In addition, the impact of corneal biomechanics on GAT has been already introduced. Using bioengineering techniques, Liu and Roberts described in an experimental model that differences in corneal viscoelastic properties may have at least the same effect on GAT as differences in corneal thickness.Citation12 Similarly to our results, Kotecha et al showed that CRF (corneal resistance factor) was correlated more significantly than CCT with DCT and GAT measurements.Citation39 Hager et al found a weak correlation of CH with GAT and DCT measurements in glaucomatous eyes.Citation32 It is also reported that corneal viscoelastic properties differ between normal and glaucomatous eyes.Citation41 A different correlation of CCT with the deviations of DCT versus GAT IOP between nonglaucomatous and glaucomatous eyes has also been reported,Citation25,Citation31 probably due to differing biomechanical properties.
All these data imply that the effect of corneal parameters on the determination of IOP by both GAT and DCT is complex. Regardless of how differences between DCT and GAT could be explained, their clinical relevance is probably the most important issue. In our study, the Bland–Altman plot showed that the results of the two methods are clinically different (). Using the criterion for ocular hypertension GAT IOP > 21 mmHg, the ocular hypertensive eyes among the participants in our study detected by GAT were 14% versus 47% by DCT. It is evident that the DCT IOP distribution curve () has shifted to the right compared to the GAT IOP distribution curve (), which means that a subject with DCT IOP of 22 mmHg is not necessarily considered as suspect, because the measurement exceeds two standard deviations of the mean GAT IOP. Consequently, in agreement with other authors,Citation24,Citation34,Citation39 we also suggest that the two methods should not be used interchangeably. Moreover, the determination of the target IOP value using DCT remains unclear. Further research in a large population is needed to determine the DCT IOP distribution curve with the corresponding statistical limits, as a benchmark for the clinical evaluation of DCT measurements independently of GAT. In addition it should be clarified, why the IOP differences between the two methods tend to diminish with increasing IOP.Citation22,Citation56 This tendency was also derived from the Bland–Altman plot of our data, but was not significant.
The question about which is the “true” IOP and by which method it can be reliably determined seems to be more theoretical than practical. Since glaucomatous damage can occur across a wide range of statistically “normal” to “abnormal” IOP values, importance should be primarily given to the “damaging” IOP rather than the “true” IOP. DCT appears to be giving a better answer to the initial question. DCT measurements showed good concordance with intracameral tonometry.Citation57 GAT provides an indirect calculation of the IOP, converting the force exerted for the flattening of the cornea to pressure. To the contrary, by using DCT the IOP is directly transcorneally determined by a piezoelectrical sensor, avoiding systemic errors that may be produced by GAT.Citation16 The principle of contour matching compared with applanation appears to lessen the influence of corneal thickness and biomechanical properties on IOP measurements. The “Q” quality score can verify the reliability of the DCT reading. In addition, repeatability of DCT is described at high levels.Citation39,Citation58
To summarize, significantly higher IOP values are obtained by DCT than by GAT in non glaucomatous subjects. The differences between GAT and DCT IOP measurements are associated with CCT and CH. Each method gives clinically different IOP values, indicating that DCT and GAT should not be used interchangeably.
Disclosure
The authors have no commercial interest in any product or procedure mentioned in this manuscript.
References
- KassMAHeurDKHigginbothamEJThe ocular hypertension treatment study: a randomised trial determines that topical ocular hypotensive medication delays or prevents the onset of primary open-angle glaucomaArch Ophthalmol20021209670171312049574
- LeskeMCHeijlAHusseinMBengtssonBHymanLKomaroffEEarly Manifest Glaucoma Trail Group. Factors for glaucoma progression and the effect of treatment: the early manifest glaucoma trialArch Ophthalmol20031211485612523884
- GoldmannHSchmidtTApplanation tonometryOphthalmologica1957134422124213484216
- EhlersNBramsenTSperlingSApplanation tonometry and central corneal thicknessActa Ophthalmol (Copenh)197553134431172910
- WesselsIFOhYTonometer utilization, accuracy, and calibration under field conditionsArch Ophthalmol199010812170917122256841
- WhitacreMMSteinRSources of error with use of Goldmann-type tonometersSurv Ophthalmol19933811308235993
- WhitacreMMSteinRAHassaneinKThe effect of corneal thickness on applanation tonometryAm J Ophthalmol199311555925968488910
- BronAMCreuzot-GarcherCGoudeau-BoutillonSd’AthisPFalsely elevated intraocular pressure due to increased central corneal thicknessGraefes Arch Clin Exp Ophthalmol1999237322022410090585
- DoughtyMJZamanMLHuman corneal thickness and its impact on intraocular pressure measures: a review and a meta-analysis approchSurv Ophthalmol200044536740810734239
- BrandtJDBeiserJAKassMAGordonMOCentral corneal thickness in the Ocular Hypertension Treatment Study (OHTS)Ophthalmology2001108101779178811581049
- DamjiKFMuniRHMungerRMInfluence of corneal variables on accuracy of intraocular pressure measurementJ Glaucoma2003121698012567117
- LiuJRobertsCJInfluence of corneal biomechanical properties on intraocular pressure messurments: quantitative analysisJ Cataract Refract Surg200531114615515721707
- BromanATCongdonNGBandeen-RocheKQuigleyHAInfluence of corneal structure, corneal responsiveness, and other ocular parameters on tonometric measurement of intraocular pressureJ Glaucoma200716758158818091174
- KumarNJivanSGoldmann applanation tonometer calibration error checks: current practice in the UKEye (Lond)200721673373416575417
- HerndonLWMeasuring intraocular pressure-adjustments for corneal thickness and new technologiesCurr Opin Ophthalmol200617211511916552245
- KanngiesserHEKniestedtCRobertYCDynamic contour tonometry: presentation of a new tonometerJ Glaucoma200514534435016148581
- LuceDADetermining in vivo biomechanical properties of the cornea with ocular analyzerJ Cataract Refract Surg200531115616215721708
- KaufmannCBachmannLMThielMAComparison of dynamic contour tonometry with goldmann applanation tonometryInvest Ophthalmol Vis Sci20044593118312115326129
- KniestedtCLinSChoeJBostromANeeMStamperRLClinical comparison of contour and applanation tonometry and their relationship to pachymetryArch Ophthalmol2005123111532153716286615
- KuJYDanesh-MeyerHVCraigJPGambleGDMcGheeCNComparison of intraocular pressure measured by Pascal dynamic contour tonometry and Goldmann applanation tonometryEye (Lond)200620219119815803173
- Martinez-de-la-CasaJMGarcia-FeijooJVicoEEffect of corneal thickness on dynamic contour, rebound, and goldmann tonometryOphthalmology2006113122156216216996599
- SchneiderEGrehnFIntraocular pressure measurement-comparison of dynamic contour tonometry and goldmann applanation tonometryJ Glaucoma20061512616378009
- FrancisBAHsiehALaiMYLos Angeles Latino Eye Study Group. Effects of corneal thickness, corneal curvature, and intraocular pressure level on Goldmann applanation tonometry and dynamic contour tonometryOphthalmology20071141202617070592
- LanzaMBorrelliMDe BernardoMFilosaMLRosaNCorneal parameters and difference between goldmann applanation tonometry and dynamic contour tonometry in normal eyesJ Glaucoma200817646046418794680
- CerutiPMorbioRMarraffaMMarchiniGComparison of Goldmann applanation tonometry and dynamic contour tonometry in healthy and glaucomatous eyesEye (Lond)200923226226918219335
- LeeJLeeCHChoiJYoonSYSungKRComparison between dynamic contour tonometry and Goldmann applanation tonometryKorean J Ophthalmol2009231273119337476
- KotechaAWhiteETShewryJMGarway-HeathDFThe relative effects of corneal thickness and age on Goldmann applanation tonometry and dynamic contour tonometryBr J Ophthalmol200589121572157516299132
- DoyleALachkarYComparison of dynamic contour tonometry with goldman applanation tonometry over a wide range of central corneal thicknessJ Glaucoma200514428829215990609
- SalvetatMLZeppieriMTosoniCBrusiniPComparisons between Pascal dynamic contour tonometry, the TonoPen, and Goldmann applanation tonometry in patients with glaucomaActa Ophthalmol Scand200785327227917488456
- HalkiadakisIPatseaEChatzimichaliKComparison of dynamic contour tonometry with Goldmann applanation tonometry in glaucoma practiceActa Ophthalmol200987332332818631335
- RealiniTWeinrebRNHobbsGCorrelation of intraocular pressure measured with goldmann and dynamic contour tonometry in normal and glaucomatous eyesJ Glaucoma200918211912319225347
- HagerALogeKSchroederBFüllhasMOWiegandWEffect of central corneal thickness and corneal hysteresis on tonometry as measured by dynamic contour tonometry, ocular response analyzer, and Goldmann tonometry in glaucomatous eyesJ Glaucoma200817536136518703945
- PacheMWilmsmeyerSLautebachSFunkJDynamic contour tonometry versus Goldmann applanation tonometry: a comparative studyGraefes Arch Clin Exp Ophthalmol2005243876376715756572
- BarleonLHoffmannEMBerresMPfeifferNGrusFHComparison of dynamic contour tonometry and goldmann applanation tonometry in glaucoma patients and healthy subjectsAm J Ophthalmol2006142458359017011849
- DuppsWJJrWilsonSEBiomechanics and wound healing in the corneaExp Eye Res200683470972016720023
- HjortdalJOJensenPKIn vitro measurement of corneal strain, thickness, and curvature using digital image processingActa Ophthalmol Scand19957315117627759
- BooteCDennisSHuangYQuantockAJMeekKMLamellar orientation in human cornea in relation to mechanical propertiesJ Struct Biol200514911615629652
- DaxerAMisofKGrabnerBEttlAFratzlPCollagen fibrils in the human corneal stroma: structure and agingInvest Ophthalmol Vis Sci19983936446489501878
- KotechaAWhiteESchlottmannPGGarway-HeathDFIntraocular pressure measurement precision with the Goldmann applanation, dynamic contour, and ocular response analyzer tonometersOphthalmology2010117473073720122737
- MedeirosFAWeinrebRNEvaluation of the influence of corneal biomechanical properties on intraocular pressure measurements using the ocular response analyzerJ Glaucoma200615536437016988597
- MangouritsasGMorphisGMourtzoukosSFeretisEAssociation between corneal hysteresis and central corneal thickness in glaucomatous and non-glaucomatous eyesActa Ophthalmol200987890190518937814
- BurgoyneCFDownsJCBellezzaAJSuhJKHartRTThe optic nerve head as a biomechanical structure: a new paradigm for understanding the role of IOP-related stress and strain in the pathophysiology of glaucomatous optic nerve head damageProg Retin Eye Res2005241397315555526
- SigalIAFlanaganJGEthierCRFactors influencing optic nerve head biomechanicsInvest Ophthalmol Vis Sci200546114189419916249498
- KniestedtCNeeMStamperRLAccuracy of dynamic contour tonometry compared with applanation tonometry in human cadaver eyes of different hydration statesGraefes Arch Clin Exp Ophthalmol2005243435936615864625
- KniestedtCNeeMStamperRLDynamic contour tonometry: a comparative study on human cadaver eyesArch Ophthalmol200412291287129315364707
- La RosaFAGrossRLOrengo-NaniaSCentral corneal thickness of Caucasians and African Americans in glaucomatous and non-glaucomatous populationsArch Ophthalmol20011191232711146722
- HahnSAzenSYing-LaiMVarmaRLos Angeles Latino Eye Study Group. Central corneal thickness in LatinosInvest Ophthalmol Vis Sci20034441508151212657586
- ShimmyoMRossAJMoyAMostafaviRIntraocular pressure, Goldmann applanation tension, corneal thickness and corneal curvature in Caucasians, Asians, Hispanics, and African AmericansAm J Ophthalmol2003136460361314516799
- PeposeJSFeigenbaumSKQaziMASandersonJPRobertsCJChanges in corneal biomechanics and intraocular pressure following LASIK using static, dynamic, and noncontact tonometryAm J Ophthalmol20071431394717188041
- SiganosDSPapastergiouGIMoedasCAssessment of the Pascal dynamic contour tonometer in monitoring intraocular pressure in unoperated eyes and eyes after LASIKJ Cataract Refract Surg200430474675115093634
- KaufmannCBachmannLMThielMAIntraocular pressure measurements using dynamic contour tonometry after laser in situ keratomileusisInvest Ophthalmol Vis Sci20034493790379412939293
- ShahSLaiquzzamanMCunliffeIMantrySThe use of the Reichert ocular response analyser to establish the relationship between ocular hysteresis, corneal resistance factor and central corneal thickness in normal eyesCont Lens Anterior Eye200629525726217085066
- FeltgenNLeifertDFunkJCorrelation between central corneal thickness, applanation tonometry, and direct intracameral IOP readingsBr J Ophthalmol2001851858711133718
- GunvantPNewcombRDKirsteinEMMalinovskyVEMadonnaRJMeetzREMeasuring accurate IOPs: does correction factor help or hurt?Clin Ophthalmol201021461161620668723
- AngGSNicholasSWellsAPPoor utility of intraocular pressure correction formulae in individual glaucoma and glaucoma suspect patientsClin Experiment Ophthalmol201039211111820973896
- YooCEomYSKimYYGoldmann applanation tonometry and dynamic contour tonometry in eyes with elevated intraocular pressure (IOP): comparison in the same eyes after subsequent medical normalization of IOPGraefes Arch Clin Exp Ophthalmol2010248111611161620652303
- BoehmAGWeberAPillunatLEKochRSpoerlEDynamic contour tonometry in comparison to intracameral IOP measurementsInvest Ophthalmol Vis Sci20084962472247718316699
- Sullivan-MeeMGerhardtGHalversonKDQuallsCRepeatability and reproducibility for intraocular pressure measurement by dynamic contour, ocular response analyzer, and goldmann applanation tonometryJ Glaucoma200918966667320010245