Abstract
Background
Recent research on macular diseases has prompted investigations into the condition of the intersection between the photoreceptor inner and outer segments (IS/OS) and the relationship with retinal photoreceptor abnormalities. Although the origin of the IS/OS in optical coherence tomography (OCT) images is unclear, it may be related to either the cellular activity of the photoreceptors or the structure of the OS disks. To address this question, we compared the IS/OS status in OCT images of rat retinas before and after euthanasia.
Methods
OCT images were taken before and after euthanasia in four eyes of two Brown Norway rats. After the OCT images were taken, the rats were used for histopathological studies to confirm that retinal structures were intact.
Results
Before euthanasia, the IS/OS and external limiting membrane (ELM) line were clearly identifiable on the OCT images. However, after euthanasia, neither the IS/OS nor the ELM line was evident in three out of four eyes, and a faint IS/OS and an ELM line were identified in one eye. Histopathological analysis did not show any abnormalities in the retina in any of the four eyes.
Conclusion
The origin of the IS/OS identified in OCT images is likely related to the biological activities of the photoreceptor cells.
Introduction
Optical coherence tomography (OCT) is a noninvasive, high-resolution alternative to ultrasound imaging that can be used to obtain cross-sectional images.Citation1 Drexler et alCitation2 used OCT imaging to observe the intersection of the inner and outer photoreceptor segments (IS/OS). The IS/OS are believed to play a key role in the visual prognosis of patients with macular diseases.Citation3–Citation5 Although the origin of the IS/OS is unclear, Drexler et alCitation2 claimed that light preferentially reflects from the boundary between the IS/OS, and Van de Kraats et alCitation6 proposed a model in which the directional components are reflected back from the OS disks. However, Spaide and CurcioCitation7 mentioned that, given the known refractive indexes, the proportion of light reflected by a boundary would be approximately 0.00021% for cones and 0.00012% for rods. This result is not entirely unexpected because it would not be efficient for a light receptor system to reflect light. Thus, ascribing one of the brightest OCT bands in the posterior fundus to a region with an extremely low reflectance is not likely to be correct. Nevertheless, it has not been confirmed whether the IS/OS status seen on OCT images in animal models is the result of the structure or the cellular activity of the photoreceptors. To address these questions, we compared OCT images of the rat retina before and after euthanasia.
Materials and methods
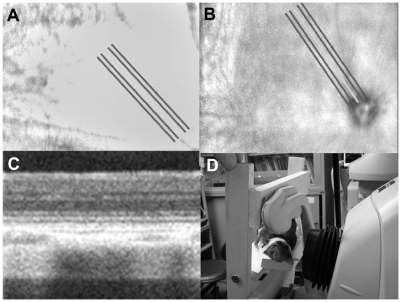
All experiments were performed in compliance with the Association for Research in Vision and Ophthalmology Statement for the Use of Animals in Ophthalmic and Vision Research. Ethical permission was granted by the Tokyo Medical University Institutional Animal Care and Use Committee. Two Brown Norway rats weighing approximately 0.2 kg were used in this study. A total of four eyes were available for OCT imaging before and after euthanasia. The rats were anesthetized using intraperitoneal injections of pentobarbital (25 mg/kg). The pupils were dilated using 0.4% tropicamide and 0.5% phenylephrine. Subsequently, 0.1% hyaluronate sodium was applied to the eyes. OCT images were taken with a Cirrus™ HD-OCT (Carl Zeiss Meditec Inc, Dublin, CA). Each rat was placed on a custom-made platform and the head and body were fixed (). The platform could be manually rotated around the longitudinal axis of the body or in the horizontal plane. This platform facilitated careful adjustment of the eye position to keep the optic disk approximately in the center of the charge coupled device (CCD) camera image and the scan beam perpendicular to the fundus. OCT images of each eye were taken using the optic nerve head as a landmark (). OCT images with signal strength over nine or ten in the Cirrus™ HD-OCT were selected for the analysis (). After OCT scan imaging, the rats were given an overdose of anesthesia using intraperitoneal injection of pentobarbital (100 mg/kg). After euthanasia, the chest cavity was carefully opened, and a 19-gauge perfusion cannula was perfused through the left ventricle first with saline, then with 10% formalin neutral buffer solution to remove erythrocytes from the retina. Approximately 10 minutes after euthanasia, OCT imaging of the rat eye was performed using a procedure identical to the one described previously. After postmortem OCT scan imaging, the rat eyes were enucleated, fixed by immersion in 4% formalin and 1% alcohol in phosphate buffer, and processed histopathologically using hematoxylin-eosin. Histopathological analysis was performed using the optic nerve head as a landmark, similarly to OCT scan imaging.
Figure 1 (A and B) Fundus photograph obtained using Cirrus™ HD-OCT before and after euthanasia, respectively. Optical coherence tomography (OCT) scanning includes the optic disk. (C) An OCT image obtained from a live rat. (D) The rat is placed on a custom-made platform, and the head and body are fixed.
Results
Histopathological analysis
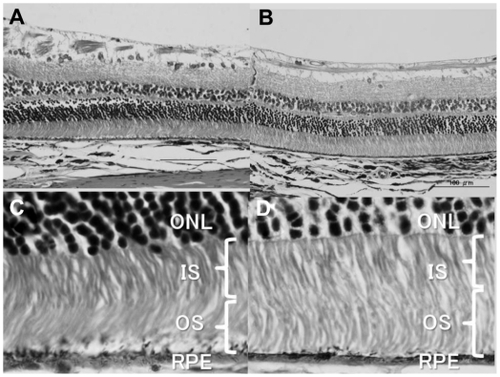
No obvious abnormal structural changes, except for artefacts due to specimen processing procedures, were observed in any of the eyes. The IS and OS as well as the outer nuclear layer looked normal in all four eyes ().
Figure 2 (A and B) The histopathology of the retina of two of four eyes after euthanasia. Even though artefacts due to the process of preparing specimens are observed, there are no obvious abnormalities in the retinal ganglion cell layer, inner plexiform layer, inner nuclear layer, outer plexiform layer, outer nuclear layer, or the photoreceptor inner and outer segments. (C and D) The magnified histology of the retina of two of four eyes after euthanasia corresponding to (A) and (B), respectively (magnification unknown). Photoreceptor inner (IS) and outer segments (OS) appear normal. The outer nuclear layer (ONL) looks normal.
OCT images
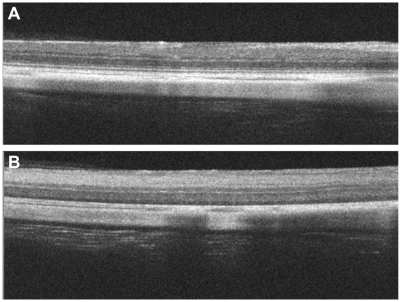
OCT images acquired before euthanasia showed a clear, straight-line IS/OS in all four eyes (). The external limiting membrane (ELM) line was also observed in all four eyes before euthanasia. In addition, a line depicting the upper middle of the retina with the same approximate density as the IS/OS, corresponding to the outer plexiform layer (OPL), was also observed in all four eyes (). In OCT images acquired after euthanasia, a reduced, faintly visible IS/OS line and an ELM line were observed in one of the four eyes (), and neither the IS/OS nor ELM was evident in the remaining three eyes (). However, the OPL line was identifiable in all four eyes, even though the density of the lines decreased relative to the pre-euthanasia images (). Tomographic images that were 6 mm-long disclose that neither the IS/OS nor the ELM is evident in a widespread area of rat retinas after euthanasia ().
Figure 3 Optical coherence tomography (OCT) images of retina before (A–D) and after euthanasia (E–H corresponding to A–D, respectively). Figure 3A corresponds to . Figure 3D corresponds to . The internal limiting membrane line (white arrow), the outer plexiform layer (OPL) line (blank arrow head), the external limiting membrane (ELM) line (white arrow head), the inner and outer segments (IS/OS) (black arrow head), and the retinal pigment epithelium line (black arrow) on OCT images are observed in all four eyes prior to euthanasia (A–D). After euthanasia, the ELM (white arrow head) and the IS/OS (black arrow head) disappears in three of the four eyes (F–H) and, in one eye, the intensity of the ELM (white arrow head) and the IS/OS (black arrow head) is reduced (E). The OPL line (blank arrow head) is still observed in all four eyes (E–H).
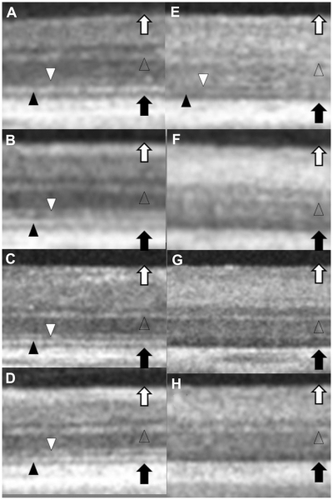
Figure 4 Optical coherence tomography images of the retina before (A) and after (B) euthanasia of 6-mm scan. Tomographic images of 6-mm-long show that neither the inner and outer segments nor the external limiting membrane are evident in a widespread area of rat retinas after euthanasia.
Discussion
In this study, we discovered that the deficit or decrease in cellular activity due to euthanasia results in a lack of identif iable IS/OS on OCT images despite ideal histopathological preservation of photoreceptor structures. These findings suggest that the biological activity of the photoreceptor cells might play a key role in generating an observable IS/OS on OCT images. Optical imaging techniques have been previously applied to the brain to measure small changes in the optical properties caused by membrane depolarization and cell swelling in the cortex.Citation8,Citation9 Srinivasan et alCitation10 claimed that the positive signal from the IS/OS junction reported in their study on functional OCT is probably associated with cone activity. Pallikaris et al,Citation11 in their investigation with the adaptive optics ophthalmoscope, indicated that intrinsic changes in reflectance of a single cone may be related to the renewal process of the outer segment. Therefore, we believe that the clinical meaning of the IS/OS line in the OCT images is most likely the “photoreceptor activity line” instead of the line at the junction between the photoreceptor IS and OS.Citation2
A faint and reduced IS/OS in one of the four eyes was observed after euthanasia. If the boundary between IS and OS of the photoreceptor of the retina is the primary origin of the IS/OS, the IS/OS should have been clearly depicted after euthanasia in all four eyes, because the photoreceptor structures did not show any histopathological abnormalities. It is possible that the cellular activity was reduced but still present approximately 10 minutes after euthanasia in the eye that had the faint, reduced IS/OS in the OCT image. In previous studies, in the eyes of pigs after death,Citation12 and in monkey eyes after they were fixed in paraformaldehyde,Citation13 the signal strength of the IS/OS in OCT images as observed by densitometry was obviously weaker than that of the OPL, which usually shows weaker or the same approximate density against the IS/OS in the OCT imaging of the retina in live animals. However, IS/OS was still somehow observed in those studies. Therefore, although we conclude that the primary origin of the IS/OS status in the OCT imaging is a result of biological changes in the photoreceptor cells, the structures of photoreceptors might contribute to the presence of the IS/OS.
Pircher et alCitation14 suggested that the intensity fluctuations at the IS/OS could be caused by the permanent generation of new disks at the IS/OS layer, which may result in a change of the refractive index difference at this interface. Pallikaris et alCitation11 reported that intrinsic changes in the reflectance of single cones may be related to the renewal process of the OS disks, as this process occurs in the OS of the photoreceptors. Conversely, we discovered that even when the OS is destroyed, the IS/OS can still be depicted on OCT images in an iodoacetic acid-induced photoreceptor degeneration rabbit model.Citation15 In addition, the IS disorganization results in the lack of IS/OS depiction on OCT images, despite relative preservation of the OS in an N-methyl-N-nitrosourea-induced photoreceptor degeneration rat model.Citation16 Based on these studies, it is possible that an organelle related to the disk renewal process that exists in both the IS and OS simultaneously may be responsible for this phenomena. Connecting cilium is an organelle that binds the IS and OS and intimately relates to the permanent generation of new disks at the IS/OS layer.Citation17 Connecting cilium transports several types of proteins from the IS to the OS and plays an important role in the OS disk renewal process.Citation17 On the basis of these facts, the biological activity in the cilium transports is a potential candidate for the origin of the IS/OS visible in the OCT images.
In our study, we also discovered that the ELM line disappeared after euthanasia. At present, there is insufficient information to draw a conclusion regarding the origin of the ELM line visible on the OCT images. However, at least some biological activity of Müller, bipolar, horizontal, and/or photo-receptor cells (eg, the synaptic ribbon between photoreceptors and bipolar/horizontal cells) seem to relate to the ability to depict the ELM line on the OCT images.
The OPL line was still detectable after euthanasia, even though the IS/OS and ELM lines had disappeared. This indicates that the origin of the OPL line in the OCT images in rats may be attributed to a certain structure that does not change after euthanasia.
The OCT images are likely constructed to include the reflections of the near-infrared light spectrum by both the retinal tissue structure and the biological activity of the retinal cells. From a clinical perspective, the IS/OS occasionally disappears and appears in the same patient, depending on the stage of the disease.Citation18 This phenomenon is likely due to changes in the activity of the photoreceptor cells that directly influence the depiction of the IS/OS in OCT images. However, our results are limited. Thus, to determine that biological activity of the photoreceptor cells plays a key role in generating an observable IS/OS on OCT images might be far too vague.
Acknowledgment
We thank Dr Masahiro Miura for drafting the article and for important intellectual content.
Disclosure
The authors report no conflicts of interest in this work.
References
- HuangDSwansonEALinCPOptical coherence tomographyScience19912545035117811811957169
- DrexlerWMorgnerUGhantaRKUltrahigh-resolution ophthalmic optical coherence tomographyNat Med20017450250711283681
- MitamuraYHiranoKBabaTYamamotoSCorrelation of visual recovery to presence of photoreceptor inner/outer segment junction in optical coherence images after epiretinal membrane surgeryBr J Ophthalmol20099317117518971234
- OjimaYTsujikawaAYamashiroKRestoration of outer segments of foveal photoreceptors after resolution of central serous chorioretinopathyJpn J Ophthalmol2010541556020151277
- MaheshwaryASOsterSFYusonRMThe association between percent disruption of the photoreceptor inner segment-outer segment junction and visual acuity in diabetic macular edemaAm J Ophthalmol20101501636720451897
- Van de KraatsJBerendschotTTvan NorrenDThe pathways of light measured in fundus reflectometryVision Res19963615222922478776488
- SpaideRFCurcioCAAnatomical correlates to the bands seen in the outer retina by optical coherence tomography: literature review and modelRetina20113181609161921844839
- VillringerAChanceBNon-invasive optical spectroscopy and imaging of human brain functionTrends Neurosci199720104354429347608
- GrinvaldAFrostigRDLiekeEHildesheimROptical imaging of neuronal activityPhysiol Rev1988684128513663054949
- SrinivasanVJChenYDukerJSFujimotoJGIn vivo functional imaging of intrinsic scattering changes in the human retina with high-speed ultrahigh resolution OCTOpt Express20091753861387719259228
- PallikarisAWilliamsDRHoferHThe reflectance of single cones in the living human eyeInvest Ophthalmol Vis Sci200344104580459214507907
- GloesmannMHermannBSchubertCHistologic correlation of pig retina radial stratification with ultrahigh-resolution optical coherence tomographyInvest Ophthalmol Vis Sci20034441696170312657611
- AngerEMUnterhuberAHermannBUltrahigh resolution optical coherence tomography of the monkey fovea. Identification of retinal sublayers by correlation with semithin histology sectionsExp Eye Res20047861117112515109918
- PircherMKroisamerJSFelbererFTemporal changes of human cone photoreceptors observed in vivo with SLO/OCTBiomed Opt Express20102110011221326640
- YamauchiYAgawaTTsukaharaRCorrelation between high-resolution optical coherence tomography (OCT) images and histopathology in an iodoacetic acid-induced model of retinal degeneration in rabbitsBr J Ophthalmol20119581157116021030415
- YamauchiYKimuraKAgawaTCorrelation between high-resolution optical coherence tomography (OCT) images and histopathology in an N-methyl-N-nitrosourea-induced retinal degeneration rat modelBr J Ophthalmol20119581161116521508160
- FliegaufMBenzingTOmranHWhen cilia go bad: cilia defects and ciliopathiesNat Rev Mol Cell Biol200781188089317955020
- HangaiMFujimotoMYoshimuraNFeatures and function of multiple evanescent white dot syndromeArch Ophthalmol2009127101307131319822847