
Abstract
Purpose
To evaluate the association between dry eye disease (DED) symptoms and daily beverage intake among adults in Saudi Arabia.
Patients and Methods
In this cross-sectional, questionnaire-based study, we distributed an online questionnaire to men and women older than 18 years living in Saudi Arabia. The questionnaire consisted of items related to the sociodemographic characteristics of the participants and two validated indices: the Ocular Surface Disease Index (OSDI) and the brief 15-item Beverage Intake Questionnaire (BEVQ-15). Participants were excluded if they were aged less than 18 years; wore contact lenses; had existing eye disease (excluding refractive errors), history of eye surgery (including corrective eye surgeries), or autoimmune diseases (rheumatoid arthritis, systemic lupus erythematosus, Sjogren’s syndrome); or were currently taking specific medications including antidepressants, antihistamines, and diuretics.
Results
After applying the study exclusion criteria, a total of 615 participants were included in the statistical analysis. The majority of participants were 18–34 years old (450, 73.2%), and men (381, 62%) exceeded women (234, 38%) by approximately 1.5-fold. OSDI scores showed that 344 participants (55.9%) had DED symptoms, 145 (23.6%) had mild dry eyes; and 106 (17.2%) and 93 (15.1%) had moderate and severe dry eyes, respectively. There was a significant association between sex and DED symptoms (p = 0.012); the frequency of DED symptoms in women exceeded that in men. However, no significant differences were observed with other demographic data such as age and location of residence. Although beverage intake was moderately correlated to OSDI score (R = 0.27), we found no significant association between beverage intake and DED symptoms.
Conclusion
This is the first study to highlight the association between DED symptoms and daily beverage intake. We found a significant association between DED symptoms and female sex. However, no significant association was found between DED symptoms and other demographic characteristics or beverage intake.
Introduction
Simplifying and refining the definition of dry eye disease (DED) from its original definition by the Dry Eye Workshop (DEWS) II has been discussed in the literature since 2015. The refined definition according to the Tear Film & Ocular Surface Society (TFOS) DEWS II is
Dry eye is a multifactorial disease of the ocular surface characterized by a loss of homeostasis of the tear film, and accompanied by ocular symptoms, in which tear film instability and hyperosmolarity, ocular surface inflammation and damage, and neurosensory abnormalities play etiological roles.Citation1
This new definition has dramatically changed the concept of DED as it not only includes the specific signs and symptoms, but also emphasizes tear film homeostasis. The fundamental ocular symptoms remain the same: discomfort and visual disturbance.Citation1
A study conducted in 2021 reported an estimated global DED prevalence of 11.59%.Citation2 In Saudi Arabia, one study conducted in a coastal population found a prevalence of symptomatic DED of 62.4% in predominantly women.Citation3 Moreover in Al-Ahsa, Saudi Arabia, the prevalence of DED among 1858 participants from different primary health care centers was 32.1%; DED was significantly associated with older age, female sex, and diabetes mellitus.Citation4 In Riyadh, 890 participants aged 40 years and older were recruited in a study, and the presence of DED was observed in one third of the participants and was more common in women.Citation5
DED has multiple variants and a wide range of severity, from asymptomatic presentation to severely debilitating. This wide spectrum of presentations along with the absence of a universal consensus on the diagnostic criteria is challenging as there is no “gold standard” test for screening and diagnosis of DED. Several subjective and objective tools for the assessment of signs and symptoms have been used, including the Dry Eye Questionnaire (DEQ), Ocular Surface Disease Index (OSDI), and Impact of Dry Eye on Everyday Life (IDEEL) questionnaire. Widely used objective tests for the assessment of homeostasis markers include, but are not limited to: tear film breakup time, Fluorescein breakup time, the Schirmer test, tear film osmolarity, ocular surface staining, ocular/conjunctival redness, meibography, and blink/lid closure analysis.Citation6
A sequential diagnostic methodology was established by the TFOS DEWS II Diagnostic Methodology Subcommittee, including the most reliable tests for screening, diagnosis, and subtype classification. The diagnostic methodology emphasizes following a sequence from the least invasive to most invasive tests. For this study, we used the OSDI as the preferred screening tool for DED as it is the most commonly used tool in clinical trials, and its reliability and validity have been strongly established.Citation6,Citation7
Multiple studies have reported that DED prevalence was associated with many risk factors, including age, and that the prevalence of DED increases with age. A study conducted in Saudi Arabia found that increasing age (> 56 years old) was an important risk factor for DED, with a prevalence of 36.9%.Citation4 Women also appeared to be more affected than men. A Korean study reported that sex was a major risk factor, with a prevalence nearly double in women.Citation8
Systemic dehydration has been found to be associated with DED. A study done in 2015 reported that systemic hydration status might have a major role in ocular pathophysiologic processes and that dehydration may lead to the development of DED.Citation9 Another study in 2012 compared plasma osmolality in a group of dry eye patients with a control group and found that plasma osmolality was higher among patients with DED when compared to the control group.Citation10 This association is attributed to the finding that plasma osmolality was strongly correlated with tear osmolarity, and increases in plasma osmolality are reflected by tear osmolarity, which plays a major role in DED. This finding has led to interest in using tear osmolarity as a rapid and minimally invasive measure to reflect systemic hydration.Citation11
Although there is no gold standard hydration status marker, previous methods used to determine hydration status include body mass changes, urine indices, and blood borne indices.Citation12,Citation13 However, self-reported beverage intake can be a useful marker for determining hydration status.Citation14,Citation15
Therefore, we hypothesized that daily beverage intake may be associated with the ocular surface symptoms of DED. To the best of our knowledge, no previous epidemiological study has investigated the relationship between decreased beverage intake and the occurrence of DED symptoms.
Materials and Methods
Study Design, Setting, and Population
This was a questionnaire-based, cross-sectional study conducted between January and June 2021 among adults of the general population in the Kingdom of Saudi Arabia.
Inclusion and Exclusion Criteria
Men and women older than 18 years were included in the present study. However, participants aged less than 18 years; contact lenses wearers; participants with existing eye disease (excluding refractive errors), history of eye surgery (including corrective eye surgeries), and autoimmune diseases (rheumatoid arthritis, systemic lupus erythematosus, Sjogren’s syndrome); or those taking specific medications including antidepressants, antihistamines, and diuretics were excluded.
Sampling
A DED prevalence of 62.4% previously reported in a study by Alharbi et alCitation3 was applied to find the optimal sample size. Using the categorical sample size formula of N = Z2(pq)/e2, where N = sample size, Z = confidence level (2.58), p = estimated proportion of the event (taken from the previous study), q = 1 – p, and e = margin of error (0.05), the sample size required to detect a statistically significant results with 99% confidence levels and a 0.05 margin of error assuming a two-tailed statistical test was 624.7, or 625.
Data Collection
Data were collected using questionnaires including one related to sociodemographic characteristics and two Arabic versions of validated questionnaires that measure dry eye symptoms and habitual daily beverage intake. The questionnaires were distributed via a SurveyMonkey (SurveyMonkey Inc., San Mateo, CA, USA) link among the recruited participants on popular social media platforms (Twitter and WhatsApp) to reach participants in the various regions of the Kingdom. Randomly selected large groups and public as well as personal accounts on these platforms were targeted and invited to participate in the study. Upon accessing the link, the participants were able to read all information related to the aim of the study, their rights, type of information requested, and the confidentiality of the acquired data. The participants were advised that clicking the “Next” button confirmed their willingness to participate in the study.
Ocular Surface Disease Index
The OSDI is a validated 12-item questionnaire used to assess the severity of DED symptoms and its related impact on daily functioning. It is scored on a scale of 0 to 4, where 0 indicates none of the time; 1, some of the time; 2, half of the time; 3, most of the time; and 4, all the time. The total OSDI score was then calculated on the basis of the following formula: OSDI = ([sum of scores for all questions answered] × 100)/[total number of questions answered] × 4).Citation7 A final score is calculated which ranges from 0 to 100 with scores 0 to 12 representing normal, 13 to 22 representing mild dry eye disease, 23 to 32 representing moderate dry eye disease, and greater than 33 representing severe dry eye disease.Citation6,Citation7
Beverage Intake Questionnaire
The Beverage Intake Questionnaire (BEVQ-15) is a validated questionnaire that estimates the habitual average daily intake of 15 beverage categories. The participant is asked to indicate “How often” and “How much each time” they drink of each beverage in the past month.Citation16 Then, the average daily intake of all beverages is generated using an automated scoring system. Permission to use, translate, remove beverages that are not consumed in Saudi culture (wine, beer, hard liquor), and change the unit of measure from fluid ounces to mL was obtained from the developer of the BEVQ-15.Citation16 After making these changes, a pilot study was conducted to assess the validity and reliability of the questionnaire, and the Cronbach alpha coefficient was 0.858 indicating very good internal consistency.
Statistical Analysis
Data extraction, management, coding, and cleaning were performed using Excel (Microsoft Corp., Redmond, WA, USA). Data were then exported to SPSS Version 26.0 (IBM Corp., Armonk, NY, USA) for the analysis. Descriptive analysis was conducted; categorical variables were presented as numbers (percentages), while continuous variables were described as means ± standard deviations and ranges (minimum–maximum). Inferential analysis was then conducted to investigate the associations between categorical variables using the chi-squared test; the Pearson correlation coefficient was used to investigate correlations. Student’s t-test was used to compare continuous variables. Non-parametric tests were used alternatively whenever indicated. Confidence intervals were set at 95%, and a p value below 0.05 was used as an indicator of statistical significance.
Results
Data were collected from 1183 participants. After we excluded 568 based on the study exclusion criteria,a total of 615 participant were included in the current study. The majority of participants were 18–34 years old (450, 73.2%); 93 were 35–44 years old (15.1%). Men exceeded women by approximately 1.5-fold (381, 62% vs 234, 38%). Most participants were from the Central region of Saudi Arabia (391, 63.6%), followed by the Eastern region (111, 18%). The demographic characteristics of the participants are detailed in .
Table 1 Characteristic of the Participants
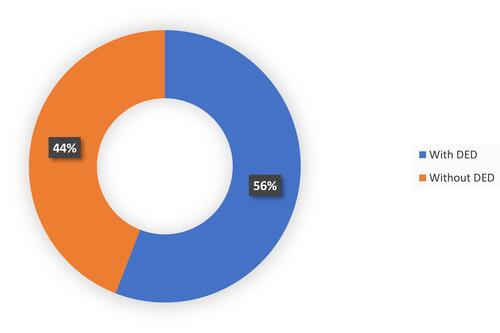
The OSDI scores indicated that 271 (44.1%) participants did not have DED, 145 (23.6%) had mild DED, and 106 (17.2%) and 93 (15.1%) had moderate and severe dry eyes, respectively. illustrates the distribution of disease severity. Moreover, disaggregation of participants according to the presence of any DED symptoms yielded that 344 (55.9%) had DED while 217 (44%) did not have DED. shows this disaggregation in detail.
Figure 1 Prevalence of dry eye disease and its severity.
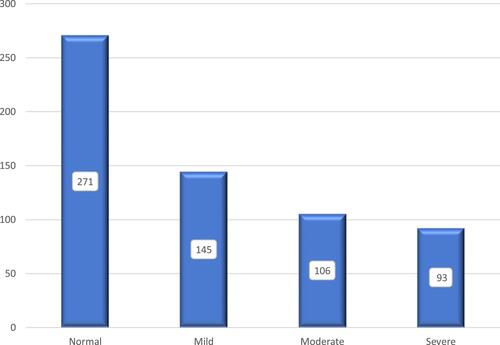
Figure 2 Disaggregation of dry eye disease according to presence of symptoms.
Meanwhile, the overall mean (standard deviation), (minimum–maximum) of the daily beverage intake was 2380.9 mL (1368.2), (98.2–9502.6), and the overall average OSDI score was 17.4 (15.5), (0.0–81.3).
The univariate analysis showed that there was a statistically significant association between sex and developing DED symptoms (p = 0.012) while there were no significant associations between developing DED symptoms and age groups or the region of residency (p = 0.165 and 0.991 for age and residency, respectively). shows the findings of the univariate analysis of demographic characteristics and disease-positive cases.
Table 2 Association Between Participants Characteristics and the Presence of Dry Eye Disease
Furthermore, regarding the association between demographic characteristics and disease symptoms severity, there were no clear associations between severity and age (p = 0.489), or with region of residency (p = 0.971). However, the association remained statistically significant with sex (p = 0.015). Details of that relationship can be seen in .
Table 3 Association Between Participants Characteristics and the Severity of Dry Eye Disease
Additionally, we investigated the association between average beverage intake and DED symptoms severity and found no statistical association (p = 0.432). This fact was also confirmed while comparing the beverage intake between those with and without DED symptoms (p value difference of 0.117). Nevertheless, the correlation between OSDI score and beverage intake was found to be moderate (R = 0.27); however, it did not reach statistical significance (p = 0.501).
Discussion
A total of 615 participants were enrolled in this study, and the majority of participants were men aged 18–34 years. Most of the participants were from the Central region, followed by the Eastern region. As shown in , the prevalence of DED in our participants was 55.9%, the majority of which had mild DED (23.6%). The prevalence is similar to that in a study conducted in Dubai (62.6%)Citation17 and in the Eastern region of Saudi Arabia (62.4%).Citation3 However, in a study conducted in Al-Ahsa, the prevalence was lower (32.1%).Citation4 In another study conducted in Saudi Arabia, the prevalence of DED was as high as 84.5% of participants.Citation18 These discrepancies in prevalence could be explained by the different methods and tools used to identify DED symptoms, different definitions of DED, the variations in terms of climates and lifestyles.
Women, in general, are more likely to develop DED symptoms compared to men due to the presence of more comorbidities that are considered risk factors for DED. These factors include allergies, autoimmune diseases, neuropathic pain, and chronic pain syndrome.Citation19 Moreover, higher estrogen levels are associated with disturbed tear film production.Citation17,Citation20 We found a significant association between sex and DED symptoms, in which 62.4% of women had DED symptoms compared to 51.9% of men. This is in line with studies conducted in Dubai,Citation17 Korea,Citation8 and the Eastern region of Saudi Arabia.Citation3 Conversely, some studies found no significant association between sex and OSDI score.Citation21,Citation22 Although several studies have shown a significant association between age group and DED,Citation4,Citation17 our results revealed no such association.
Regarding the association between beverage intake and DED symptoms as measured by OSDI score, there is a paucity of studies investigating this issue. This lack of similar studies limited our ability to compare our study findings, discuss their significance, and determine whether our results can be generalized for other populations. However, although beverage intake was moderately correlated to OSDI score, we found no significant association between beverage intake and DED symptoms. In agreement with our findings, a previous study reported no significant association between OSDI score and Ramadan fasting although they did not quantify the participants’ beverage intake.Citation23
This was the first study to investigate the association between daily beverage intake and DED symptoms. Moreover, it was novel in terms that it explored the habitual daily beverage intake of all beverages consumed among the general population of the Kingdom of Saudi Arabia. Previous studies focused on either a specific type of beverage or specific populations in the Kingdom.Citation24,Citation25 Limitations of this study are represented by the young male dominance of the sample, lack of comparative data, lack of objective measures for the DED diagnosis as well as lack of clinical screening for exclusion criteria.
Conclusions
This is the first study to highlight the association between DED symptoms and daily beverage intake. We found a significant association between DED symptoms and female sex. However, no significant association was found between DED symptoms and other demographic characteristics or beverage intake.
Abbreviations
BEVQ-15, Beverage Intake Questionnaire; DED, dry eye disease; DEWS, Dry Eye Workshop; OSDI, Ocular Surface Disease Index; TFOS, Tear Film & Ocular Surface Society; US, United States.
Ethics Approval and Informed Consent
This study was approved by the Majmaah University Ethics Committee and was conducted in accordance with the principles stated in the Declaration of Helsinki. All participants provided informed consent to participate. The data obtained in this study were only utilized for the purpose of this study.
Acknowledgments
The authors would like to thank the study participants, the survey team, and everyone who helped facilitating the conduction of this study.
Disclosure
The authors declare that they have no conflicts of interest for this work.
Additional information
Funding
References
- Craig JP, Nichols KK, Akpek EK, et al. TFOS DEWS II definition and classification report. Ocul Surf. 2017;15(3):276–283. doi:10.1016/j.jtos.2017.05.008
- Papas EB. The global prevalence of dry eye disease: a Bayesian view. Ophthalmic Physiol Opt. 2021;41(6):1254–1266. doi:10.1111/opo.12888
- Alharbi AJ, Alanazi NA, Alhamad JR, et al. Prevalence of symptomatic dry eye and its risk factors among coastal population in Eastern Province of Saudi Arabia. EC Ophthalmol. 2019;10(6):503–509.
- Alshamrani AA, Almousa AS, Almulhim AA, et al. Prevalence and risk factors of dry eye symptoms in a Saudi Arabian population. Middle East Afr J Ophthalmol. 2017;24(2):67–73. doi:10.4103/meajo.MEAJO_281_16
- Yasir ZH, Chauhan D, Khandekar R, Souru C, Varghese S. Prevalence and determinants of dry eye disease among 40 years and older population of Riyadh (Except Capital), Saudi Arabia. Middle East Afr J Ophthalmol. 2019;26(1):27–32. doi:10.4103/meajo.MEAJO_194_18
- Wolffsohn JS, Arita R, Chalmers R, et al. TFOS DEWS II diagnostic methodology report. Ocul Surf. 2017;15(3):539–574. doi:10.1016/j.jtos.2017.05.001
- Schiffman RM, Christianson MD, Jacobsen G, Hirsch JD, Reis BL. Reliability and validity of the ocular surface disease index. Arch Ophthalmol. 2000;118(5):615–621. doi:10.1001/archopht.118.5.615
- Ahn JM, Lee SH, Rim TH, et al. Prevalence of and risk factors associated with dry eye: the Korea National Health and Nutrition Examination Survey 2010–2011. Am J Ophthalmol. 2014;158(6):1205–14 e7. doi:10.1016/j.ajo.2014.08.021
- Sherwin JC, Kokavec J, Thornton SN. Hydration, fluid regulation and the eye: in health and disease. Clin Exp Ophthalmol. 2015;43(8):749–764. doi:10.1111/ceo.12546
- Walsh NP, Fortes MB, Raymond-Barker P, et al. Is whole-body hydration an important consideration in dry eye? Invest Ophthalmol Vis Sci. 2012;53(10):6622–6627. doi:10.1167/iovs.12-10175
- Fortes MB, Diment BC, Di Felice U, et al. Tear fluid osmolarity as a potential marker of hydration status. Med Sci Sports Exerc. 2011;43(8):1590–1597. doi:10.1249/MSS.0b013e31820e7cb6
- Bak ATA, Tsiami A, Greene C. Methods of assessment of hydration status and their usefulness in detecting dehydration in the elderly. Curr Res Nutr Food Sci. 2017;5(2):43–54. doi:10.12944/CRNFSJ.5.2.01
- Shirreffs SM. Markers of hydration status. Eur J Clin Nutr. 2003;57(Suppl 2):S6–9. doi:10.1038/sj.ejcn.1601895
- Karabudak E, Koksal E. Validity and reliability of beverage intake questionnaire: evaluating hydration status. Nutr Hosp. 2016;33(5):577. doi:10.20960/nh.577
- Nissensohn M, Ruano C, Serra-Majem L. Validation of beverage intake methods vs. hydration biomarkers; a short review. Nutr Hosp. 2013;28(6):1815–1819. doi:10.3305/nutrhosp.v28in06.6886
- Hedrick VE, Savla J, Comber DL, et al. Development of a brief questionnaire to assess habitual beverage intake (BEVQ-15): sugar-sweetened beverages and total beverage energy intake. J Acad Nutr Diet. 2012;112(6):840–849. doi:10.1016/j.jand.2012.01.023
- Alkabbani S, Jeyaseelan L, Rao AP, Thakur SP, Warhekar PT. The prevalence, severity, and risk factors for dry eye disease in Dubai - a cross sectional study. BMC Ophthalmol. 2021;21(1):219. doi:10.1186/s12886-021-01978-4
- Almutairi AH, Alalawi BS, Badr GH, Alawaz RA, Albarry M, Elbadawy HM. Prevalence of dry eye syndrome in association with the use of contact lenses in Saudi Arabia. BMC Ophthalmol. 2021;21(1):147. doi:10.1186/s12886-021-01912-8
- Vehof J, Sillevis Smitt-Kamminga N, Nibourg SA, Hammond CJ. Sex differences in clinical characteristics of dry eye disease. Ocul Surf. 2018;16(2):242–248. doi:10.1016/j.jtos.2018.01.001
- Maurya RP, Gupta A, Verma S, et al. Sex hormones and dry eye disease: current update. IP Int J Ocul Oncol Oculoplasty. 2021;7(2):139–150. doi:10.18231/j.ijooo.2021.029
- Sherry A, Aridi M, Ghach W. Prevalence and risk factors of symptomatic dry eye disease in Lebanon. Cont Lens Anterior Eye. 2020;43(4):355–358. doi:10.1016/j.clae.2019.08.001
- Teo CHY, Ong HS, Liu YC, Tong L. Meibomian gland dysfunction is the primary determinant of dry eye symptoms: analysis of 2346 patients. Ocul Surf. 2020;18(4):604–612. doi:10.1016/j.jtos.2020.06.008
- Armstrong BK, Coc IR, Agarwal P, Smith S, Navon S. Association of Ramadan daytime fasting with ocular surface inflammation and dry eye. Int Ophthalmol. 2019;39(12):2857–2863. doi:10.1007/s10792-019-01133-5
- Islam MA, Al-Karasneh AF, Hussain AB, et al. Assessment of beverage consumption by young adults in Saudi Arabia. Saudi Pharm J. 2020;28(12):1635–1647. doi:10.1016/j.jsps.2020.10.010
- Quadri FA, Hendriyani H, Pramono A, Jafer M. Knowledge, attitudes and practices of sweet food and beverage consumption and its association with dental caries among schoolchildren in Jazan, Saudi Arabia. East Mediterr Health J. 2015;21(6):403–411. doi:10.26719/2015.21.6.403