Abstract
Background
To study the relationship between retinal perfusion around the macula and the foveal thickness in branch retinal vein occlusion (BRVO).
Methods
Seventy-four eyes of 74 consecutive patients with BRVO were enrolled. We developed a new grading system to evaluate the status of retinal perfusion around the macula in three grades: full perfusion area (FPA), partial perfusion area (PPA), and nonperfusion area (NPA), using fluorescein angiography. The correlation was assessed between these grades and the central foveal thickness (CFT) measured by optical coherence tomography. We also determined the area with the closest correlation between the perfusion status and the foveal thickness by comparing the correlation coefficient in areas of 1-, 2-, and 3-disc diameter (DD) horizontal hemicircles centered at the fovea. The correlation was determined between the extent of each perfusion grade and CFT.
Results
We found a significant negative correlation between the CFT and the FPA (r = 0.31, P = 0.006) and a significant positive correlation between the CFT and the PPA (r = 0.45, P < 0.001) in the three areas. The most significant correlations were found in the 2-DD area. Interestingly, the NPA has not correlated with the foveal thickness in any areas.
Conclusion
The areas of partial but not complete capillary loss seem to be responsible for the macular edema associated with BRVO. Treatments targeting leakage from the dilated capillaries in the PPA should be investigated.
Introduction
Branch retinal vein occlusion (BRVO) is the second most common retinal vascular disease after diabetic retinopathy,Citation1–Citation4 and macular edema is the most common cause of chronic visual loss in BRVO.Citation5,Citation6 Currently, no efficacious treatment for macular edema associated with BRVO is available, but various treatment options have been advocated.Citation2,Citation4,Citation7–Citation10 Insufficient understanding of the pathophysiology of macular edema in BRVO may be the cause of the limited success of current therapies.
Several studies have reported a relationship between status of retinal perfusion and macular edema in BRVO. Noma et al reported a positive correlation between the severity of macular edema seen on optical coherence tomography (OCT) images and size of the nonperfusion area, which can be anywhere in the fundus.Citation11 Prasad et al also reported that the incidence of macular edema was significantly associated with nonperfusion on ultrawide field angiography in any location, specifically anterior to the equator.Citation12 However, conflicting reports have been published about the perfusion status around the macula.Citation2,Citation13,Citation14 Shilling and Jones found that ischemic macular edema caused visual acuity to worsen compared with perfused macular edema,Citation2 and Shroff et al reported the same result using OCT in a prospective study.Citation13 However, Finkelstein reported a positive effect of ischemic macular edema on the visual prognosis after a mean follow-up of 39 months.Citation14 We speculated that these discrepancies can be attributed not only to varying numbers of eyes, heterogeneity of methods, and outcomes across studies, but also to variability in definitions of perfusion status. Those reports did not clearly define capillary nonperfusion or delineate the areas of perfusion or nonperfusion.
The nonperfusion area is defined as the area with occluded retinal capillaries. In BRVO, capillary occlusion can be a more continuous process rather than one with discrete changes, ie, sudden alterations from normal perfusion to total obstruction. In addition, total obstruction of the capillaries often involves precapillary arterioles, which are upstream of the capillaries, and postcapillary venules, which are downstream of the capillaries. However, few studies have reported the relevance of involvement of these vessels in the pathophysiology of the nonperfusion area.
To eliminate variability in the definitions of perfusion status, we developed a new grading system that defines the vascular changes, and includes capillaries and precapillary and postcapillary vessels seen on fluorescein angiography images, and classified the changes into three grades, ie, full perfusion, partial perfusion, and complete obstruction. Using this classification, we evaluated the correlations between macular edema and the proportion of each perfusion grade around the macula in a relatively large retrospective series of patients with BRVO.
Materials and methods
We retrospectively analyzed consecutive patients with BRVO who were referred to the Department of Ophthalmology of Osaka University Hospital from January 1, 2007 to August 1, 2009. We reviewed the medical and ocular histories of all patients. All patients who underwent complete ophthalmic examinations including measurement of visual acuity, slit-lamp examination, indirect ophthalmoscopy, spectral-domain OCT (Cirrus HD-OCT, Carl Zeiss, Dublin, CA), and fluorescein angiography using a fundus camera (Topcon TRC50 LX, Topcon, Tokyo, Japan) or confocal scanning laser ophthalmoscope (Heidelberg Retina Angiograph, Heidelberg Engineering, Heidelberg, Germany) were enrolled in this observational study. The study followed the tenets of the Declaration of Helsinki. All participants provided written informed consent before they underwent fluorescein angiography.
The inclusion criterion was a minimal follow-up period of 12 months regardless of treatment, except for retinal photocoagulation. Exclusion criteria included the presence of central or hemicentral retinal vein occlusion and other retinal disorders, including epiretinal membranes, macular holes, diabetic retinopathy, or a history of retinal photocoagulation. We also excluded patients who had not undergone fluorescein angiography and OCT for at least 3 months following sub-tenon triamcinolone or injection of intravitreal bevacizumab (Avastin®, Genentech, South San Francisco, CA) and for at least 6 months following intravitreal triamcinolone and pars plana vitrectomy.
We classified retinal perfusion status around the macula areas as follows: full perfusion area, partial perfusion area, and nonperfusion area (). Full perfusion area was defined as the presence of normal perfusion with normal fluorescein images, with no retinal capillary changes or minimal dilation. Partial perfusion area was defined as the presence of a cluster of small fragmented areas of hypofluorescence with dilation and irregular patterns of the capillary network (microcapillary loss between the remaining dilated capillaries, ). Nonperfusion area was defined as a continuous area of hypofluorescence due not only to retinal capillary loss but also to obstruction of the precapillary arterioles and postcapillary venules, with the remaining precapillary arterioles and postcapillary venules dilated and tortuous ().
Figure 1 (A) Fluorescent angiogram of branch retinal vein occlusion that contains partial perfusion areas showing clusters of small fragmented areas of hypofluorescence with dilation and irregular capillary network patterns (microcapillary loss between the remaining dilated capillaries). (B) Fluorescent angiogram shows the perfusion status around the macula.
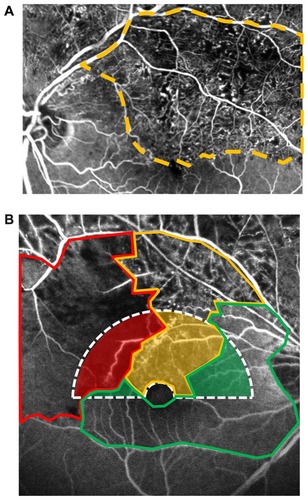
Table 1 Definitions of perfusion status in branch retinal vein occlusion in this study
To avoid confusion between nonperfusion and blocked fluorescence (hypofluorescence due to retinal hemorrhages on fluorescein angiography images), the angiographic evaluation was performed after the major hemorrhage was absorbed, which was at least 6 months after the onset of BRVO. Configurations of the retinal vessels and hypofluorescent areas were evaluated in the early phase (about 30 seconds after intravenous injection of fluorescein). The fluorescein angiography images were digitized using the IMAGEnet R4 system (Topcon). Three masked retinal specialists (SS, MS, MK) classified the perfusion status. They drew lines around each area graded and measured the area using the automatic measurement mode in the IMAGEnet R4 system. The horizontal hemicircular area centered on the side of the fovea where BRVO was assessed (). The foveal avascular zone (the 0.5-disc diameter area) centered on the fovea was excluded from the hemicircular area. The proportions of full perfusion area, partial perfusion area, and nonperfusion area in the hemicircular area were calculated.
Central foveal thickness was measured using spectral-domain OCT Stratus 4 software (Carl Zeiss Meditec Inc, Oberkochen, Germany). For cases in which the computer erred in recognizing the outer or inner retinal boundaries, central foveal thickness was measured using the caliper in the software.
Associations between proportions of each perfusion grade and OCT measurements were evaluated using Spearman’s correlation coefficients. To determine the most appropriate size to be analyzed, we compared three different sizes of the areas (1-, 2-, and 3-disc diameter) by comparing their correlation coefficients. Best-corrected visual acuity was measured on the same day as the OCT and fluorescein angiography examinations were performed. Visual acuity was converted to the logarithm of minimal angle of resolution (logMAR) scale, and the association between visual acuity and proportion of each area of perfusion was analyzed. Statistical evaluation was performed using JMP software version 8.0 (SAS Inc, Cary, NC). Interobserver agreements were also assessed using Spearman’s correlation coefficient.Citation15P < 0.05 was considered to be statistically significant.
Results
We reviewed 93 fluorescein angiograms from 93 patients (93 eyes) who had undergone complete ophthalmic examinations and were followed for more than 12 months. Of the 93 eyes, 19 were excluded, including two eyes with diabetic retinopathy, three eyes which underwent photocoagulation, and 14 eyes which had undergone an intervention within 3 or 6 months before evaluation. Seventy-four eyes of 74 patients met the criteria for subsequent data analysis.
Demographic data for the patients in this analysis are summarized in . Mean patient age was 66.9 ± 9.2 (range 50–88) years, and 27 patients (36.5%) were men. The average period from the first visit to fluorescein angiography and OCT examination was 8.9 ± 4.0 (range 6–25) months. The mean logMAR visual acuity was 0.28 ± 0.28 (median 0.22; range −0.176–1.055) at the time of assessment. A total of 44 patients underwent some treatment, ie, intravitreal bevacizumab (n = 28), intravitreal triamcinolone (n = 1), sub-tenon triamcinolone (n = 15), or pars plana vitrectomy (n = 6) before evaluation, with washout periods.
Table 2 Baseline characteristics at the time of fluorescein angiography
The median proportions of the full perfusion area, partial perfusion area, and nonperfusion area were 22.34% (mean 31.4%), 49.00% (mean 47.4%), and 11.24% (mean 20.9%), respectively, in the 1-disc diameter hemicircular areas. Likewise, the proportions of the full perfusion area, partial perfusion area, and nonperfusion area were 31.21% (mean 38.2%), 42.59% (mean 41.9%), and 10.55% (mean 20.1%) in the 2-disc diameter area, and 34.51% (mean 41.6%), 30.51% (mean 37.2%), and 7.83% (mean 21.2%) in the 3-disc diameter area, respectively ().
Table 3 Median percentage in the hemicircular area
Average central foveal thickness seen on OCT images was 418.4 ± 134.6 (range 208–677) μm. No serous retinal detachments developed in any patient at the time of evaluation.
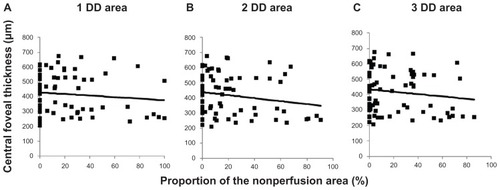
Spearman’s correlation analyses showed a significant negative correlation between central foveal thickness and the proportion of the full perfusion area, a significant positive correlation between the central foveal thickness, and the proportion of the partial perfusion area, and no significant correlation between central foveal thickness and the proportion of the nonperfusion area in the 1-DD hemicircular area (full perfusion area, r = 0.30, P = 0.011), partial perfusion area, r = 0.39, P = 0.001; nonperfusion area, r = 0.11, P = 0.361. These correlation patterns were also detected in the other disc diameter areas (2-disc diameter, full perfusion area, r = 0.31, P = 0.006; partial perfusion area, r = 0.45, P < 0.001; nonperfusion area, r = 0.18, P = 0.120; 3-disc diameter, full perfusion area, r = 0.24, P = 0.040; partial perfusion area, r = 0.35, P = 0.002; nonperfusion area, r = 0.14, P = 0.23, –). We identified stronger associations in the 2-disc diameter area than in the 1-disc diameter and 3-disc diameter areas. No grades were significantly associated with visual acuity (data not shown).
Figure 2 Inverse correlation between central foveal thickness and the proportions of the full perfusion area. The plots show central foveal thickness and percentages of the full perfusion area in (A) the 1-disc diameter (r = 0.30, P = 0.011), (B) the 2-disc diameter (r = 0.31, P = 0.006), and (C) the 3-disc diameter (r = 0.24, P = 0.040) areas.
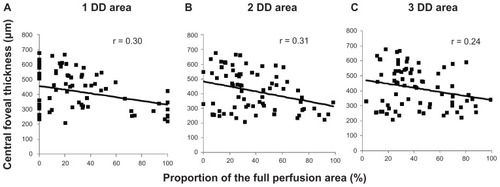
Figure 3 Correlation between central foveal thickness and percentage of the partial perfusion area. The plots show the central foveal thickness and the percentages of the partial perfusion area in (A) the 1-disc diameter (r = 0.39, P = 0.001), (B) the 2-disc diameter (r = 0.45, P < 0.001), and (C) the 3-disc diameter (r = 0.35, P = 0.002) areas.
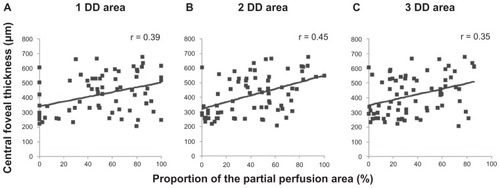
Figure 4 Central foveal thickness is not associated with the percentage of the nonperfusion area. The plots show central foveal thickness and the percentages of the nonperfusion area in (A) the 1-disc diameter (r = 0.11, P = 0.361), (B) the 2-disc diameter (r = 0.18, P = 0.120), and (C) the 3-disc diameter (r = 0.14, P = 0.23) areas.
Discussion
In the current study, we developed a new grading system for BRVO that divides perfusion status into three grades ( and ). Analysis of the association between proportions of each grade and degree of macular edema show that an increased area of normal perfusion was associated with less macular edema, and an increased area of partial perfusion was associated with more macular edema. Therefore, we proposed that partial perfusion area is responsible for the development of macular edema in BRVO.
Physicians should be more alert to residual tortuous dilated vessels in the partial perfusion area, which are often hyperfluorescent on later-phase fluorescein angiography images, as a source of macular edema. We do not identify these vessels as collaterals, which generally are at the boundary between the drainage area of the occluded vein and the adjacent venous drainage areas.Citation16,Citation17 In our angiographic analysis, these dilated, tortuous vessels are often within hypofluorescent areas and not always at the boundary. We have speculated that these vessels are dilated capillaries that have accommodated to the various pathological changes, including hypoxia, increased influx due to occlusion of other capillaries, and loss of pericytes.Citation18 This speculation is supported by a previous study reporting that increased luminal pressure distal to the obstruction site increases transduction of blood and interstitial fluid pressure.Citation19 Unfortunately, due to a lack of tools, we could not show direct evidence of hypoxia, increased influx due to occlusion of other capillaries, or loss of pericytes.
Another interesting finding of the current study was that there was no significant association between macular edema and nonperfusion area, which differs from previous reports.Citation2,Citation13,Citation14 The presence of ischemia positivelyCitation2,Citation13 affects development of macular edema. However, in the current series, a larger nonperfusion area did not result in substantial macular edema. We have speculated that this discrepancy might be attributed to differences in definitions of nonperfusion area. In the current study, we defined nonperfusion area not only as loss of capillaries but also as loss of precapillary and postcapillary vessels. Both capillary and precapillary and postcapillary vessel loss might lead to elimination of the leakage source itself. Namely, vascular endothelial growth factor might be secreted in the hypoxic areas,Citation20,Citation21 and vessels in these areas could be the source of extravascular leakage. However, as the nonperfusion area increases, the number of vessels decreases, which results in fewer sources of leakage and may account for the lack of macular edema associated with a large nonperfusion area. This explains the results () in cases in which a nonperfusion area involving more than 80% of the evaluated area had less macular edema. Thus, our findings in nonperfusion area are partly consistent with those of FinkelsteinCitation14 who reported that cases with macular ischemia had less macular edema and a significantly improved visual prognosis without photocoagulation. We speculate that he might have used a definition of macular ischemia similar to that of the nonperfusion area in the current study, and other investigators who reported nonperfusion areas as having worse macular edema might have defined areas of nonperfusion or ischemia as a mixture of the nonperfusion area and partial perfusion area in the current study.
Interestingly, 2-disc diameter areas had the strongest negative correlation between macular edema and full perfusion area and the strongest positive correlation between macular edema and partial perfusion area compared with the 1-disc diameter and 3-disc diameter areas. This implies that the vascular status in an area of about 2-disc diameter involves macular edema. This finding may lead to development of treatments to decrease leakage in these areas.
Visual acuity was not significantly associated with the proportion of each grade in the current study, which agrees with a previous study in which visual acuity was mildly but not strongly associated with foveal thickness measured by OCT.Citation22 This is explained by the fact that visual acuity is determined not only by foveal thickness but also by numerous other factors, including disruption of the photoreceptor inner segment/outer segment junction,Citation23 posterior vitreous detachment,Citation24 site and degree of occlusion, and efficiency of the developing collateral circulation.Citation25 Furthermore, BRVO affects the superior or inferior half of the retina, and there is less macular edema in the unaffected side, which results in some degree of vision sparing.
The current study had several limitations. First, because it was retrospective, variations in the time points of assessment may have affected the results. However, during the natural course of BRVO, central foveal thickness changes decrease within the first 6 months and stabilize thereafter.Citation13 Because central foveal thickness in the current study was evaluated at least 6 months after the onset of BRVO and the average period from the first visit to examination was 9 months, the effect of the various time points of the examinations should be minimal. Second, in the current study, we assessed only the relationship between central foveal thickness and perfusion status with fluorescein angiography, and we failed to show degrees of ischemia in the partial perfusion area. New devices to detect tissue oxygen levels noninvasively should be used in future studies.
In conclusion, the current study showed a relationship between the status of macular perfusion and macular thickness using a new grading system to evaluate a relatively large series of patients with BRVO. The extent of macular edema was affected by the status of macular perfusion; the partially perfused capillary area but not the area of complete capillary loss seemed to affect the macular edema associated with BRVO. Further studies are warranted to elucidate the detailed mechanisms of macular edema in BRVO, and appropriate therapies should be developed.
Disclosure
The authors did not receive funding or support for this study.
References
- Branch Vein Occlusion Study GroupArgon laser scatter photocoagulation for prevention of neovascularization and vitreous hemorrhage in branch vein occlusion: a randomized clinical trialArch Ophthalmol198610413441
- ShillingJSJonesCARetinal branch vein occlusion: a study of argon laser photocoagulation in the treatment of macular oedemaBr J Ophthalmol19846831961986365157
- RogersSLMcIntoshRLLimLNatural history of branch retinal vein occlusion: an evidence-based systematic reviewOphthalmology201011761094110120430447
- Branch Vein Occlusion Study GroupArgon laser photocoagulation for macular edema in branch vein occlusionAm J Ophthalmol19849832712826383055
- MichelsRGGassJDThe natural course of retinal branch vein obstructionTrans Am Acad Ophthalmol Otolaryngol1974782166177
- GutmanFAZegarraHThe natural course of temporal retinal branch vein occlusionTrans Am Acad Ophthalmol Otolaryngol1974782178192
- RabenaMDPieramiciDJCastellarinAAIntravitreal bevacizumab (Avastin) in the treatment of macular edema secondary to branch retinal vein occlusionRetina200727441942517420692
- KriechbaumKMichelsSPragerFIntravitreal Avastin for macular oedema secondary to retinal vein occlusion: a prospective studyBr J Ophthalmol200892451852218211942
- CekiçOChangSTsengJJIntravitreal triamcinolone injection for treatment of macular edema secondary to branch retinal vein occlusionRetina200525785185516205563
- ChenSDLochheadJPatelCKFrithPIntravitreal triamcinolone acetonide for ischaemic macular oedema caused by branch retinal vein occlusionBr J Ophthalmol200488115415514693796
- NomaHMinamotoAFunatsuHIntravitreal levels of vascular endothelial growth factor and interleukin-6 are correlated with macular edema in branch retinal vein occlusionGraefes Arch Clin Exp Ophthalmol2006244330931516133018
- PrasadPSOliverSCCoffeeREUltra wide-field angiographic characteristics of branch retinal and hemicentral retinal vein occlusionOphthalmology2010117478078420045570
- ShroffDMehtaDKAroraRNatural history of macular status in recent-onset branch retinal vein occlusion: an optical coherence tomography studyInt Ophthalmol200828426126817668149
- FinkelsteinDIschemic macular edema: recognition and favorable natural history in branch vein occlusionArch Ophthalmol199211010142714341417544
- MarcussenNOlsenTSBenediktssonHRacusenLSolezKReproducibility of the Banff classification of renal allograft pathology. Inter- and intraobserver variationTransplantation19956010108310897482712
- ArcherDBDeutmanAErnestJTKrillAEArteriovenous communications of the retinaAm J Ophthalmol1973752224241
- ChristoffersenNLLarsenMPathophysiology and hemodynamics of branch retinal vein occlusionOphthalmology1999106112054206210571337
- FrangiehGTGreenWRBarraquer-SomersEFinkelsteinDHistopathologic study of nine branch retinal vein occlusionsArch Ophthalmol1982100711321140
- CampochiaroPAHafizGShahSMRanibizumab for macular edema due to retinal vein occlusions: Implication of VEGF as a critical stimulatorMol Ther200816479179918362932
- ForsytheJAJiangBHIyerNVActivation of vascular endothelial growth factor gene transcription by hypoxia-inducible factor 1Mol Cell Biol1996169460446138756616
- ShweikiDItinASofferDKeshetEVascular endothelial growth factor induced by hypoxia may mediate hypoxia-initiated angiogenesisNature199235963988438451279431
- ScottIUVan VeldhuisenPCOdenNLSCORE Study report 1: baseline associations between central retinal thickness and visual acuity in patients with retinal vein occlusionOphthalmology2009116350451219167078
- OtaMTsujikawaAMurakamiTFoveal photoreceptor layer in eyes with persistent cystoid macular edema associated with branch retinal vein occlusionAm J Ophthalmol2008145227328018045566
- AvundukAMCetinkayaKKapicioğluZKayaCThe effect of posterior vitreous detachment on the prognosis of branch retinal vein occlusionActa Ophthalmol Scand19977544414429374257
- RehakJRehakMBranch retinal vein occlusion: pathogenesis, visual prognosis, and treatment modalitiesCurr Eye Res2008332111131