 ?Mathematical formulae have been encoded as MathML and are displayed in this HTML version using MathJax in order to improve their display. Uncheck the box to turn MathJax off. This feature requires Javascript. Click on a formula to zoom.
Abstract
Objective
The purpose of this study was to examine the effectiveness of a new analysis method of mfVEP objective perimetry in the early detection of glaucomatous visual field defects compared to the gold standard technique.
Methods and patients
Three groups were tested in this study; normal controls (38 eyes), glaucoma patients (36 eyes), and glaucoma suspect patients (38 eyes). All subjects underwent two standard 24-2 visual field tests: one with the Humphrey Field Analyzer and a single mfVEP test in one session. Analysis of the mfVEP results was carried out using the new analysis protocol: the hemifield sector analysis protocol.
Results
Analysis of the mfVEP showed that the signal to noise ratio (SNR) difference between superior and inferior hemifields was statistically significant between the three groups (analysis of variance, P < 0.001 with a 95% confidence interval, 2.82, 2.89 for normal group; 2.25, 2.29 for glaucoma suspect group; 1.67, 1.73 for glaucoma group). The difference between superior and inferior hemifield sectors and hemi-rings was statistically significant in 11/11 pair of sectors and hemi-rings in the glaucoma patients group (t-test P < 0.001), statistically significant in 5/11 pairs of sectors and hemi-rings in the glaucoma suspect group (t-test P < 0.01), and only 1/11 pair was statistically significant (t-test P < 0.9). The sensitivity and specificity of the hemifield sector analysis protocol in detecting glaucoma was 97% and 86% respectively and 89% and 79% in glaucoma suspects. These results showed that the new analysis protocol was able to confirm existing visual field defects detected by standard perimetry, was able to differentiate between the three study groups with a clear distinction between normal patients and those with suspected glaucoma, and was able to detect early visual field changes not detected by standard perimetry. In addition, the distinction between normal and glaucoma patients was especially clear and significant using this analysis.
Conclusion
The new hemifield sector analysis protocol used in mfVEP testing can be used to detect glaucomatous visual field defects in both glaucoma and glaucoma suspect patients. Using this protocol, it can provide information about focal visual field differences across the horizontal midline, which can be utilized to differentiate between glaucoma and normal subjects. The sensitivity and specificity of the mfVEP test showed very promising results and correlated with other anatomical changes in glaucomatous visual field loss. The intersector analysis protocol can detect early field changes not detected by the standard Humphrey Field Analyzer test.
Introduction
The early diagnosis and effective monitoring of glaucoma are considered major concerns and objectives of almost all of the research studies conducted in the field of glaucoma management. Visual field assessment is still the main monitoring tool that reflects progressive glaucomatous functional loss. It has been reportedCitation1,Citation2 that at least 25%–50% of the retinal ganglion cells must be lost prior to the development of a visual field abnormality detectable with modern automated perimetry. Despite its valuable contribution to the management of glaucoma, standard perimetry is considered a process that has too many inputs related to the operator, patient, and test protocol, which can negatively influence the accuracy of the final outcome. The introduction of standard automated perimetry (SAP) has improved the accuracy and reduced variability errors compared to earlier kinetic perimeters. However, SAP protocols do not provide a fully accurate visual field profile due to many factors influencing the results, including, but not limited to, subjectivity. Despite its disadvantages, which are clearly evident based on the long test duration and variability, full threshold perimetry is considered the gold standard method for visual field assessment in clinical practice and glaucoma related clinical trials.Citation1,Citation3 There is a strong demand for an objective measure of the visual field that can supplement clinical information derived by automated perimetry and other psychophysical tests in the evaluation of glaucoma.Citation4 The multifocal visual evoked potential (mfVEP) is a method for objective assessment of visual field. It has been shown over the past decades that this method can detect glaucomatous visual field defects with high sensitivity and specificity, and it can have a clear role in the detection and monitoring of glaucomatous progression based on good repeatability figures.Citation4–Citation7 The mfVEP is an objective tool that has yet to find its place within accepted clinical practice. The findings of Hood et alCitation8 recorded from about 500 patients highlight the potential clinical uses of the mfVEP as an objective tool in the assessment of glaucomatous visual field defects. It has also been reportedCitation8–Citation12 that the mfVEP is able to detect glaucomatous damage that is undetectable by standard perimetry.
The purpose of this study was to examine the effectiveness of a new analysis method of mfVEP when it is used for objective assessment of visual field in glaucoma. The hemifield sector/hemi-ring analysis (HSA) compares the responses of each sector and hemi-ring in one hemifield of visual field to its mirror image corresponding sector in the opposite hemifield. We also compared the results of this analysis protocol to the SAP. We hypothesized that our protocol provided good sensitivity and specificity levels in the detection of early visual field losses and the detection of existing significant glaucomatous visual field defects.
Methods
This study was conducted at the ophthalmology outpatient clinic, Hamad Medical Corporation, in Doha, Qatar. Study subjects were randomly selected from patients attending the ophthalmology outpatient clinics during the recruitment period, which took place between March and June 2012. Three study groups of participants were recruited: patients with known diagnosis of glaucoma who may or may not be receiving treatment, glaucoma suspect patients who had one or more risk factors for glaucoma but did not have established clinical damage to the optic disc or visual field losses, and a control group (normal patients). Glaucoma patients were enrolled to evaluate the ability of the HSA analysis protocol to detect already documented visual field defects. Glaucoma suspect patients usually have one or more risk factors for glaucoma but are without apparent optic disc damage or a true and reproducible visual field defect detected by SAP, but are considered more susceptible to the development of glaucoma. We enrolled glaucoma suspects into this study in order to detect any differences between the SAP testing and mfVEP perimetry results in the early detection of functional visual field loss secondary to glaucoma changes. Written informed consent was obtained from all participants before enrollment in the study. The testing procedures, risks, and potential side effects were discussed and explained to the study subjects at the time consent was given. The protocol for this study was approved by the ethics committees of Aston University and Hamad Medical Corporation, Doha, Qatar.
All study subjects underwent a pretest assessment, consisting of a full eye examination completed prior to enrollment by a glaucoma specialist, including intraocular pressure, gonioscopy, visual acuity using Snellen chart, slit-lamp assessment of the anterior segment, and retinal examination including the optic nerve head.
Inclusion criteria
Selection criteria for glaucoma and glaucoma suspect patients followed the guidelines of the American Academy of Ophthalmology Preferred Practice Pattern (AAO-PPP) to define glaucoma and glaucoma suspect patients.Citation13 The glaucoma patient group consisted of individuals with diagnosed and well documented features of any type of glaucoma as defined by these guidelines. A glaucoma suspect patient was defined as an individual with clinical findings and/or a constellation of risk factors that indicated an increased likelihood of developing glaucoma, without any anatomical or functional damage to the optic nerve. Normal subjects were recruited after excluding any existing ocular pathology. Both genders were equally invited to participate in this study. There were no language restrictions applied when subjects were recruited.
Exclusion criteria
Subjects suffering from visual field losses due to any pathology other than glaucoma, significant retinal disease with or without macular involvement, established neurological deficits which could affect the visual cortex or visual pathways, or subjects with amblyopia were excluded from this study. Subjects under the age of 16 were not recruited as high levels of variability and poor reliability in SAP have been reported in this group.Citation14–Citation16 Vulnerable subjects suffering from mental or physical disability, and/or severely debilitated patients who need continuous and special care were excluded from this study, as a high level of cooperation and responsiveness was needed to perform study tests.
The mfVEP test
The stimulus
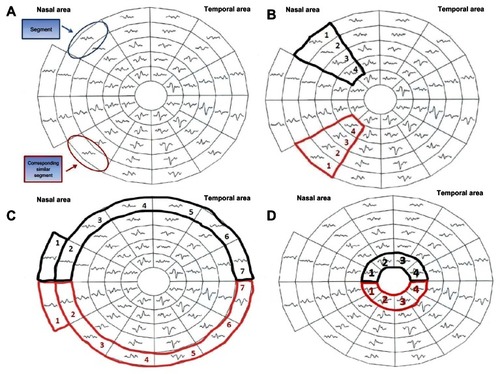
According to the guidelines of the International Society of Clinical Electrophysiology of Vision there is a standard requirement for the multifocal stimulus. We fulfilled this standard using a cathode ray tube (CRT) frame frequency of 75 Hz, which has been widely used.Citation17 For CRT displays, the luminance of the stimulus elements in the light state was at least 100 cd/m2. The luminance of the display in the dark state was low enough to achieve a contrast (Michelson) of ≥90% using an m-sequence to control the temporal sequence of changes between the light and dark stages of each stimulus hexagon. This m-sequence, in which each hexagonal element can change with every frame, is a standard for routine testing. mfVEP recordings were obtained with a dartboard pattern which is a standard option (Dart Board 58 with pattern segments) of the Roland Consult GmbH software, RETIscan (Brandenburg, Germany). A modified version of this pattern has recently been introduced as part of the HSA protocol. The modification is based on the new idea of this research work to record the SNR values of each segment () and calculate the average of the individual sectors that contain fixed numbers of segments (). Each sector SNR value in one hemisphere was compared to its corresponding sector in the other hemisphere to calculate the difference between the two fellow sectors. Similar averaging and calculations were carried out in a hemi-ring group of segments arranged circumferentially around the central part (). SNR values from each of two fellow hemi-rings were compared to see if there was any statistical difference between each couple of sectors/hemi-rings in the three subject groups. There are 58 sectors in this display and each sector contains 16 checks, eight black and eight white. The dartboard pattern covers a central 25° on each side of the fixation point with nasal extension wing up to 42°. The segments, and the checks, are scaled to be of approximately equal effectiveness, based on cortical magnification factors presented by Baseler et al.Citation18 During their enrolment period, each participant underwent two full threshold perimetry tests using the 24-2 Swedish Interactive Threshold Algorithm (SITA) program of the Humphrey Field Analyzer (HFA), separated by one hour. When completed, both eyes were dilated using 0.5% Tropicamide hydrochloride. When both eyes were fully dilated the patient was prepared for mfVEP. Next, the subject was asked to fixate on a screen that projects flickering hexagon patterns into their eye. Each test took between 8 and 16 minutes to complete per eye, during which fixation was manually monitored. The total duration of attendance for each subject ranged between 45–90 minutes, dependent on the individual variations amongst the subjects when undertaking tests. No follow up visits were required; all recordings were taken in a single session.
Figure 1 The 58 segments of the right visual field. The field is divided into two identical hemifields across the horizontal meridian; each segment has a similar correspondent in the opposite hemifield (A) the SNR value is calculated in each segment. The average SNR of the wedge sectors (B) and semi-circular sector; peripheral and central (C and D) are calculated to compare to the fellow corresponding sector on the opposite hemifield.
mfVEP test parameters
To measure the amplitude of the mfVEP responses, the root mean square (RMS) was calculated across a time interval between 0 and 500 milliseconds. RMS is commonly used because it requires only the specification of a time interval rather than the identification of a particular aspect of the response waveform. In addition to measuring the RMS of each of the 58 responses for each eye, a SNR measure was obtained as previously described. In order to obtain the SNR of any segment, a signal window (0–200 milliseconds) and a “noise-only” window (300–500 milliseconds) are specified. The SNR of a given response is obtained by dividing the RMS of the signal window by the average of the 58 segments × 4 channels (232 total RMS values) of the noise-only window.
A response without any signal present would have, on average, a SNR equal to one. The recordings from the four channels are all oriented in polarity so that if a response was present, it should yield a prominent negative component followed by a prominent positive component. There is little or no response present for the record with the SNR around 1.0, and the signal becomes more salient as the SNR increases.
The hemifield sector/hemi-ring analysis (HSA) protocol
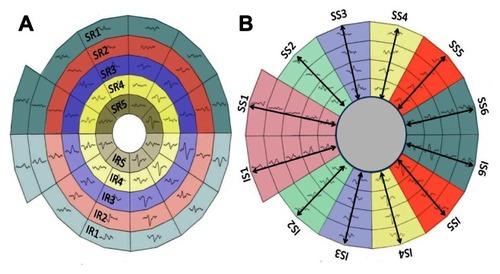
The concept of the analysis protocol described earlier is to compare and divide the mfVEP field into similar (equal) sectors and hemi-rings across the horizontal meridian, where a sector in the superior hemisphere is compared to its corresponding fellow sector in the inferior hemisphere. The allocated sectors and hemi-rings comprise a fixed number of segments (). After the SNR value from each segment is recorded, an average is taken from all the segments allocated to any given sector, yielding a sector average SNR value. This sector SNR value is compared to its corresponding sector across the horizontal meridian, and not the individual segments. Certain measurable parameters were recorded and calculated in this HSA protocol in order to compare the three groups. For instance, the SNR value in each sector/hemi-ring was compared to the corresponding fellow in the opposite hemisphere and differences between them were calculated to check for any significant changes in corresponding sectors/hemi-rings. The same SNR values and differences between sectors/hemi-rings were also compared to the identical locations within the three groups to evaluate significant changes between groups.
Figure 2 The five allocated hemi-rings and their corresponding fellows in both hemispheres (A). The allocated six sectors and their corresponding fellows in both hemispheres (B).
The Humphrey Field Analyzer 24-2 program, SITA standard
All study subjects underwent one or two visual field tests using program 24-2 SITA standard of the HFA. The first examination was a familiarization test, carried out in order to determine reliability errors. If the subject had already undergone full threshold perimetry, this first test was waived. The second test was the study test and all data were recorded and analyzed. The measurable parameters recorded by the HFA test included the mean deviation, the pattern standard deviation, and the glaucoma hemifield test outcome. Most of these parameters were used to grade the severity of any visual field loss.
Statistical analysis
All SNR values from individual sectors/hemi-rings, in all groups, were tested for normality using the Kolmogorov-Smirnov and Shapiro-Wilk tests. It was found that almost all P values were >0.05, indicating a normally distributed sample. One way analysis of variance (ANOVA) and paired t-test were used in the data statistical analysis.
Results
A total of 60 subjects (112 eyes) were recruited for this study; 20 normal subjects (38 eyes), 20 glaucoma suspects (38 eyes), and 20 glaucoma patients (36 eyes). All subjects completed the study tests. All study subjects were able to complete two cycles of the mfVEP test successfully with no significant complaints or side effects. It was noted that in only 3/112 eyes we were required to suspend the test and give the subject a break, during one of the test cycles, upon their request. It was also noted that most of glaucoma and glaucoma suspect patients (29/40) preferred the standard HFA test as a routine method for visual field check, whilst the rest (11/40) reported that the mfVEP was better for various reasons; it was simpler, advanced technology, easier, and less confusing. The test duration for a SITA standard HFA test ranged between 4–11 minutes per eye, while the duration of a single (two cycles) mfVEP test was slightly longer, ranging between 8–16 minutes per eye, excluding preparation time. The mfVEP preparation time was similar in all subjects and ranged between 13–20 minutes per patient. shows the age distribution of all subjects in the three study groups. There was no significant statistical difference in age among the study groups found by one way ANOVA that could have influenced the data (P = 0.964 for normal group, P = 0.964 for glaucoma suspect group, and P = 0.810 for glaucoma group).
Table 1 Analysis of ages in all study groups
The hemifield sector analysis
The normal group
For the majority of the normal subjects both eyes were tested with only two subjects preferring a single eye to be tested. The intersector/hemi-ring differences between corresponding hemifields were tested for significance. For each hemifield, six sectors and five hemi-rings were compared to their corresponding fellows in the opposite hemifield. shows the results in detail; there was only one pair of sectors (1/6) found to be significant, and no hemi-rings (0/5) were found to be significant.
Table 2 Comparison between SNR values in superior and inferior hemifield sectors and rings in the normal group
The glaucoma suspect group
Twenty glaucoma suspect patients (38 eyes) were tested. The majority of patients (9/20) were diagnosed as glaucoma suspect based on high intraocular pressure recorded on multiple occasions, (5/20) had suspicious visual field results but not confirmatory of glaucoma, (3/20) had suspicious optic disc appearances without established damage. The intersector/hemi-ring differences between corresponding hemifields were tested for significance. On each hemifield, six sectors and five hemi-rings were compared to their corresponding fellows in the opposite hemifield. shows that 4/6 sectors were found to have a statistically significant SNR difference when compared to their corresponding fellows, while 1/5 hemi-rings was statistically significant.
Table 3 Comparison between SNR values in superior and inferior hemifield sectors and rings in glaucoma suspect group
The glaucoma group
Twenty glaucoma patients (36 eyes) were tested. The majority of these patients (14/20) had simple open angle glaucoma, (3/20) had narrow angle glaucoma, and (1/20) had pseudoexfoliation glaucoma. There was considerable variation in the severity of glaucomatous field changes amongst this group of patients. They ranged from mild glaucomatous field losses to severe using the Hoddap-Anderson criteria.Citation19 Most of the patients (13/20) had asymmetrical glaucomatous field changes between eyes, the remainder (7/20) had mild to moderate symmetrical field changes. Only 3/36 eyes exhibited advanced glaucomatous changes with symmetrical severe visual field loss across midline in both hemifields, the remainder (33/36) showed clear differences between the two corresponding hemifields. The intersector/hemi-ring differences between corresponding hemifields were tested for significance. For each hemifield, six sectors and five hemi-rings were compared to their corresponding fellows in the opposite hemifield. shows that all sectors and hemi-rings were statistically significant when compared to their corresponding fellows in the opposite hemifield. The results show that the majority of patients had asymmetrical glaucomatous visual field defects between the two eyes. The mean SNR ± standard deviation values for the glaucoma group were 1.70 ± 0.412, which is a low average response, close to poor (SNR = 1). shows that all pairs of sectors (6/6) and hemi-rings (5/5) showed a statistically significant SNR difference.
Table 4 Comparison between SNR values in superior and inferior hemifield sectors and rings in glaucoma group
Discussion
This study used a novel analysis protocol to detect glaucomatous visual field defects by comparing different sectors and hemi-rings in the superior hemifield to their corresponding fellows in the inferior hemifield. These results confirm that the mfVEP test is able to detect glaucomatous visual field defects accurately. Based on their findings, Hood et alCitation8 and Chen et alCitation20 tried to answer the following questions: can the mfVEP detect damage earlier than standard visual field testing? Will the mfVEP be useful in monitoring progression? They concluded that although these questions are important, they are currently unresolved. No research to date has been carried out on the role of the mfVEP in monitoring glaucomatous progression. Nevertheless, the ability of the mfVEP to detect progression will be limited by its repeatability.Citation8,Citation11,Citation20 Recent evidence suggests that the mfVEP can have a clear role for monitoring and detecting progression of glaucoma, based on good repeatability figures.Citation4–Citation7 The important issue of early detection of glaucoma has yet to be thoroughly explored, although if glaucoma is diagnosed at an early stage and treated early, visual impairment caused by the disease progression may be limited or minimal.
In some patients, the mfVEP will surpass standard visual field testing using the HFA for detecting early damage. In other patients, the reverse will be true. There are many examples where the HFA and mfVEP are not consistent and do not agree in the detection of visual field defects. The mfVEP analysis protocol detected glaucomatous field defects in both glaucoma and glaucoma suspect patients with a good level of sensitivity and specificity. Sensitivity and specificity of the HSA protocol in detecting glaucoma was 97% and 86% respectively, whilst in glaucoma suspects it was 89% and 79% (–). These sensitivity values were similar to other findings for mfVEP perimetry using different analysis protocols. The majority of studies identifying the role of the mfVEP in the detection of glaucomatous visual field defects confirmed its ability to detect existing visual field damage with high sensitivities ranging between 86% and 97.5%. For defects that are not detected by SAP, lower sensitivities are obtained, ranging between 76% and 92%, which is a good detection rate compared to the SAP given its limitations in the early stages of glaucoma.Citation6,Citation7,Citation20,Citation21 Graham et alCitation5 evaluated the role of the mfVEP in clinical practice. They tested 436 patients who were referred for glaucoma assessment, all undergoing mfVEP. They found that the results of the mfVEP correlated well with the stage of the glaucoma and the HFA mean deviation index, with an overall sensitivity for detecting glaucoma with established defects of 97.5%, and 95% for early defects. They reported that 92.2% of low risk suspects yielded a normal mfVEP. They showed evidence that the mfVEP is an effective method for detecting visual field loss in glaucoma. They suggested that the mfVEP test provides a valuable aid to the clinician in categorizing patients with unreliable, variable, unconfirmed, or excessive subjective field loss. They concluded that the mfVEP is an effective method for detecting glaucomatous visual field defects, and that it provides the clinician with useful information about the visual field in the presence of an unreliable SAP test. Goldberg et alCitation9 also reported similar findings when he compared the results of HFA visual field testing with mfVEP carried out on glaucoma patients. Comparing sectors and hemi-rings in each hemifield to their fellows in the opposite hemifield will create an intraeye standardization method by making each sector a local reference to its corresponding one in the opposite hemifield. We believe that this interocular standardization is superior to the two most commonly used analysis protocols: the inter-ocular analysis, where the results are binocular and each eye is compared to the other one in all its segments, and the analysis method, which compares the SNR values to normative values acquired from samples of different, normal populations. Although both eyes are almost identical in their responses under normal circumstancesCitation22 it becomes very difficult to compare the two eyes when both are similarly affected. The protocol described in this study is different in that it overcomes the poor detection problems of binocular analysis and makes the standard reference the sectors coming from within the same eye, which should offer greater precision and accuracy. According to the pathophysiology of glaucoma, early defects usually originate as localized islands in one sector of a single hemifield, gradually progressing over time to form a larger defect in that hemifield, with similar changes beginning in the opposite hemifield. It should be remembered that when the glaucomatous visual field is advanced, both hemifields are equally damaged and this analysis protocol will become less effective at detecting a significant difference between the two hemifields. For this reason, we modified this analysis protocol and added an SNR grading scale for monocular analysis. The ability of the HSA to detect early and subtle visual field changes compared to the standard SAP testing protocols has shown good agreement with previous studies.Citation16,Citation20 shows the components of the hemifield sector analysis protocol parameters, and how sectors and hemi-rings are evaluated. – show examples of patients with suspicious presentation of glaucoma with unconfirmed diagnosis or patients considered as glaucoma suspect. These patients had both mfVEP and HFA SITA 24-2 tests done. The hemifield sector analysis protocol detected focal defects in one hemifield compared the corresponding fellow hemifield, while no significant changes were seen in the Sap results. These SNR depressions could be considered as early glaucomatous visual field changes, and perhaps it will need some close monitoring plan and reassessment on regular basis. However, because these mfVEP focal depressions are not conclusively considered a glaucomatous visual field defects, future longitudinal study is needed to follow those subjects to check on regular interval if they will develop glaucoma or not. As a theoretical framework for judging whether SAP or mfVEP can be more beneficial, Hood et alCitation8 provided a better understanding of the two tests based upon a comparison of matched probability plots between the two tests. They concluded that the majority of the time the mfVEP can detect glaucomatous visual field defects earlier than SAP. However the reverse can also occur, assuming that SAP results are reliable. Their analysis suggested that the two tests will often agree. But regardless of the accuracy of mfVEP results and its ability to detect visual field defects earlier, they predicted that it will not replace SAP tests in the near future. There are significant reasons that limit the use of mfVEP as a primary tool for objective visual field testing. The test time after including preparation is lengthy especially when the two runs are carried out. The equipment is expensive compared to a perimeter and performing the test needs qualified and well trained technical staff who can connect the electrodes accurately and monitor for any intratest errors. As we initially assumed, normal subjects did not show any statistically significant difference between the two hemifields, and this is because all normal responses range almost equally across the entire field, so such large hemifield differences are not expected in normal responses. This confirms that the intersector analysis protocol can identify normal visual field without significant defects. In all the examples reported here, the mfVEP analysis protocol detected significant focal reduction in one hemifield compared to its corresponding fellow in the opposite hemifield. This significant difference, when it is reproducible and repeatable, can give a good indication that there is an ongoing process of field changes that require attention, even in the absence of standard HFA defects, especially in the presence of suspicious risk factors or unreliable HFA results.
Figure 3 Receiver operating characteristic analysis for the glaucoma suspect group by multifocal VEP test in glaucoma suspect group.
Abbreviations: SNR, signal to noise ratio; VEP, visual evoked potential.
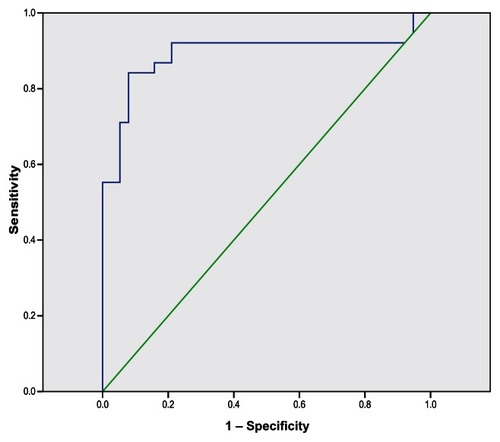
Figure 4 Receiver operating characteristic analysis for the glaucoma group by multifocal VEP test in glaucoma suspect group.
Abbreviations: SNR, signal to noise ratio; VEP, visual evoked potential.
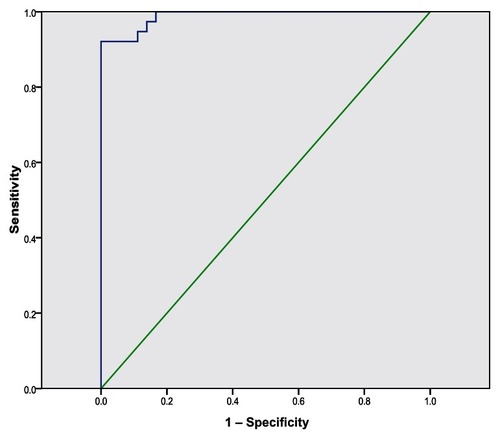
Figure 5 Components of the hemifield sector/hemi-ring analysis printout. Analysis components; color-coded averaged waveforms from the sector or hemi-ring (A), sector/hemi-ring waveform numbers (B), average SNR value for each sector/hemi-ring (C), positive peak amplitude (D), positive peak latency (E), color-coded sectors for comparison (F), color-coded hemi-rings for comparison (G).
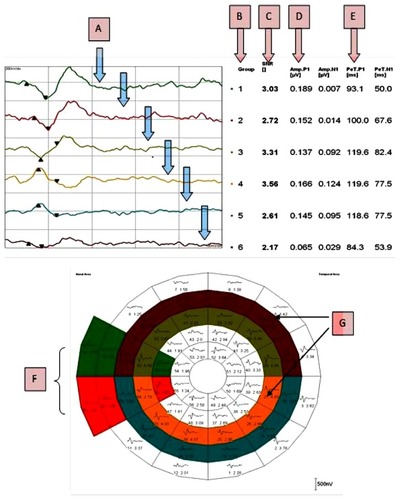
Figure 6 Role of the HSA protocol in identifying early field changes.
Abbreviations: AMP, amplitude; GHT, glaucoma hemifield test; HSA, hemifield sector analysis; IS1, inferior sector number 1; SS1, superior sector number 1; MD, mean deviation; mfVEP, multifocal visual evoked potential; N1, negative peak 1; P1, positive peak 1; PeT, peak time; PSD, pattern standard deviation; SITA, swedish interactive threshold algorithm.
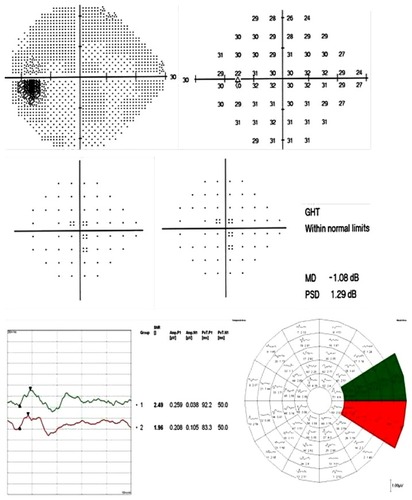
Figure 7 Another example of a possible early detection of a visual field defect using the SITA standard 24-2 test and mfVEP intersector HSA comparison in a glaucoma suspect patient.
Abbreviations: AMP, amplitude; GHT, glaucoma hemifield test; HSA, hemifield sector analysis; IS1, inferior sector number 1; SS1, superior sector number 1; MD, mean deviation; mfVEP, multifocal visual evoked potential; N1, negative peak 1; P1, positive peak 1; PeT, peak time; PSD, pattern standard deviation; SITA, swedish interactive threshold algorithm.
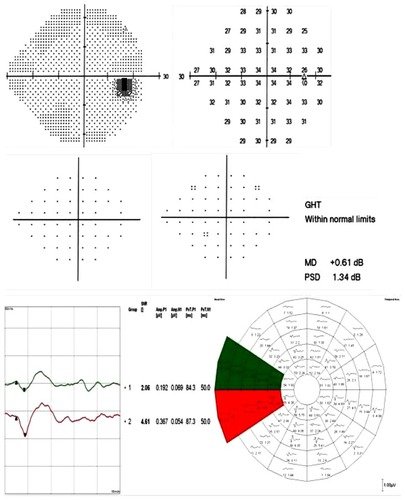
Figure 8 An additional example of a possible early detection of a visual field defect using the SITA standard 24-2 test and mfVEP intersector HSA comparison in a glaucoma suspect patient.
Abbreviations: AMP, amplitude; GHT, glaucoma hemifield test; HSA, hemifield sector analysis; IS1, inferior sector number 1; SS1, superior sector number 1; MD, mean deviation; mfVEP, multifocal visual evoked potential; N1, negative peak 1; P1, positive peak 1; PeT, peak time; PSD, pattern standard deviation; SITA, swedish interactive threshold algorithm.
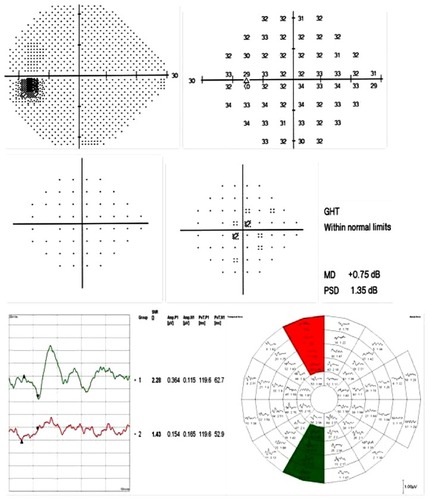
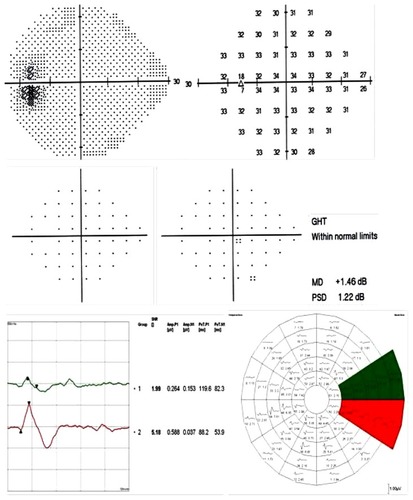
Figure 9 An example of possible early detection of a visual field defect using the SITA standard 24-2 test and the mfVEP hemi-ring comparison analysis in a glaucoma suspect.
Abbreviations: AMP, amplitude; GHT, glaucoma hemifield test; HSA, hemifield sector analysis; IR4, inferior ring number 4; SR4, superior ring number 4; MD, mean deviation; mfVEP, multifocal visual evoked potential; N1, negative peak 1; P1, positive peak 1; PeT, peak time; PSD, pattern standard deviation; SITA, swedish interactive threshold algorithm.
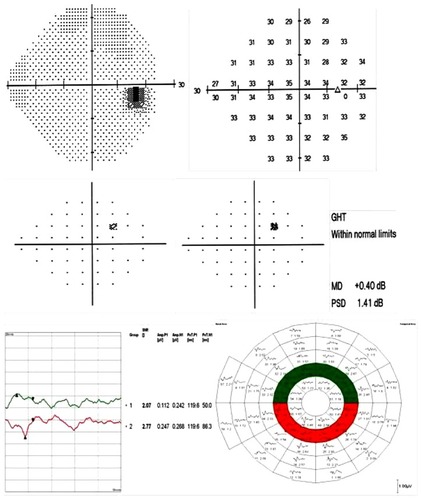
Figure 10 A SITA standard 24-2 test and mfVEP test with HSA printout for a glaucoma patient with a moderate glaucomatous visual field defect.
Abbreviations: AMP, amplitude; GHT, glaucoma hemifield test; HSA, hemifield sector analysis; MD, mean deviation; mfVEP, multifocal visual evoked potential; N1, negative peak 1; P1, positive peak 1; PeT, peak time; PSD, pattern standard deviation; SITA, swedish interactive threshold algorithm; SNR, signal to noise ratio.
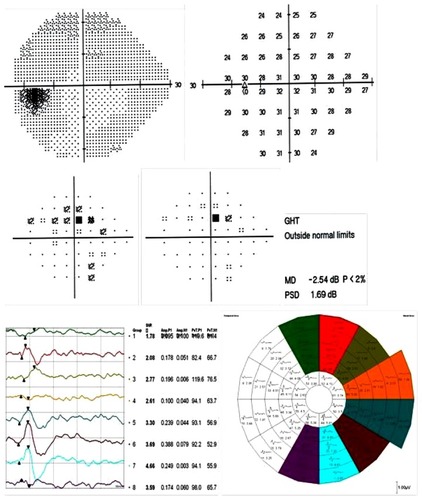
Figure 11 A SITA standard 24-2 test and mfVEP test with HSA printout for a glaucoma suspect patient without any significant field defects.
Abbreviations: AMP, amplitude; G1, grade 1; GHT, glaucoma hemifield test; HSA, hemifield sector analysis; IS1, inferior sector number 1; SS1, superior sector number 1; MD, mean deviation; mfVEP, multifocal visual evoked potential; N1, negative peak 1; P1, positive peak 1; PeT, peak time; PSD, pattern standard deviation; SITA, swedish interactive threshold algorithm.
There are some limitations that make the mfVEP test either unreliable or unsuitable. These limitations could be related to technical (operational) or test-taking errors. The technical part includes limitations that can also be found in standard HFA testing, such as the eyelid occluding part of the field, correction of refractive errors,Citation23 clarity of the ocular media,Citation8,Citation24 and excessive eye movements. The influence of eye movements especially in mfVEP could be a very important confounding factor as it is in the HFA test. Additionally, patient unreliability or level of cooperation is not an uncommon problem in mfVEP testing. The test itself seems very lengthy and inconvenient to some test subjects, even if they are healthy normal subjects. Patient inattentiveness is another problem that can corrupt the VEP waveforms with alpha waves and sleep spindles.Citation25,Citation26 The sectors at the periphery are in some locations over 7° in width, leaving large spaces in the peripheral field as “untested” or at least without a recordable response. In this case it is difficult to establish a diagnosis as a confirmed visual field defect considering only one response from such a large area; two or three adjacent points with individual responses would have been more confirmatory, as proved before in many studies.Citation9,Citation24,Citation25
Conclusion
The mfVEP is an effective objective method for detecting glaucomatous visual field defects. The HSA protocol showed good sensitivity and specificity in detecting early glaucomatous field defects compared to standard HFA testing protocols. The use of the mfVEP analysis protocol can be beneficial in patients with unreliable HFA tests, possessing risk factors for suspicion in the absence of significant defects with perimetry, and as a baseline for all glaucoma suspect patients. Despite its limitations and relatively long test duration, the mfVEP provides very important information pertaining to early glaucomatous visual field changes.
Disclosure
The authors report no conflicts of interest in this work.
References
- Kerrigan-BaumrindLAQuigleyHAPearseMEKerriganDFMitchellRSNumber of ganglion cells in glaucoma eyes compared with threshold visual field tests in the same personsInvest Ophthalmol Vis Sci200041374174810711689
- QuigleyHADunkelbergerGRGreenWRRetinal ganglion cell atrophy correlated with automated perimetry in human eyes with glaucomaAm J Ophthalmol198910754534642712129
- McKendrickAMTurpinACombining perimetric suprathreshold and threshold procedures to reduce measurement variability in areas of visual field lossOptom Vis Sci2005821435115630403
- GrahamSLKlistornerAIGriggJRBillsonFAObjective perimetry in glaucoma: recent advances with multifocal stimuliSurv Ophthalmol199943Suppl 1S199S20910416764
- GrahamSLKlistornerAIGoldbergIClinical application of objective perimetry using multifocal visual evoked potentials in glaucoma practiceArch Ophthalmol2005123672973915955974
- ThienprasiddhiPGreensteinVChuDDetecting early functional damage in glaucoma suspect and ocular hypertensive patients with the multifocal VEP techniqueJ Glaucoma200615432132716865010
- ThienprasiddhiPGreensteinVCChenCSLiebmannJMRitchRHoodDCMultifocal visual evoked potential responses in glaucoma patients with unilateral hemifield defectsAm J Ophthalmol20031361344012834667
- HoodDCGreensteinVCMultifocal VEP and ganglion cell damage: applications and limitations for the study of glaucomaProg Retin Eye Res200322220125112604058
- GoldbergIGrahamSLKlistornerAIMultifocal objective perimetry in the detection of glaucomatous field lossAm J Ophthalmol20021331293911755837
- HoodDCZhangXGreensteinVCKangoviSOdelJGLiebmannJMRitchRAn Interocular Comparison of the Multifocal VEP: A Possible Technique for Detecting Local Damage to the Optic Nerve InvestOphthalmol Vis Sci20004115801587
- MoschosMMGeorgopoulosGChatziralliIPKoutsandreaCMultifocal VEP and OCT findings in patients with primary open angle glaucoma: a cross sectional studyBMC Ophthalmol2012123422856337
- CelesiaGGKaufmanDConeSEffects of age and sex on pattern electroretinograms and visual evoked potentialsElectroencephalogr Clin Neurophysiol19876831611712436875
- one.aao.org [homepage on the Internet]Preferred Practice Pattern Guidelines for Primary Open-Angle Glaucoma; Primary Angle-Closure Glaucoma; Primary Open-Angle Glaucoma SuspectAAO publications2010 Available from: http://one.aao.org/CE/PracticeGuidelines/PPP_Content.aspx?cid=e2387c8a-e51c-4c21-be20-c30fbf4f3260Accessed March 26, 2013
- SpryPGHensonDBSparrowJMNorthRVQuantitative comparison of static perimetric strategies in early glaucoma: test-retest variabilityJ Glaucoma20009324725310877376
- AulhornEHarmsHVisual PerimetryJamesonDHorvichCMHandbook of Sensory PhysiologyBerlinSpringer-Verlag19727
- HarwerthRSCarter-DawsonLSmithEL3rdCrawfordMLScaling the structure – function relationship for clinical perimetryActa Ophthalmol Scand200583444845516029269
- HoodDCBachMBrigellMInternation Society for Clinical Electrophysiology of VisionISCEV Standard for clinical multifocal electroretinography (mfERG) (2011 edition)Doc Ophthalmol2012124111322038576
- BaselerHASutterEEKleinSACarneyTThe topography of visual evoked response properties across the visual fieldElectroencephalogr Clin Neurophysiol199490165817509275
- HodappEParrishRKAndersonDClinical decisions in glaucomaSt LouisMosby-Year Book, Inc19935261
- ChenCHoodDCZhangXRepeat reliability of the multifocal visual evoked potential in normal and glaucomatous eyesJ Glaucoma200312539940814520148
- MansbergerSLSamplePAZangwillLWeinrebRNAchromatic and short-wavelength automated perimetry in patients with glaucomatous large cupsArch Ophthalmol1999117111473147710565515
- HoodDCZhangXWinnBJDetecting glaucomatous damage with the multifocal visual evoked potentials: how can a monocular test work?J Glaucoma200312131512567104
- GrahamSLKlistornerAIGriggJRBillsonFAObjective VEP perimetry in glaucoma: asymmetry analysis to identify early deficitsJ Glaucoma200091101910708226
- HoodDCZhangXMultifocal ERG and VEP responses and visual fields: comparing disease-related changesDoc Ophthalmol20001002–311513711142742
- WuLLSuzukiYKunimatsuSAraieMIwaseATomitaGFrequency doubling technology and confocal scanning ophthalmoscopic optic disc analysis in open-angle glaucoma with hemifield defectsJ Glaucoma200110425626011558807
- HoodDCOdelJGWinnBJThe multifocal visual evoked potentialJ Neuroophthalmol200323427928914663311