
Abstract
The early detection of glaucoma is important in order to enable appropriate monitoring and treatment, and to minimize the risk of irreversible visual field loss. Although advances in ocular imaging offer the potential for earlier diagnosis, the best method is likely to involve a combination of information from structural and functional tests. Recent studies have shown it is possible to estimate the number of retinal ganglion cells from optical coherence tomography and standard automated perimetry, and to then pool the results to produce a combined structure–function index (CSFI). The CSFI represents the estimated percentage of retinal ganglion cells lost compared to an age-matched healthy eye. Previous studies have suggested that the CSFI is better able to detect glaucoma than isolated measures of structure and function, and that it performs well even in preperimetric glaucoma. The purpose of this review is to describe new strategies, such as the CSFI, that have the potential to improve the early detection of glaucoma. We also describe how our ability to detect early glaucoma may be further enhanced by incorporating demographic risk factors, clinical examination findings, and imaging and functional test results into intuitive models that provide estimates of disease probability.
Introduction
Glaucoma is a leading cause of vision-related morbidity worldwide.Citation1–Citation3 It is estimated that over 58 million people will have open-angle glaucoma by the year 2020, with 10% bilaterally blind.Citation4 Although blindness is the most feared outcome, there is growing evidence that even mild visual field loss may have an adverse effect on quality of life.Citation5 Furthermore, greater than 10% of patients with glaucoma diagnosed with early visual field damage and followed up and treated will still develop significant visual impairment or blindness during their lifetime.Citation6 As the damage from glaucoma is irreversible, it is important that the disease is detected at an early stage, before significant field loss has developed, so that the risk of visual impairment and related morbidity can be minimized.
The diagnosis of glaucoma depends on recognition of characteristic structural changes to the optic nerve head (ONH) and retinal nerve-fiber layer (RNFL). Psychophysical tests, the gold standard of which is standard automated perimetry (SAP), should also be used to detect abnormalities of visual function indicative of glaucoma. The Ocular Hypertension Treatment Study,Citation7 European Glaucoma Prevention Study,Citation8 and other studiesCitation9–Citation11 have demonstrated that there may be disagreement between structural and functional tests. Although a substantial proportion of patients who develop glaucoma acquire structural before detectable functional changes, both structural and functional assessments are necessary, as in some patients functional abnormalities are detected before structural.Citation7,Citation8 The demographic and clinical characteristics associated with glaucoma are well known, and in cases of moderate-to-advanced glaucoma, the diagnosis is usually straightforward. A major challenge, however, is how best to detect early glaucoma.
Over the last 25 years, ancillary tests have been introduced that can supplement the clinical examination and aid the clinician in determining the probability of disease. For example, such methods as optical coherence tomography (OCT), scanning laser polarimetry, and confocal scanning laser ophthalmoscopy (CSLO) can be used to provide objective and quantitative measurements of such parameters as RNFL thickness or neuroretinal rim area. Imaging devices also often include normative databases that allow eyes to be categorized as normal, borderline, or outside normal limits. Although imaging devices have shown good ability to distinguish between glaucomatous and healthy eyes,Citation12–Citation21 few studies have specifically examined their application in early disease.Citation22,Citation23 Categorization of disease probability by imaging devices also has limitations, and does not take account of information from visual function tests, which may substantially alter the likelihood of glaucoma.
The purpose of this review is to describe new strategies, such as a combined index of structure and function, which have the potential to improve the early detection and diagnosis of glaucoma.
Detection of glaucoma using functional tests
Standard automated perimetry
The assessment of visual function is an essential component of glaucoma diagnosis and monitoring, with the current gold-standard SAP. Glaucoma may first be detected due to a visual field abnormality; however, many patients have significant structural changes before detectable changes in SAP. Furthermore, histological studies in humans and primates have indicated that large numbers of retinal ganglion cells (RGCs) may be lost before statistically significant abnormalities are apparent on SAP.Citation24–Citation27 For example, in a study of cadaver eyes, Kerrigan-Baumrind et al estimated that at least 23%–35% of RGCs would need to be lost for a statistically significant abnormality on SAP.Citation24 These studies suggest that reliance on SAP in early glaucoma is likely to lead to underestimation of the amount of glaucomatous damage.
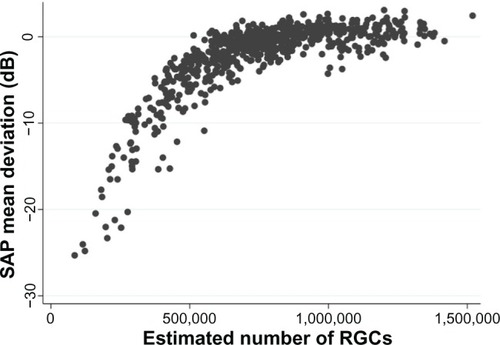
The histological studies have limitations,Citation28 particularly as they include relatively small numbers of eyes; however, the finding that in some eyes significant RGC losses may occur before detectable SAP defects is consistent with what one would expect, given that SAP data are acquired and presented using a logarithmic decibel scale.Citation28–Citation31 Several investigators have shown that it is important to take into account the logarithmic units of measurement of SAP and linear units of measurement of structural tests when comparing the relationship between structural and functional measurements in glaucoma.Citation26,Citation29,Citation32,Citation33 The logarithmic scale compresses the range of losses in the early stages of disease while expanding the range in later stages ().
Figure 1 Scatter plot showing the relationship between standard automated perimetry (SAP) mean deviation and estimated number of retinal ganglion cells (RGCs).
Most diagnostic tests perform less well in early compared to advanced disease; however, the logarithmic scale of SAP accentuates this problem.Citation34,Citation35 Due to the logarithmic scale, significant neural losses are likely to correspond to relatively small changes in SAP sensitivity at early stages of disease compared to relatively large changes in later disease.Citation31 Furthermore, because SAP data are also acquired using staircase procedures based on a logarithmic scale, even when SAP sensitivities are transformed to a linear scale, current SAP strategies are unlikely to perform well in early disease. Medeiros et al found disease severity had a significant effect on the diagnostic ability of SAP pattern standard deviation (PSD), which for a specificity of 80%, had a sensitivity of 85% in eyes with 70% loss of neuroretinal rim area compared to a sensitivity of only 40% in eyes with 10% loss of neuroretinal rim area.Citation34 Therefore, if SAP PSD was used alone to detect early glaucoma (eg, eyes with 10% neuroretinal rim loss), we would expect only 40% of glaucomatous subjects to be correctly identified and a relatively large number of false positives (20%).
Other perimetric devices
Other functional tests have been developed with the aim of detecting glaucomatous visual field changes at an earlier stage.Citation36,Citation37 For example, frequency-doubling technology (FDT), short-wavelength automated perimetry (SWAP), and flicker-defined form (FDF) perimetry are tests that aim to target specific aspects of visual function, such as movement perception, contrast sensitivity, and color vision.Citation38–Citation42 Although it is unlikely any stimulus can be 100% specific for a single visual pathway or a single subset of RGCs, it is possible that stimuli minimize potential input from other pathways. Selective stimuli could be useful for detecting an early deficit affecting a small proportion of cells, because even if other cell types are still functioning in a given retinal area, they are unable to detect that specific stimulus.
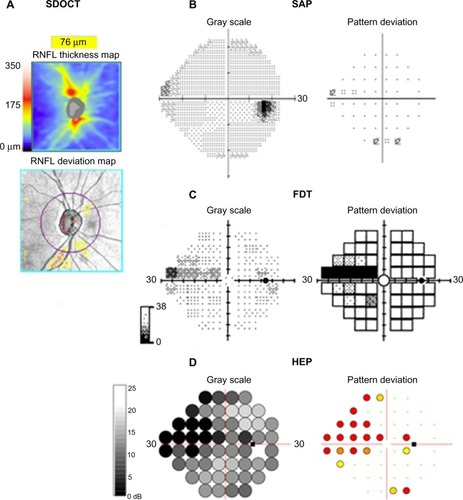
FDT perimetry, FDF perimetry, and SWAP have been described in detail elsewhere.Citation38,Citation42,Citation43 In brief, FDT perimetry determines the minimum contrast needed to detect a rapidly reversing contrast grating stimulus. The frequency-doubling illusion phenomenon was thought to be mediated by a subset of magnocellular RGCs;Citation38 however, recent research has suggested the response is cortical.Citation44 FDF perimetry, eg, the Heidelberg edge perimeter, employs a phase reversal of black and white dots to create a high-temporal-frequency flicker stimulus, which is also thought to preferentially target the magnocellular pathway.Citation42 SWAP uses a narrow-band blue-light stimulus and yellow-background illumination to emphasize the response characteristics of the blue–yellow pathway.Citation43 shows the results of SAP, FDT, and FDF perimetry for a subject with glaucoma.
Figure 2 (A–D) Perimetric test results using three devices for the right eye of a subject with glaucoma. Spectral domain optical coherence tomography (SDOCT) shows inferior retinal nerve fiber layer thinning (A). Standard automated perimetry (SAP) shows a possible early superonasal defect (B), which is confirmed on frequency-doubling technology (FDT) perimetry (C) and with the flicker-defined form Heidelberg edge perimeter (HEP) (D).
Studies comparing the diagnostic ability of different perimetric tests have reported variable results.Citation34,Citation35,Citation41,Citation45 Tafreshi et al compared SAP, matrix FDT perimetry and Swedish interactive thresholding algorithm SWAP but found no significant difference in their diagnostic performance.Citation45 In contrast, Liu et al found SAP and matrix FDT perimetry to be superior, with sensitivities of 82%, 57%, and 84% for SAP, SWAP, and matrix FDT perimetry mean deviation (MD), respectively for a specificity of 90%.Citation35 Medeiros et al examined the effect of disease severity on the diagnostic performance of matrix FDT perimetry and SAP and found FDT may have better accuracy in early disease.Citation34 Areas under the receiver operating-characteristic curves (AUCs) were significantly larger for FDT than SAP in early disease with AUCs of 0.766 and 0.638 for FDT and SAP respectively in eyes with 10% neuroretinal rim area loss.Citation34 The performance of both tests improved with increasing disease severity, with no significant difference between tests in eyes with greater than 30% loss of neuroretinal rim area. Although in this study, matrix FDT performed better than SAP in early disease, even FDT had a sensitivity of only 58% for 80% specificity, meaning many cases of early glaucoma would likely be missed if FDT was used alone.
Novel perimetric tests may improve our ability to detect early glaucoma; however, at present there is not strong evidence to support the widespread use of these devices in place of SAP. A recent study comparing FDF perimetry to matrix FDT and SAP reported it to be a more sensitive test with stronger correlation with structural measurements; however, FDF perimetry is a relatively new technology, and further investigation is required.Citation46–Citation48
Detection of glaucoma using structural tests
Although functional changes may be detected before structural changes, in many cases the earliest detectable manifestation of glaucoma is a structural abnormality of the ONH and RNFL.Citation7,Citation8 Structural changes are traditionally assessed by clinical examination and optic disc stereophotographs.Citation9 However, diagnostic difficulties may occur, due to the large variations in normal disc appearance. Furthermore, although optic disc stereophotographs are useful, their interpretation is subjective, and the interobserver agreement in assessing progressive changes is only slight to fair.Citation49 Such imaging devices as scanning laser polarimetry, CSLO, and OCT provide an objective means to quantify structural characteristics of the ONH and RNFL, and thereby potentially offer an opportunity to detect glaucoma at an earlier stage.Citation50–Citation52 RNFL thickness and ONH measurements can also be compared to normative databases to determine the probability of disease () and estimate the risk of future visual loss.Citation12,Citation14,Citation53–Citation55
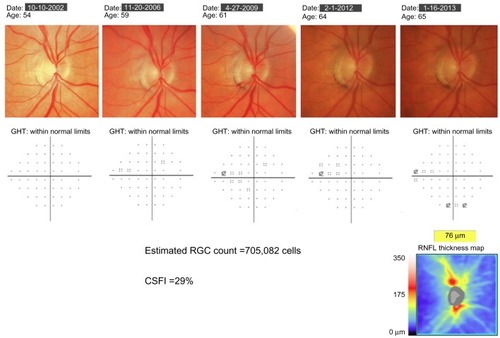
Figure 3 Example of a patient with progressive glaucomatous changes on optic disc photographs. Throughout follow-up, standard automated perimetry indices, including the glaucoma hemifield test (GHT) and mean deviation, remained within normal limits. At the most recent visit, spectral domain optical coherence tomography showed evidence of inferior retinal nerve fiber-layer loss. The estimated retinal ganglion cell (RGC) count at the most recent follow-up was 705,082 cells, and the combined structure–function index (CSFI) was 29%, indicating the eye had lost 29% of RGCs compared to that expected in a healthy age-matched eye.
Baseline measurements
Many studies have shown cross-sectional measurements from imaging devices to perform well at discriminating healthy individuals from those with glaucoma.Citation12–Citation21,Citation56 Deleón-Ortega et al found that average RNFL thickness measured using time-domain OCT (TDOCT) had a 70% sensitivity for 80% specificity compared to sensitivities of 76% and 68% for the best individual Heidelberg retina tomograph II (Heidelberg Engineering, Heidelberg, Germany) and scanning laser polarimetry with variable corneal compensation parameters, respectively.Citation56 The introduction of spectral domain OCT (SDOCT) has potentially improved our ability to detect early disease. Compared to TDOCT, SDOCT provides reduced scan-acquisition times, greatly enhanced resolution, and improved layer segmentation. Leung et al found RNFL measurements obtained using SDOCT had excellent ability to detect glaucoma, with global RNFL thickness having a sensitivity of 91.6% for a specificity of 87.6%, and an AUC of 0.962.Citation21
Although imaging devices have good ability to detect glaucoma, diagnostic performance is less in early disease. Leite et al recently reported that for a specificity of 85%, average RNFL thickness measured using OCT had an estimated sensitivity of approximately 82% in eyes with early disease (defined as SAP visual field index of 90%), which was significantly less than a sensitivity of 93% in those with advanced disease (defined as SAP visual field index of 70%).Citation22 If visual field loss is present, one might argue that the diagnosis of glaucoma is straightforward.
Recently Lisboa et al evaluated the ability of SDOCT to detect preperimetric glaucoma.Citation23 The study examined 134 eyes of 88 subjects suspected of having glaucoma due to optic disc appearance. The suspicion of glaucoma was based on the presence of neuroretinal rim thinning, excavation, or suspicious RNFL defects on stereophotographs evaluated by at least two independent masked graders. Eyes were deemed to have developed preperimetric glaucoma if there was documented evidence of progression on subsequent optic disc stereophotographs but no repeatable visual field defect during at least 5 years of follow-up. RNFL thickness measurements were obtained using Spectralis® SDOCT (Heidelberg Engineering). The study found that SDOCT was able to discriminate eyes with preperimetric glaucoma from those with suspected glaucoma, with an AUC of 0.86 for global RNFL thickness. Subjects were also tested using CSLO; however, the best-performing CSLO parameter – global rim area – had an AUC of only 0.72, which was significantly less than SDOCT RNFL thickness.Citation23 These results indicate that SDOCT is a useful tool for the detection of early glaucoma; however, disease severity is still an important factor influencing the performance of the test. Furthermore, some eyes may still develop perimetric defects before structural changes are apparent, and therefore structural and functional testing remains important.
Longitudinal measurements
The studies discussed thus far evaluated the ability of baseline or cross-sectional measurements to detect glaucoma. However, due to the wide variability of optic nerve appearance, a single cross-sectional structural observation may not be diagnostic in the early stages of disease.Citation57 In clinical practice, early diagnosis of glaucoma may depend on repeating examinations over time and observing for change. This is particularly important as there is growing evidence that progressive structural change is a better prognostic marker than isolated baseline measures, with better correlation with functional outcomes.Citation9,Citation58 For example, in patients with suspected glaucoma, baseline optic disc appearance on stereophotographs has been shown to be predictive of the development of a future visual field defect.Citation9 However, the relationship between the development of visual field defects and baseline appearance was weak compared to change in the nerve over time.Citation9 Patients with progressive optic disc changes were found to be almost 26 times more likely to develop a visual field defect compared to those in whom no change in disk appearance was detected.
Longitudinal changes in neuroretinal rim area, measured using CSLO, are also predictive of future development of visual field loss in those with suspected glaucoma.Citation54,Citation58 Medeiros et al performed repeated CSLO examinations on glaucoma suspects for an average of over 6 years.Citation58 The mean rate of rim-area change in eyes that developed visual field loss was almost four times greater than in those that did not. Each 0.01 mm2/year faster rate of rim-area loss was associated with an almost threefold-higher risk of developing visual field loss. The analysis also took account of potentially confounding variables, such as intraocular pressure and corneal thickness.
Although SDOCT is a relatively new technology, studies are emerging showing that SDOCT RNFL loss over time can also be used to predict the risk of future development of visual field loss in eyes with suspected glaucoma.Citation59 For example, Miki et al followed subjects with suspected glaucoma and normal visual fields at baseline for a median of just over 2 years.Citation59 Eyes that developed confirmed visual field damage during follow-up were found to have had significantly faster rates of decline in average SDOCT RNFL thickness, with a rate of RNFL loss in some sectors three times faster in those that developed visual field defects than in those that did not.
This and other studiesCitation11 demonstrate that in cases of diagnostic uncertainty, detecting and measuring rates of structural change can help confirm an early diagnosis of glaucoma. Moreover, in those with suspected glaucoma, rates of structural change can help predict eyes at high risk of visual loss. There is therefore growing evidence that imaging devices are able to provide additional information to clinical examination and visual field testing. However, it is likely that a combination of structural and functional measures may provide better diagnostic ability than any isolated test. At present, clinicians already use a combined structure–function approach as they intuitively combine information from structural and functional tests to decide the likelihood of disease. However, the current approach is problematic, as it is subjective and made difficult by the different measurement scales of SAP and imaging devices. Recently, new strategies to combine data from structure and function have been described that may provide more consistent methods for better detection of early glaucoma.
Estimating the number of retinal ganglion cells
The underlying pathological feature of glaucomatous optic neuropathy is loss of RGCsCitation1; therefore, were it possible to directly measure RGC loss, this might offer the best method to detect early glaucomatous damage.Citation60 Although direct quantification of RGCs is not yet possible in vivo, Harwerth et al have described empirical formulas that allow RGC counts to be estimated from perimetric threshold-sensitivity values.Citation60 The formulas were derived from studies of laser-induced experimental glaucoma in nonhuman primates. The authors first developed an empirical model relating SAP sensitivity measurements to histological RGC counts as a function of retinal eccentricities, and the experimental results were then translated to clinical perimetry in humans.Citation60 In a series of accompanying experiments, formulas were also developed that allowed estimation of the number of RGC axons from OCT RNFL thickness measurements.Citation60 The structural model took into account the effect of age on axonal density and the effect of disease severity on the relationship between the neuronal and nonneuronal components of the RNFL.
The ability to estimate RGC counts from OCT and SAP for the first time provides a common and intuitive measure for expressing the results of structural and functional tests. This has the potential to improve our understanding of the relationship between structural and functional tests in glaucoma, with important implications for early detection of disease. For example, shows the nonlinear relationship between SAP MD and estimated RGC counts in healthy and glaucomatous eyes from the Diagnostic Innovations Study at the University of California, San Diego.Citation31 The estimates of RGC count confirm that the same amount of RGC loss can correspond to largely different amounts of MD change depending on the stage of the disease. As previously discussed, due to the logarithmic decibel scale, in early disease, large reductions in RGC count could occur with relatively small change in MD.
Medeiros et al recently examined the relationship between estimated numbers of RGCs and first appearance of SAP defects.Citation61 RGC counts were estimated at the earliest time of visual field defect in 53 eyes of 53 subjects with suspected glaucoma who developed visual field loss during follow-up.Citation61 Although there was large variation in the estimated number of RGCs, on average, eyes with early visual field defects had an estimated RGC count of 652,057 cells versus 910,584 cells in similarly aged healthy eyes. This represented an estimated average RGC loss of 28.4% associated with early visual field defects, which was remarkably similar to that found in histologic studies of human eyes.Citation24 These findings help to explain why progressive optic disc or RNFL changes can frequently be seen before the appearance of statistically significant defects on SAP.Citation7,Citation31 They also provide further evidence of the importance of early detection of glaucoma, for if the presence of glaucoma is not realized until a late stage, only a relatively small amount of further damage is likely to be required for the patient to develop disability from the disease.
The ability to estimate RGC counts from OCT and SAP opens the possibility of combining information from structural and functional tests to improve the reliability and accuracy of estimated neural losses in glaucoma.Citation30 To this end, Medeiros et al have recently reported a method of combining RGC estimates from OCT and SAP, with a weighting that takes into consideration differences in performance of SAP and imaging tests at different stages of the disease.Citation30,Citation31 The weighted RGC estimate has been used to develop a combined structure–function index (CSFI).Citation62
The combined structure–function index
The combined structure–function index (CSFI) is an estimate of the percentage of RGCs lost compared to that expected for an age-matched healthy eye.Citation62 Therefore, an eye with a CSFI of 100% has an estimated RGC count equal to that expected for age, whereas an eye with a CSFI of 50% has an estimated RGC count half that expected for age.Citation62 The purpose of the CSFI is to merge the results of structural and functional tests into a single index that can be used for diagnosing and staging glaucoma and detecting disease progression. An example of use of the CSFI is illustrated in , which shows a subject with progressive glaucomatous structural change evident on optic disc photographs. Despite structural changes, SAP global indices remained within normal limits. SDOCT performed at the most recent visit confirmed the presence of RNFL layer loss, with an average RNFL thickness of 53 μm. At the most recent visit the estimated number of RGCs for this eye was 705,082 cells and the CSFI was 29%, indicating the eye had lost 29% of RGCs compared to that expected in a healthy age-matched eye. Therefore, although this patient had normal visual fields, the CSFI indicated significant loss of RGCs consistent with OCT and examination findings. As the CSFI also includes information from functional testing, if the patient had developed an abnormality on SAP prior to RNFL loss being detected, the CSFI would also have indicated a reduction in estimated RGCs compared to that expected.
The CSFI has shown promise as a tool for glaucoma diagnosis. In a study of 333 glaucomatous and 165 healthy eyes, the CSFI had an AUC of 0.94 to discriminate glaucomatous from normal eyes.Citation62 This was superior to SDOCT RNFL thickness (AUC =0.92, P=0.008), SAP MD (AUC =0.88, P<0.001), and SAP visual field index (AUC =0.89, P<0.001). The glaucomatous group in this analysis included 38 eyes with preperimetric glaucoma based on documented evidence of progressive optic disc change in stereophotographs. The CSFI had good ability to distinguish healthy eyes from those with preperimetric glaucoma, with an AUC of 0.85. This was superior to SAP visual field index (AUC =0.51, P<0.001) and SAP MD (AUC =0.63, P<0.001) and similar to SDOCT RNFL thickness (AUC =0.88, P=0.32) ().Citation62 Eyes with preperimetric glaucoma were found to have an average RGC loss of 17% compared to age-expected numbers versus average losses of 52% and 75% in eyes with moderate (average MD −8.2 dB) and advanced (average MD −17.4 dB) perimetric damage respectively.Citation62 Although the ability of the CSFI to detect preperimetric glaucoma was similar to SDOCT RNFL thickness, as some patients develop SAP abnormalities before structural changes are detected, the CSFI has advantages over isolated OCT measurements, even in early disease. Indeed, an advantage of the CSFI is that it utilizes the strengths of both structural and functional tests to provide a reliable method for detecting change throughout the spectrum of the disease. The CSFI was a useful index for diagnosis and staging disease severity and was better than isolated structural or functional measures.
Figure 4 Receiver operating-characteristic curve for discriminating preperimetric glaucomatous eyes from healthy eyes for standard automated perimetry visual field index (VFI) (area under the curve [AUC] =0.51), optical coherence tomography average retinal nerve-fiber layer (RNFL) thickness (AUC =0.88) and the combined structure–function index (CSFI; AUC =0.85).
![Figure 4 Receiver operating-characteristic curve for discriminating preperimetric glaucomatous eyes from healthy eyes for standard automated perimetry visual field index (VFI) (area under the curve [AUC] =0.51), optical coherence tomography average retinal nerve-fiber layer (RNFL) thickness (AUC =0.88) and the combined structure–function index (CSFI; AUC =0.85).](/cms/asset/56e20dcf-124b-4358-a03d-15b3ea61e49b/doph_a_44586_f0004_b.jpg)
The baseline CSFI is useful for detecting disease; however, just as longitudinal changes in structural and functional measures provide diagnostic and prognostic information, the ability to estimate longitudinal changes in RGC counts is also of value. In subjects suspected of having glaucoma, the CSFI has recently been shown to be predictive of future development of glaucoma and visual field loss.Citation63 Meira-Freitas et al examined baseline and longitudinal CSFI values in 288 eyes of 288 subjects suspected of having glaucoma but with normal SAP.Citation63 Over a mean follow-up of approximately 4 years, 48 eyes were deemed to have developed glaucoma due to repeatable abnormal visual fields or progressive glaucomatous optic disc changes on masked assessment of stereophotographs. Eyes with lower estimated number of RGCs at baseline, and those with faster rates of change in RGC counts over time, were found to be at greater risk of developing glaucoma.Citation63 The mean (± standard deviation) estimated RGC count at baseline was 848,827±167,928 cells for those that developed glaucoma versus 1,026,569±158,081 cells for those that did not (P<0.001). Corresponding numbers for CSFI were 17.1% ±13.2% and 2.3% ±13.3%, respectively (P<0.001). The mean rate of change in estimated RGC counts was −18,987 cells/year in those that developed glaucoma versus −8,808 cells/year for those that did not (P<0.001). The CSFI had a better predictive ability than conventional measures of RNFL thickness, SAP MD, or SAP PSD.
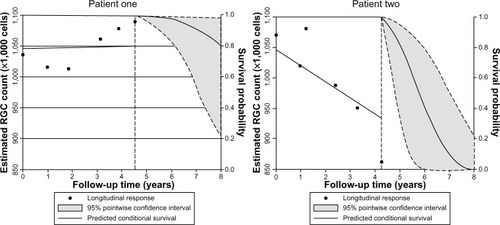
In addition, the authors presented a risk model for the development of glaucoma that can be updated, as information on predictive factors is made continuously available over time, ie, a longitudinal risk calculator.Citation63 shows the predicted survival probabilities of two eyes with suspected glaucoma, one with a relatively fast rate of decline in estimated RGC counts, and another with relatively stable measurements over time. It is apparent that the eye with the faster rate of decline has a much lower predicted probability of survival, ie, a higher probability of developing confirmed glaucoma. Such a model provides a means to assess the risk of glaucoma in those suspected of having the disease, and has the potential to allow monitoring intervals to be tailored to individual risk, leading to earlier diagnosis and treatment.
Figure 5 Example of use of the longitudinal risk calculator in two eyes with suspected glaucoma, as described by Meira-Freitas et al.Citation63 The dashed vertical line represents the time point of last examination, with points to the left of the dashed line indicating estimated retinal ganglion cell (RGC) counts at each visit. The predicted survival probabilities are shown to the right of the dashed vertical line. Patient one has relatively stable measurements over time and a high probability of survival, ie, not developing glaucoma, of 0.8 at 8 years. Patient two has a relatively fast rate of decline in estimated RGCs and a high probability of glaucoma.
Although risk calculators have been previously described for ocular hypertension,Citation64 a major advantage of a longitudinal risk calculator is that the probability of survival can be adjusted as information becomes available at subsequent examinations. Such an approach offers significant advantages over currently available risk calculators, which are designed to estimate the risk of glaucoma development using only baseline information. For example, the predicted survival probability may be relatively high when only baseline measurements are considered. However, as more information becomes available, it may become apparent that there is a decline in estimated numbers of RGCs, resulting in the model lowering the probability of survival. Therefore, the CSFI result can be used to determine the probability of a patient developing glaucoma, and this probability can be modified as further information is obtained.
Estimating the likelihood of disease
The fundamental question of the glaucoma diagnostic process is: What is the probability of disease? The clinician typically formulates an intuitive estimate of disease probability based on medical history and clinical examination findings. This can be referred to as the pretest probability. For example, in a patient with high intraocular pressure, a first-degree relative with glaucoma, and a suspicious optic disc appearance, there is likely to be a high pretest probability of disease. The results of imaging and functional tests can then be used to modify the pretest probability and obtain a new posttest probability of disease.Citation55
At present, many imaging devices perform categorization of test results as normal, borderline, or outside normal limits; however, these classifications do not take account of pretest disease probability. Future software may allow incorporation of risk factors and clinical examination findings into these calculations. Including information regarding risk factors, such as intraocular pressure, central corneal thickness, and the presence or absence of disc hemorrhages, is likely to improve diagnostic accuracy and may allow early disease detection.Citation65 It is also important to incorporate functional measures, such as made possible using estimates of RGC numbers. Categorization of eyes as diseased or healthy may also be problematic as two eyes with similar measurements could fall either side of an arbitrary cutoff when in fact they have similar probability of disease. It has been proposed that the best way of incorporating the results of diagnostic tests into clinical decision making is through calculation of likelihood ratios.Citation66 Likelihood ratios can be used to determine whether a test result significantly changes the probability of disease, with larger likelihood ratios leading to a greater increase in the likelihood of disease.
Estimates of RGC loss calculated from SAP and OCT could be used to calculate the likelihood of disease and modify pretest suspicions, with the potential to lead to earlier diagnosis and identification of those at high risk, while avoiding the problems of arbitrary cutoffs between health and disease. Two recent studies have described the use of continuous likelihood ratios for glaucoma diagnosis, as calculated from RNFL thickness and estimates of RGC count.Citation55,Citation67 Thinner RNFL and low CSFI, which reflects greater RGC loss, were both associated with a higher likelihood of glaucoma, with greater estimated RGC losses leading to larger increases in posttest probability of disease. Further studies are needed to explore the impact of likelihood ratios on decision making in glaucoma; however, they have the potential to aid early diagnosis.
Potential limitations of the CSFI
The CSFI has the potential to improve our ability to detect glaucoma at an early stage; however, some limitations are worth noting. The estimates of RGC count used in the CSFI are derived from experimental work in monkeys.Citation60 Although estimates obtained from these formulas have been validated in multiple external cohorts, including human data, no studies have compared actual CSFI estimates with histological estimates of human glaucomatous eyes. However, there is also little-to-no histological validation of OCT measurements such as RNFL thickness, and it can be argued that this carries little significance as long as one shows that these measurements have clinical relevance.
Another potential limitation of the CSFI is that the original formula for estimating RGCs from OCT data was based on an older version of OCT technology – TDOCT. It is possible that modifications might be necessary when using estimates based on SDOCT technology. It is also possible that the presence of media opacities could affect SAP-derived estimates of RGCs and therefore calculations of the CSFI; however, this is a limitation of most visual field-based staging systems. In fact, by combining functional and structural measurements, the CSFI may reduce the effect of media opacities by relatively decreasing the influence of SAP-derived data on the final estimates of neuronal losses.
Other approaches have been suggested to combine structural and functional tests to detect glaucoma and glaucoma progression, including the use of Bayesian methodologies to allow combinations of different tests.Citation68,Citation69 These approaches are effective in combining results of different tests, and have the advantage of being capable of incorporating other information, such as demographic and clinical risk factors, to increase the accuracy and precision. However, Bayesian analyses have the disadvantage of not being intuitive for the majority of clinicians.
Conclusion
In conclusion, there is growing evidence that early detection of glaucoma is important, particularly as quality of life may be adversely affected with even mild loss of the visual field. Both structural and functional tests are necessary for early diagnosis, and recent technological advances have enhanced our ability to assess both domains. A major challenge is how best to integrate information from structural and functional tests. The CSFI offers a possible solution to this problem, and there is emerging evidence that the CSFI is better able to detect glaucoma than isolated measures of structure and function. Our ability to detect early glaucoma may be further enhanced by incorporating demographic risk factors and clinical examination findings into models that provide estimates of disease probability. In the future, it is likely that longitudinal risk-assessment tools will be an integral part of glaucoma management.
Disclosure
Drs Weinreb and Medeiros receive research support from Carl Zeiss Meditec; Drs Tatham, Weinreb, and Medeiros receive research support from Heidelberg Engineering; Dr Weinreb receives resource support from Optovue, Kowa, Nidek, and Topcon; and Drs Weinreb and Medeiros are consultants to Carl Zeiss Meditec. Dr Weinreb is a consultant to Topcon. The authors have no other conflicts of interest in this work.
References
- WeinrebRNKhawPTPrimary open-angle glaucomaLancet20043631711172015158634
- SpaethGWaltJKeenerJEvaluation of quality of life for patients with glaucomaAm J Ophthalmol2006141314
- ResnikoffSPascoliniDEtya’aleDGlobal data on visual impairment in the year 2002Bull World Health Organ20048284485115640920
- QuigleyHABromanATThe number of people with glaucoma worldwide in 2010 and 2020Br J Ophthalmol20069026226716488940
- McKean-CowdinRVarmaRWuJHaysRDAzenSPSeverity of visual field loss and health-related quality of lifeAm J Ophthalmol20071431013102317399676
- ReinDBWittenbornJSLeePPThe cost-effectiveness of routine office-based identification and subsequent medical treatment of primary open-angle glaucoma in the United StatesOphthalmology200911682383219285730
- KassMAHeuerDKHigginbothamEJThe Ocular Hypertension Treatment Study: a randomized trial determines that topical ocular hypotensive medication delays or prevents the onset of primary open-angle glaucomaArch Ophthalmol200212070171312049574
- MigliorSZeyenTPfeifferNCunha-VazJTorriVAdamsonsIResults of the European Glaucoma Prevention StudyOphthalmology200511236637515745761
- MedeirosFAAlencarLMZangwillLMBowdCSamplePAWeinrebRNPrediction of functional loss in glaucoma from progressive optic disc damageArch Ophthalmol20091271250125619822839
- StrouthidisNGScottAPeterNMGarway-HeathDFOptic disc and visual field progression in ocular hypertensive subjects: detection rates, specificity, and agreementInvest Ophthalmol Vis Sci2006472904291016799032
- ArtesPHChauhanBCLongitudinal changes in the visual field and optic disc in glaucomaProg Retin Eye Res20052433335415708832
- ZangwillLMBowdCBerryCCDiscriminating between normal and glaucomatous eyes using the Heidelberg retina tomograph, GDx nerve fiber analyzer, and optical coherence tomographArch Ophthalmol200111998599311448320
- GreaneyMJHoffmanDCGarway-HeathDFNaklaMColemanALCaprioliJComparison of optic nerve imaging methods to distinguish normal eyes from those with glaucomaInvest Ophthalmol Vis Sci20024314014511773024
- MedeirosFAZangwillLMBowdCWeinrebRNComparison of the GDx VCC scanning laser polarimeter, HRT II confocal scanning laser ophthalmoscope, and stratus OCT optical coherence tomograph for the detection of glaucomaArch Ophthalmol200412282783715197057
- NaithaniPSihotaRSonyPEvaluation of optical coherence tomography and Heidelberg retinal tomography parameters in detecting early and moderate glaucomaInvest Ophthalmol Vis Sci2007483138314517591883
- MedeirosFAZangwillLMBowdCVessaniRMSusannaRJrWeinrebRNEvaluation of retinal nerve fiber layer, optic nerve head, and macular thickness measurements for glaucoma detection using optical coherence tomographyAm J Ophthalmol2005139445515652827
- ChangRTKnightOJFeuerWJBudenzDLSensitivity and specificity of time-domain versus spectral-domain optical coherence tomography in diagnosing early to moderate glaucomaOphthalmology20091162294229919800694
- LeiteMTRaoHLZangwillLMWeinrebRNMedeirosFAComparison of the diagnostic accuracies of the Spectralis, Cirrus, and RTVue optical coherence tomography devices in glaucomaOphthalmology20111181334133921377735
- MedeirosFAVizzeriGZangwillLMAlencarLMSamplePAWeinrebRNComparison of retinal nerve fiber layer and optic disc imaging for diagnosing glaucoma in patients suspected of having the diseaseOphthalmology20081151340134618207246
- LeungCKYeCWeinrebRNRetinal nerve fiber layer imaging with spectral-domain optical coherence tomography: a study on diagnostic agreement with Heidelberg retinal tomographOphthalmology201011726727419969364
- LeungCKCheungCYWeinrebRNRetinal nerve fiber layer imaging with spectral-domain optical coherence tomography: a variability and diagnostic performance studyOphthalmology20091161257126319464061
- LeiteMTZangwillLMWeinrebRNEffect of disease severity on the performance of Cirrus spectral-domain OCT for glaucoma diagnosisInvest Ophthalmol Vis Sci2010514104410920335619
- LisboaRLeiteMTZangwillLMTafreshiAWeinrebRNMedeirosFADiagnosing preperimetric glaucoma with spectral domain optical coherence tomographyOphthalmology20121192261226922883689
- Kerrigan-BaumrindLAQuigleyHAPeaseMEKerriganDFMitchellRSNumber of ganglion cells in glaucoma eyes compared with threshold visual field tests in the same personsInvest Ophthalmol Vis Sci20004174174810711689
- HarwerthRSCarter-DawsonLShenFSmithEL3rdCrawfordMLGanglion cell losses underlying visual field defects from experimental glaucomaInvest Ophthalmol Vis Sci1999402242225010476789
- HarwerthRSCarter-DawsonLSmithEL3rdBarnesGHoltWFCrawfordMLNeural losses correlated with visual losses in clinical perimetryInvest Ophthalmol Vis Sci2004453152316015326134
- QuigleyHADunkelbergerGRGreenWRRetinal ganglion cell atrophy correlated with automated perimetry in human eyes with glaucomaAm J Ophthalmol19891074534642712129
- MalikRSwansonWHGarway-HeathDF‘Structure-function relationship’ in glaucoma: past thinking and current conceptsClin Exp Ophthalmol201240369380
- Garway-HeathDFCaprioliJFitzkeFWHitchingsRAScaling the hill of vision: the physiological relationship between light sensitivity and ganglion cell numbersInvest Ophthalmol Vis Sci2000411774178210845598
- MedeirosFAZangwillLMAndersonDREstimating the rate of retinal ganglion cell loss in glaucomaAm J Ophthalmol201215481482422840484
- MedeirosFAZangwillLMBowdCMansouriKWeinrebRNThe structure and function relationship in glaucoma: implications for detection of progression and measurement of rates of changeInvest Ophthalmol Vis Sci2012536939694622893677
- HoodDCKardonRHA framework for comparing structural and functional measures of glaucomatous damageProg Retin Eye Res20072668871017889587
- SwansonWHFeliusJPanFPerimetric defects and ganglion cell damage: interpreting linear relations using a two-stage neural modelInvest Ophthalmol Vis Sci20044546647214744886
- MedeirosFASamplePAZangwillLMLiebmannJMGirkinCAWeinrebRNA statistical approach to the evaluation of covariate effects on the receiver operating characteristic curves of diagnostic tests in glaucomaInvest Ophthalmol Vis Sci2006472520252716723465
- LiuSLamSWeinrebRNComparison of standard automated perimetry, frequency-doubling technology perimetry, and short-wavelength automated perimetry for detection of glaucomaInvest Ophthalmol Vis Sci2011527325733121810975
- JohnsonCAAdamsAJCassonEJBrandtJDBlue-on-yellow perimetry can predict the development of glaucomatous visual field lossArch Ophthalmol19931116456508489447
- JohnsonCASamuelsSJScreening for glaucomatous visual field loss with frequency-doubling perimetryInvest Ophthalmol Vis Sci1997384134259040475
- JohnsonCAAdamsAJCassonEJBrandtJDProgression of early glaucomatous visual field loss as detected by blue-on-yellow and standard white-on-white automated perimetryArch Ophthalmol19931116516568489448
- LandersJAGoldbergIGrahamSLDetection of early visual field loss in glaucoma using frequency-doubling perimetry and short-wavelength automated perimetryArch Ophthalmol20031211705171014662589
- MedeirosFASamplePAWeinrebRNFrequency doubling technology perimetry abnormalities as predictors of glaucomatous visual field lossAm J Ophthalmol200413786387115126151
- SamplePAMedeirosFARacetteLIdentifying glaucomatous vision loss with visual-function-specific perimetry in the diagnostic innovations in glaucoma studyInvest Ophthalmol Vis Sci2006473381338916877406
- ShabanaNCornilleau PérèsVCarkeetAChewPTMotion perception in glaucoma patients: a reviewSurv Ophthalmol2003489210612559330
- SamplePAWeinrebRNColor perimetry for assessment of primary open-angle glaucomaInvest Ophthalmol Vis Sci199031186918752211033
- WhiteAJSunHSwansonWHLeeBBAn examination of physiological mechanisms underlying the frequency-doubling illusionInvest Ophthalmol Vis Sci2002433590359912407172
- TafreshiASamplePALiebmannJMVisual function-specific perimetry to identify glaucomatous visual loss using three different definitions of visual field abnormalityInvest Ophthalmol Vis Sci2009501234124018978349
- LamparterJRussellRASchulzeASchuffACPfeifferNHoffmannEMStructure-function relationship between FDF, FDT, SAP, and scanning laser ophthalmoscopy in glaucoma patientsInvest Ophthalmol Vis Sci2012537553755923074201
- MarvastiAHTathamAJWeinrebRNMedeirosFAHeidelberg edge perimetry for the detection of early glaucomatous damage: a case reportCase Rep Ophthalmol2013414415024163683
- LeungCKCheungCYWeinrebRNEvaluation of retinal nerve fiber layer progression in glaucoma: a study on optical coherence tomography guided progression analysisInvest Ophthalmol Vis Sci20105121722219684001
- JampelHDFriedmanDQuigleyHAgreement among glaucoma specialists in assessing progressive disc changes from photographs in open-angle glaucoma patientsAm J Ophthalmol20091473944. e118790472
- WollsteinGGarway-HeathDFHitchingsRAIdentification of early glaucoma cases with the scanning laser ophthalmoscopeOphthalmology1998105155715639709774
- WollsteinGGarway-HeathDFFontanaLHitchingsRAIdentifying early glaucomatous changes. Comparison between expert clinical assessment of optic disc photographs and confocal scanning ophthalmoscopyOphthalmology20001072272227711097609
- JaffeGJCaprioliJOptical coherence tomography to detect and manage retinal disease and glaucomaAm J Ophthalmol200413715616914700659
- KamalDSGarway-HeathDFHitchingsRAFitzkeFWUse of sequential Heidelberg retina tomograph images to identify changes at the optic disc in ocular hypertensive patients at risk of developing glaucomaBr J Ophthalmol20008499399810966952
- ChauhanBCNicolelaMTArtesPHIncidence and rates of visual field progression after longitudinally measured optic disc change in glaucomaOphthalmology20091162110211819500850
- LisboaRMansouriKZangwillLMWeinrebRNMedeirosFALikelihood ratios for glaucoma diagnosis using spectral-domain optical coherence tomographyAm J Ophthalmol2013156918926. e223972303
- Deleón-OrtegaJEArthurSNMcGwinGJrXieAMonheitBEGirkinCADiscrimination between glaucomatous and nonglaucomatous eyes using quantitative imaging devices and subjective optic nerve head assessmentInvest Ophthalmol Vis Sci2006473374338016877405
- MedeirosFAZangwillLMBowdCSamplePAWeinrebRNUse of progressive glaucomatous optic disk change as the reference standard for evaluation of diagnostic tests in glaucomaAm J Ophthalmol20051391010101815953430
- MedeirosFALisboaRZangwillLMEvaluation of progressive neuroretinal rim loss as a surrogate end point for development of visual field loss in glaucomaOphthalmology201412110010923948465
- MikiAZangwillLJainSRates of retinal nerve fiber layer thinning in glaucoma suspect eyesARVO2013 abstract number 1706
- HarwerthRSWheatJLFredetteMJAndersonDRLinking structure and function in glaucomaProg Retin Eye Res20102924927120226873
- MedeirosFALisboaRWeinrebRNLiebmannJMGirkinCZangwillLMRetinal ganglion cell count estimates associated with early development of visual field defects in glaucomaOphthalmology201312073674423246120
- MedeirosFALisboaRWeinrebRNGirkinCALiebmannJMZangwillLMA combined index of structure and function for staging glaucomatous damageArch Ophthalmol20121301107111623130365
- Meira-FreitasDLisboaRTathamAPredicting progression in glaucoma suspects with longitudinal estimates of retinal ganglion cell countsInvest Ophthalmol Vis Sci2013544174418323661375
- European Glaucoma Prevention Study GroupGordonMOTorriVValidated prediction model for the development of primary open-angle glaucoma in individuals with ocular hypertensionOphthalmology2007114101917095090
- GordonMOBeiserJABrandtJDThe Ocular Hypertension Treatment Study: baseline factors that predict the onset of primary open-angle glaucomaArch Ophthalmol200212071472012049575
- JaeschkeRGuyattGHSackettDLUsers’ guides to the medical literature. III. How to use an article about a diagnostic test. B. What are the results and will they help me in caring for my patients? The Evidence-Based Medicine Working GroupJAMA19942717037078309035
- KuangTMLisboaRTathamAJContinuous likelihood ratios for glaucoma diagnosis using the combined index of structure and functionARVO2013 abstract number 2295
- MedeirosFALeiteMTZangwillLMWeinrebRNCombining structural and functional measurements to improve detection of glaucoma progression using Bayesian hierarchical modelsInvest Ophthalmol Vis Sci2011525794580321693614
- RussellRAMalikRChauhanBCCrabbDPGarway-HeathDFImproved estimates of visual field progression using Bayesian linear regression to integrate structural information in patients with ocular hypertensionInvest Ophthalmol Vis Sci2012532760276922467579