Video abstract
Point your SmartPhone at the code above. If you have a QR code reader the video abstract will appear. Or use:
Purpose
To compare the safety, efficacy, and predictability of laser in situ keratomileusis treatments at 1 year postprocedure using a novel geometric ray tracing algorithm with outcomes of treatments using wavefront-optimized, wavefront-guided, and topography-guided ablation profiles of an excimer laser (WaveLight GmbH, Erlangen, Germany; Alcon Laboratories, Fort Worth, TX, USA).
Setting
Wellington Eye Clinic, Dublin, Ireland.
Design
Retrospective comparative case series.
Methods
Eyes having a preoperative myopic spherical equivalent refractive error >4.00 D and/or astigmatism between 2.00–6.00 D resulting in a spherical equivalent power greater than −4.00 D received laser in situ keratomileusis treatments using a ray tracing algorithm. Refractive outcomes were analyzed postoperatively at 6 and 12 months and were compared to outcomes of wavefront-optimized, wavefront-guided, and topography-guided treatments in eyes with the same pretreatment refractive range.
Results
Forty-seven eyes of 26 patients were treated using the ray tracing algorithm. At 12 months postprocedure, uncorrected visual acuity was better than the preoperative best-corrected visual acuity in this group. The percentage of eyes achieving an uncorrected visual acuity or best-corrected visual acuity ≥20/20 significantly exceeded the rates achieved in the wavefront-optimized and topography-guided groups. A greater percentage of eyes achieved an uncorrected visual acuity ≥20/20 and ≥20/16 in the wavefront-guided group, but no eyes in the wavefront-guided group had an uncorrected visual acuity ≥20/12.5 in comparison to 9.5% of eyes in the ray tracing group.
Conclusion
This study provides further evidence of the safety, efficacy, and predictability of laser in situ keratomileusis outcomes using an optical ray tracing algorithm to treat moderate to high myopic astigmatism and shows that good results are sustained through 1 year.
Introduction
To improve the outcomes of custom excimer laser ablations for laser in situ keratomileusis (LASIK), an innovative treatment algorithm was developed by Mrochen et al,Citation1 which takes into account all optically significant structures of the eye. Current custom treatments are based on values generated using a single diagnostic technique such as corneal topography or ocular wavefront so that the treatment relies, to some degree, on approximations. The new optical ray tracing algorithm uses data from a beam of light passing through the various refracting media of the eye to focus precisely at the fovea, contributing data to a highly individualized custom ablation profile. The addition of biometry readings, which considers keratometry, central corneal thickness, horizontal corneal diameter, anatomic anterior chamber depth, central lens thickness, retinal thickness, axial length, and pupillometry, provides critical data to the calculation. The 3-month results of a prospective multicenter clinical trial showing good safety, efficacy, and predictability using the optical ray tracing technique were discussed previously.Citation2 This study reports the 1-year results of a retrospective case series and compares the results to outcomes of wavefront-optimized (WFO), wavefront-guided (WFG), and topography-guided (T-CAT) ablation profiles of an excimer laser.
Material and methods
This study is a retrospective review of data collected for a prospective study. The study received Ethics Committee approval and written informed consent was obtained from all patients. All eyes included in this analysis underwent LASIK surgery as an initial refractive procedure. For inclusion in this analysis, patients were 18 years of age or older with a stable refractive error (<0.50 D change in the preceding year). Eyes had preoperative spherical equivalent (SE) myopic refractive errors of >4.00 D and/or with astigmatism between 2.00–6.00 D resulting in an SE power greater than −4.00 D. Best-corrected visual acuity (BCVA) was ≥20/25 Snellen acuity. The uncorrected visual acuity (UCVA) at distance and BCVA were evaluated under photopic conditions with a luminance level of 80–320 candela/m2. Inclusion criteria also included preoperative central corneal thickness readings of ≥480 μ with an estimated postprocedure residual corneal bed of >270 μ. The corneal thickness and predicted stromal bed depth were based on preoperative records and on preprocedure pachymetry readings. Excluded ophthalmic conditions included anterior segment abnormalities or findings that could affect outcomes such as clinically significant dry eyes, forme fruste keratoconus, keratoconus, and eyes with previous surgery; clinically significant abnormalities on topography and tomography; and acute or recurring eye disease such as herpetic keratitis. Patients who had autoimmune or systemic connective tissue disease, atopic syndrome, uncontrolled diabetes mellitus, were taking systemic drugs that could impair wound healing, or were pregnant or breastfeeding were excluded from this analysis.
Preoperative evaluations of patients included UCVA, BCVA, manifest and cycloplegic refractions, scotopic pupil size (Procyon P3000 Binocular Pupillometer, Procyon Instruments, London, United Kingdom), topography (Allegro Topolyzer™; WaveLight GmbH, Erlangen, Germany; Alcon Laboratories, Fort Worth, TX, USA), tomography (Allegro Oculyzer™; WaveLight; Alcon), wavefront (Allegro Analyzer; WaveLight; Alcon), pachymetry (Allegro Oculyzer), and biometry (Allegro OB820 laser biometer; WaveLight; Alcon). Manifest refractions were obtained using plus-to-blur and fogging techniques to confirm the spherical endpoint. A complete anterior segment examination and a dilated fundus examination were performed. On the day of surgery, female patients received a pregnancy test. Postoperatively, UCVA, BCVA, manifest refraction, and corneal topography were evaluated at 1, 3, 6, and 12 months. Biometry and wavefront were performed preoperatively and at 3 months. Effects with P-values <0.05 were regarded as statistically significant.
Ray tracing treatment planning and procedure
The ray tracing-guided ablation profile is a computer-based algorithm which incorporates data derived from several instruments. Four biometry measurements providing data relating to keratometry, corneal thickness, anterior chamber depth, central lens thickness, retina thickness, and axial dimensions in addition to the length were obtained. To complete the planned treatment, four topographical maps including posterior corneal surface readings using Scheimpflug principles and four wavefront maps were performed and validated. The mean values of all three tests were used to develop the ray tracing ablation profile. Additional details regarding preoperative testing were discussed in a prior study.Citation2
Current methods utilize diagnostic data from either the manifest refraction (WFO), the wavefront measurement from the wavefront analyzer, or the topography data from either the Placido disc-based Topolyzer or the Scheimpflug-based Oculyzer. Once the diagnostic data is entered into the excimer laser, the ablation profile is calculated using the Gullstrand model eye as the target eye to be treated. With ray tracing-guided surgery, the patient’s own virtual eye model using their personal data is used to calculate the ablation profile. This is the key difference between ray tracing profiles and all other ablation profiles.
Using this ablation profile, a computer simulated test surgery is performed and the resultant optics are tested again by projecting a geometric ray tracing image onto the virtual model of the patient’s eye. After evaluating the quality of the image on the retina, the ablation profile can be further refined to improve the refractive outcome. This simulation can be repeated multiple times to achieve an optimal ablation profile for each eye.
Flaps in all cases required a diameter >8.5 mm and were created using the Rondo microkeratome (WaveLight; Alcon) or the Hansatome® XP microkeratome (Technolas Perfect Vision GmbH, Munich, Germany). All procedures were performed in the Wellington Eye Clinic, Dublin, Ireland by a single surgeon (ABC) using the Allegretto Wave® Eye-Q 400 Hz excimer laser (WaveLight; Alcon). In all eyes, a 6.5 mm diameter optical zone and a 1.0 mm transition zone were used for the treatment. After importing the shot list into the laser system, optical ray tracing LASIK was performed the same as conventional LASIK surgery. The planned refraction in all cases was a plano prescription.
WFO, WFG, and T-CAT treatments
The WFO treatment (Allegretto Wave) uses a proprietary ablation algorithm, which is designed to minimize and prevent induced spherical aberration by applying additional pulses to the corneal periphery. The WFG treatments were performed using data obtained with a Tscherning aberrometer and the T-CAT treatments used data from either Placido disc (Topolyzer) or Scheimpflug (Oculyzer) technology. A single surgeon (ABC) performed all the procedures. Flaps were created using the Rondo microkeratome or the Hansatome XP microkeratome, and the 400-Hz (Allegretto Wave) laser was used to perform the ablation.
Results
Demographic data for the ray tracing group, WFO, WFG, and T-CAT groups are presented in . All procedures performed were primary LASIK procedures. As this was a retrospective review of a prospective study with 3 months of follow-up, this paper reports on the outcomes of study patients who presented for follow-up at 6 and 12 months.
Table 1 Demographic data
Six-month outcomes
With regards to efficacy, the UCVA results of the ray tracing group at 6 months postprocedure are presented in . , which compares the preoperative BCVA results to the 6 month postoperative UCVA results in the ray tracing group, shows that postoperative UCVA was superior to the preoperative BCVA. The percentage of eyes achieving a UCVA ≥20/20 in the ray tracing group (87.0%) exceeded the rates achieved in the WFO (64.5%) and T-CAT (76.9%) groups but was comparable to the rate achieved in the WFG group (90.9%). In the WFG group, however, 60.6% of eyes had a UCVA ≥20/16 and no eyes had a UCVA ≥20/12.5 in comparison to 73.9% and 30.4% of eyes in the ray tracing group, respectively.
Figure 1 Graph of efficacy data comparing the preoperative best-corrected visual acuity results to the 6-month postoperative uncorrected visual acuity results.
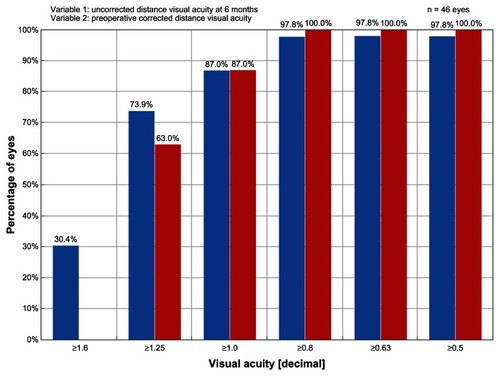
At 6 months postprocedure, BCVA results show that 100% of eyes in the ray tracing group achieved BCVA ≥20/20, 95.7% had BCVA ≥20/16, and 40.4% had BCVA ≥20/12.5. The percentage of eyes achieving a BCVA ≥20/20 in the ray tracing group (100.0%) was equivalent to the rate achieved in the WFG group (100%) but surpassed the rates achieved in the WFO (93.2%) and T-CAT (97.4%) groups. In the WFG group, 87.9% of eyes had a BCVA ≥20/16 and 3% of eyes had a BCVA ≥20/12.5 in comparison to 95.7% and 40.4% of eyes in the ray tracing group, respectively.
Safety outcomes in the ray tracing group (0% lost two lines) exceeded US Food and Drug Administration safety criteria that require a <5% rate for loss of two or more lines of BCVA at 6 months postprocedure. In comparison, 0.9% of eyes treated with the WFO technique had a two-line or more loss of BCVA. While 2.2% of eyes in the ray tracing group lost one line of BCVA at 6 months, 7.8% of eyes treated with the WFO technique, 9.1% of eyes in the WFG group, and 15.4% of eyes in the T-CAT group had a one-line loss. The difference in the change of BCVA lines between the ray tracing group and the other three cohorts was statistically significant at 6 months () and 12 months postprocedure (). In the ray tracing group, BCVA remained unchanged in 24.4% of eyes, 60.0% of eyes gained one line of BCVA, and 13.3% gained two lines of BCVA. shows that 76.7% of eyes in the ray tracing group had postoperative refractive astigmatism ≤0.25 D at 6 months.
Figure 2 Graph showing the magnitude of postoperative refractive astigmatism in the ray tracing group at 6 months posttreatment.
Abbreviation: D, diopter.
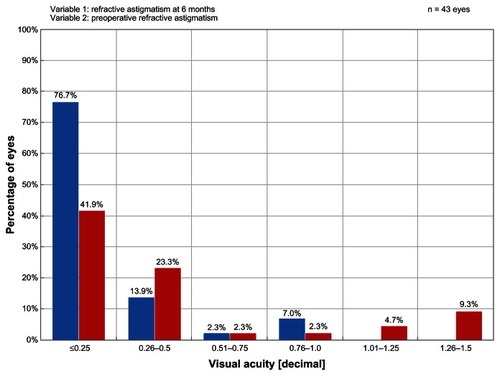
Table 4 Six-month safety outcomes comparing all four groups
Table 5 Twelve-month safety outcomes comparing all four groups
Subgroup analysis at 6 months
A subset analysis of eyes in the ray tracing group having a preoperative SE refractive error in the lower range (−4.00 to −5.00 D) enrolled in the study revealed that these eyes (n = 14) showed superior outcomes compared to eyes in the ray tracing cohort with preoperative SE refractive error greater than −5.00 D (). At 6 months, 100% of eyes in this preoperative −4.00 to −5.00 D subgroup achieved a UCVA ≥20/20, with 92.9% having a UCVA ≥20/16 and 50% having a UCVA ≥20/12.5. All eyes in this subgroup achieved a BCVA ≥20/16 and 57.1% had a BCVA ≥20/12.5 at 6 months. shows that postoperative UCVA was superior to the preoperative BCVA in this subset of eyes. Relating to safety, BCVA was unchanged in 14.3% of eyes and 85.7% of eyes gained one line of BCVA. At 6 months, eyes in this subgroup showed excellent stability and predictability of the postoperative SE refraction with 100% of eyes within ±0.50 D and 86% of eyes within ±0.25 D of the intended refraction. All eyes in this subgroup had postoperative refractive astigmatism ≤0.25 D at 6 months. Mean residual astigmatism calculated by vector analysis was 0.13 ± 0.13 D.
Figure 3 Graph of efficacy data for a subset of eyes in the ray tracing group having preoperative spherical equivalent refractive error in the lower range (−4.00 to −5.00 D) of eyes enrolled in the study.
Abbreviation: D, diopter.
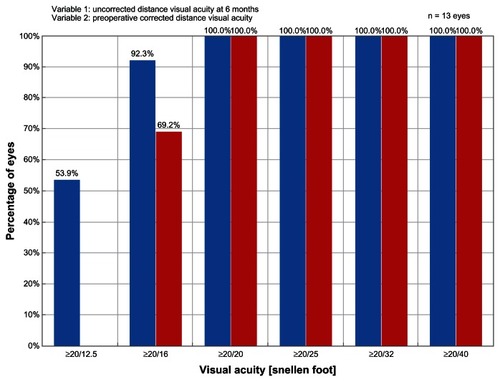
Table 2 Six-month outcomes of ray tracing cohort
Twelve-month outcomes
Twelve-month outcomes of all four groups are presented in . Significant differences between the groups were found in terms of number of lines of BCVA gained or lost (P < 0.0001). Comparing the groups pairwise, ray tracing outperformed WFO in all categories (P < 0.0001, Fisher’s exact test) and did better than WFG and T-CAT in the gaining one line category (P = 0.1011 and P < 0.0001, respectively, Fisher’s exact test). WFG outperformed WFO in the gaining one and gaining more than one line categories (P = 0.059, Fisher’s exact test) and also outperformed T-CAT in all categories (P = 0.014, Fisher’s exact test). There was no difference between WFO and T-CAT. At 12 months postprocedure, again demonstrates that postoperative UCVA was better than the preoperative BCVA in the ray tracing group. The percentage of eyes achieving a UCVA ≥20/20 in the ray tracing group (76.2%) exceeded the rates achieved in the WFO (61.6%) and T-CAT (70.0%) groups. In the WFG group, 92.3% of eyes had a UCVA ≥20/20 and 76.9% had a UCVA ≥20/16; however, no eyes had a UCVA ≥20/12.5 in comparison to 9.5% of eyes in the ray tracing group.
Figure 4 Graph of efficacy data comparing the preoperative best-corrected visual acuity results to the 12-month postoperative uncorrected visual acuity results in the ray tracing group.
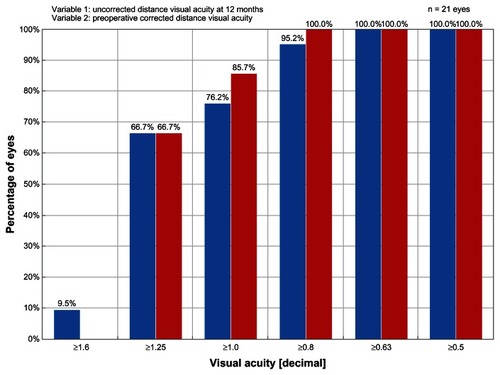
Table 3 Twelve-month outcomes comparing all four groups
At 12 months postprocedure, BCVA results show that 100% of eyes in the ray tracing group retained ≥20/20 vision, a finding that was also observed at 6 months; 90.5% had BCVA ≥20/16; and 19.1% had BCVA ≥20/12.5. The percentage of eyes achieving a BCVA ≥20/20 in the ray tracing group (100.0%) was equivalent to the rate achieved in the WFG group (100%) but surpassed the rates achieved in the WFO (93.2%) and T-CAT (94.7%) groups. In the WFG group, 92.3% had BCVA ≥20/16, but no eyes had BCVA ≥20/12.5 compared to 19.1% of eyes in the ray tracing group.
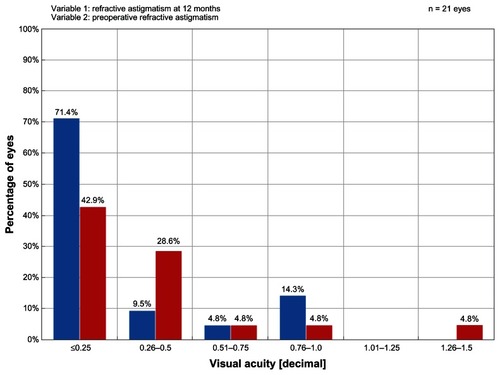
At 12 months postprocedure, excellent safety outcomes in the ray tracing group at 6 months posttreatment were sustained with no eyes losing a line of BCVA. BCVA remained unchanged in 52.4% of eyes, 38.1% gained one line of BCVA, and 9.5% gained two lines of BCVA. In comparison, 0.8% of eyes treated with the WFO technique had a two-line loss and 0.4% had two-line or more loss of BCVA. While 0.0% of eyes in the ray tracing group lost one line of BCVA at 12 months, 7.8% of eyes treated with the WFO technique and 10.5% of eyes in the T-CAT group had a one-line loss. In the WFG group, no eyes lost one or two lines of BCVA, 7.7% gained one line of BCVA, and 15.4% gained two lines in comparison to 38.1% gaining one line and 9.5% gaining two lines in the ray tracing group. compares the ray tracing group with the other three cohorts. Significant differences between the groups were found, but only borderline significance (P = 0.1050). Comparing the groups pairwise, ray tracing outperformed WFO and WFG in the gaining one line category (P = 0.053 and P = 0.096, respectively, Fisher’s exact test) and outperformed T-CAT in all categories (P = 0.012, Fisher’s exact test). There was no difference between WFO and WFG, between WFO and T-CAT, and between WFG and T-CAT. However, sample sizes were small for two of the safety outcome categories in and thus there may be insufficient power to detect sizeable differences between the groups. shows that 71.4% of eyes in the ray tracing group had postoperative refractive astigmatism ≤0.25 D at 12 months. In comparison, 55.1% of eyes in the WFO group, 41.7% of eyes in the WFG group, and 55.6% of eyes in the T-CAT group had postoperative refractive astigmatism ≤0.25 D at 12 months.
Figure 5 Graph showing the magnitude of postoperative refractive astigmatism in the ray tracing group at 12 months posttreatment.
Abbreviation: D, diopter.
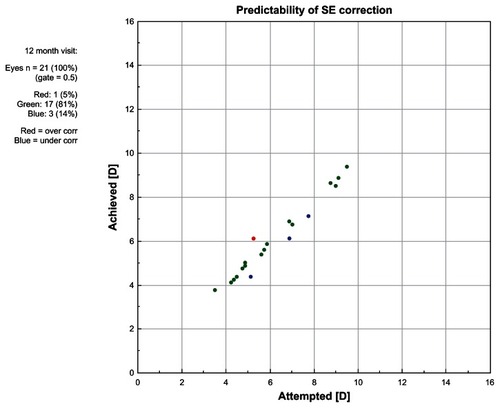
Outcomes analyses at 12 months show good refractive stability () and predictability () in the ray tracing group. Predictability analyses showed that 77% of eyes in the ray tracing group were within ±0.25 D of the target refraction, which was comparable to the percentage achieved in the WFG group (80%), in comparison to 48% of eyes in the WFO group and 61% of eyes in the T-CAT group. Mean residual astigmatism calculated by vector analysis in the ray tracing group (0.32 ± 0.35 D) was similar to findings in the WFO (0.36 ± 0.31), WFG (0.33 ± 0.22), and T-CAT (0.35 ± 0.41) groups.
Figure 6 Graph of spherical equivalent refractive error in the ray tracing group through 12 months of follow-up.
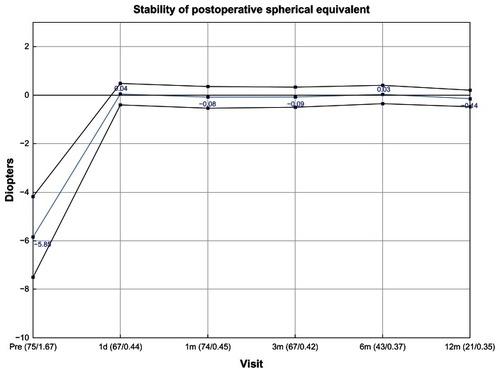
Figure 7 Graph showing the predictability of the spherical equivalent refraction in the ray tracing group at 12 months posttreatment.
Abbreviations: D, diopter; SE, spherical equivalent.
Rate of re-treatments and adverse events in the ray tracing group
In the ray tracing group, complications occurring during the first 3 months of follow-up included one case of moderate dry eyes that had an impact on the refractive outcome. The issue resolved by the 6-month visit. No complications were reported in eyes at 6 and 12 months posttreatment. By 12 months, two eyes had retreatment, both for undercorrection.
Discussion
Greater precision in customized ablation profile planning can only be achieved by taking into account all optical components of the eye. Previous planning methods had inherent limitations. For example, the shape of the lens, the refractive indices and their distribution in the lens, and the retinal radius could not be measured directly and were therefore approximate values extrapolated from the literature. With the introduction of partial coherence reflectometry, intraocular structures and dimensions can now be measured with a high degree of accuracy. Biometry readings are specific for each individual eye and can be measured and corrected to potentially lead to an improvement in visual acuity when compared to treatments that do not take this data into account.
Ray tracing aberrometry directs a beam of light into the eye parallel to the visual axis to obtain data relating to all optical structures of the entire visual system.Citation3 The ray tracing profile considers the exact location of the various ocular interfaces such as the inner corneal surface, the anterior and posterior lens surfaces, and the exact position of the fovea. Using this data, an advanced computer model of each specific eye can be generated to enhance LASIK outcomes. The ray tracing algorithm also takes into consideration, in part, the anticipated biomechanical response of the cornea to the ablation,Citation4,Citation5 for example, the impact of wound-healing.Citation6 The exact nature of this algorithm is proprietary and is derived from the current literature.Citation4–Citation6 Histologic experiments have shown that wound healing is a major cause of refractive instability and intersubject variability outcomes.Citation7 In addition, the loss of intensity of laser pulses due to reflection when ablating at the corneal periphery has also been taken into account in designing the ray tracing algorithm.
This study has demonstrated the safety and efficacy of the ray tracing approach in improving the UCVA and BCVA of subjects. Results for the ray tracing approach at 12 months surpassed outcomes in the WFO and T-CAT groups in the safety and efficacy analyses. Since the four groups have different numbers of eyes the standard error of the average measurement will vary with group. However, certain differences between groups are so large that they are statistically significant even when standard errors are accounted for. The ray tracing study was a prospective study with 3 months follow-up on a relatively small group of patients. The data collected at the 1-year interval was done as a retrospective study. The numbers in the WFG and T-CAT groups are similar at this refractive range (more than −4.00 SE). The only group that is larger is the WFO group, which is the ablation profile most widely utilized at 90%–95% of all procedures performed at the Wellington Eye Clinic. Customized procedures such as WFG and T-CAT are only employed for symptomatic patients (eg, glare, haloes, starburst, and reduced quality of vision).
In the ray tracing group, 9.5% of eyes achieved UCVA ≥20/12.5, 19.1% achieved BCVA ≥20/12.5, and there were no cases of loss of BCVA. This ablation profile was also associated with the highest rate of eyes gaining BCVA as well as the most accurate outcomes for astigmatism correction. Ray tracing was effective in correcting astigmatism with 91% of eyes ≤0.50 D at 6 months and 81% of eyes ≤0.50 D at 12 months. Of interest, eyes in the ray tracing group having preoperative SE refractive errors in the range of −4.00 to −5.00 D showed particularly excellent outcomes. At 6 months, 92.3% of eyes in this subgroup had a UCVA ≥20/16 and 53.9% had a UCVA ≥20/12.5. At the 12 month interval, 100% of these eyes were within ±0.25 D of the intended correction.
This study demonstrates that it is possible to produce an improvement in BCVA using the ray tracing algorithm. Preoperatively, the mean BCVA was 20/17.58 in comparison to 20/14.55 at 6 months and 20/15.33 at 12 months posttreatment. At 6 and 12 months, the mean postoperative UCVA (20/15.9 and 20/17.27) was actually superior to the preoperative BCVA (20/17.58) of subjects. In the treatment of moderate to high myopic astigmatism, ray tracing-guided LASIK also had higher predictability than WFO and T-CAT methods; 83%, 72%, and 76% of eyes were within 0.50 D of target with ray tracing, WFO, and T-CAT, respectively. The WFG group had 100% of eyes within 0.50 D of target but there were only five eyes with data in this group at the 1-year interval.
The 12-month postoperative UCVA and BCVA results of the ray tracing and WFG groups were similar with 100% of eyes achieving a UCVA of 20/20 and 100% of eyes achieving a BCVA of 20/20 at 12 months in both groups. However, in the WFG group, no eyes achieved a UCVA ≥20/12.5 in comparison to 9.5% of eyes in the ray tracing group. Relating to BCVA, no eyes in the WFG group had BCVA ≥20/12.5 in comparison to 19.1% of eyes in the ray tracing group.
Clearly, these results have important implications for improved outcomes in myopic LASIK surgery as well as in the design of individualized ablations algorithms. Analysis of the total eye using both wavefront aberrometry and corneal topography provides the most direct and complete measurement of the whole eye and hence contributes to improving the resultant retinal image quality and visual performance. The combination of all these pieces of information is critical to personalizing ablation algorithms. Data are processed and exported for the performance of ray tracing simulations to compute the final treatment algorithm. The duration of the ray tracing treatment is slightly longer than a WFO treatment for a similar prescription and slightly less corneal tissue is ablated using this technique. In this study it was found that 1 D of myopia treatment at a 6.5 mm optical zone took 2.2 seconds to complete with the ray tracing profile, while it took 2.1 seconds with the WFO profile. Ablation depth was less than the WFO counterpart in 80% of cases and more than the WFO profile in 10% of cases. The differences in ablation depth were less than 10% between the two groups.
From a practical perspective, these results have provided evidence that the current modus operandi in terms of ablation profile selection is supported by the findings of this comparative study. With WaveLight excimer lasers, the WFO platform is utilized for most eyes as the majority of patients generally have no preoperative complaints in terms of visual quality. Patients with visual quality issues and validated wavefront maps do best with WFG procedures. T-CAT procedures should be considered for patients with subjective complaints where wavefront maps cannot be validated. In the authors’ experience, T-CAT procedures work less well on primary cases as seen in this study, but perform best when used for enhancement surgery. It is important to note that ray tracing has not been used to date for enhancement surgery and potentially has the greatest opportunity to demonstrate its superiority in this very group. The subject of a future study is to investigate the safety and efficacy of ray tracing profiles for refractive surgery re-treatments.
A limitation of this study is that it was a nonrandomized trial. However, because the treatment selection was based on what was determined to be most appropriate for each individual eye, it would not have been possible to randomize patients.
Conclusion
Through the years, laser systems, procedures, and algorithms have improved, but the quest to achieve more precise and better refractive outcomes continues. Previously, a multicenter prospective study reported 3-month outcomes of ray tracing treatments and found the use of the ray tracing algorithm to be of benefit.Citation2 The results of this study reveal that a more precise personalized ablation treatment plan can be realized and that good results are maintained through 12 months of follow-up.
Disclosure
Dr Cummings is a member of the medical advisory board of WaveLight GmbH, Erlangen, Germany and a consultant for Alcon Laboratories, Fort Worth, TX, USA. Dr Kelly reports no conflicts of interest in this work.
References
- MrochenMBueelerMDonitzkyCSeilerTOptical ray tracing for the calculation of optimized corneal ablation profiles in refractive treatment planningJ Refract Surg2008244S446S45118500100
- SchumacherSSeilerTCummingsAMausMMrochenMOptical ray tracing-guided laser in situ keratomileusis for moderate to high myopic astigmatismJ Cataract Refract Surg2012381283422033124
- MolebnyVVPanagopoulouSIMolebnySVWakilYSPallikarisIGPrinciples of ray tracing aberrometryJ Refract Surg2000165S572S57511019876
- RobertsCFuture challenges to aberration-free ablative proceduresJ Refract Surg2000165S623S62911019887
- RobertsCThe cornea is not a piece of plasticJ Refract Surg200016440741310939720
- JesterJVPetrollWMCavanaghHDCorneal stromal wound healing in refractive surgery: the role of myofibroblastsProg Retin Eye Res199918331135610192516
- Moreno-BarriusoELlovesJMMarcosSNavarroRLlorenteLBarberoSOcular aberrations before and after myopic corneal refractive surgery: LASIK-induced changes measured with laser ray tracingInvest Ophthalmol Vis Sci20014261396140311328757