
Abstract
Introduction
Eye care in many countries is provided by optometrists, ophthalmologists, primary care providers (PCPs, including family physicians and pediatricians) and emergency department (ED) physicians. In the province of Prince Edward Island (PEI), Canada, optometric services are not government-insured, while services provided by other eye care providers are government-insured. Clinics of optometrists, PCPs and ED physicians are widely distributed across the island. Clinics of ophthalmologists however are concentrated in the capital city Charlottetown.
Purpose
To investigate if more patients visited government-insured PCPs and EDs for eye care when local optometric services are government-uninsured and government-insured ophthalmologists are potentially distant.
Methods
From PEI physician billing database, we identified all patients with an ocular diagnosis from 2010–2012 using International Classification of Diseases, 9th Revision (ICD-9) codes. The utilization of government-insured PCPs and EDs in five geographical regions was assessed utilizing patients’ residential postal code. Of the five regions, Prince was the region farthest from the capital Charlottetown.
Results
Compared to utilization of government-insured PCPs for ocular diagnoses in Charlottetown (13.5% in 2010, 95% confidence interval [CI] 12.9–14.0%), the utilization in Prince (22.4% in 2010, 95% CI 21.7–23.1%) was nearly double (p<0.05). The utilization of ED physicians for ocular diagnoses was similarly double in Prince (8.8%, 95% CI 8.3–9.3%) versus Charlottetown (4.1%, 95% CI 3.8–4.5%). The utilization of ophthalmologists however was significantly lower in Prince (43%, 95% CI 41.4–42.9%) versus Charlottetown (56.3%, 95% CI 55.6–57.1%). Similar trends remained throughout 2010–2012.
Conclusion
When optometric services are government-uninsured and government-insured ophthalmologist services are geographically distant, ocular patients utilized PCPs and ED physicians more frequently. Due to different levels of training and available equipment for eye examinations among PCPs, ED physicians and optometrists, the quality of eye care and cost-effectiveness of increased use of PCPs and ED physicians for ocular management warrant further investigation.
Trial Registration
Not applicable.
Introduction
Vision care in many countries, including England, Canada, the USA and Australia, is provided by optometrists, ophthalmologists, primary care providers (PCPs, including family physicians and pediatricians) and emergency department (ED) physicians.Citation1–Citation4 In Canada, access to services provided by optometrists, PCPs and ED physicians do not require a referral but to access ophthalmologists a referral is often required. Due to lack of instrumentation and limited training in eye care, PCPs and ED physicians usually treat simpler ocular conditions and typically do not treat or screen for diseases like glaucoma. Instead, PCPs and ED physicians usually refer patients with ocular concerns to optometrists and ophthalmologists.Citation5,Citation6
According to the Canada Health Act, medically necessary hospital and physician services are government-insured.Citation7 As a result, funding for medically necessary eye care services provided by PCPs, ED physicians and ophthalmologists is universally government-insured across Canada, but the funding for optometric services varies by province and territory. In Prince Edward Island (PEI), none of the optometric services were government-insured prior to 2015.Citation8,Citation9 In August 2015, PEI began to insure optometric services for diagnosis and treatment of dry eye, red eye and screening for ocular diseases in diabetic patients,Citation9,Citation10 however, optometrists in PEI can exam, diagnose and refer for treatment of any abnormal condition of the eye.Citation11 Prior to the policy change in 2015, PEI residents had to pay out-of-pocket or had the cost of optometric services either fully or partially covered through private- or employer-associated insurance.
Although eye care services provided by ophthalmologists in PEI are government-insured, five out of six ophthalmologists during the study period had their clinics located in Charlottetown, the capital of PEI.Citation12 One additional ophthalmologist had a clinic located in Cornwall, approximately 11km west of Charlottetown.Citation12 The uneven distribution of ophthalmologists is a ubiquitous phenomenon in many countries.Citation1,Citation13,Citation14 In contrast, the clinic locations of optometrists, PCPs and ED physicians are widely distributed across the island.Citation12 PEI residents with eye problems residing outside of Charlottetown face challenges of travelling to Charlottetown to see government-insured ophthalmologists or paying out-of-pocket to see optometrists in their neighbourhood. The travel expenses, cost of absence from work, potential requirement for travel-related assistance and travel time may direct residents outside of Charlottetown to a third choice, that is to visit PCPs or ED physicians for their eye care. This third choice may raise concerns on disparities in eye care as the scope and quality of eye care provided by PCPs and ED physicians are not comparable to those provided by optometrists.
We investigated if ocular patients frequently visited PCPs and EDs for eye care when optometric services available locally are not government-funded and government-funded ophthalmologists’ services are geographically distant.
Methods
Data Sources
PEI physician billing database from years 2010 to 2012 was analyzed. This database contained information on government-insured health services. Non-government-insured services were not captured by the database. Before the analyses, each patient was de-identified using an unidentifiable subject number. All patients with an ocular diagnosis were identified using the International Classification of Diseases, 9th Revision (ICD-9) codes (Appendix A). If an individual had multiple ocular visits in a given study year, only their last visit was retained in the analysis so as to remove the correlated data points and reflect their last provided eye care service. Practitioners’ specialty was recognized using specialty code.
Five geographical regions (Charlottetown, Stratford, Queens & Kings, Summerside and Prince) were examined using patients’ first three-alphanumeric characters of the postal code (). PEI population data at the regional and provincial level was obtained from Statistics Canada.Citation15
Figure 1 Five geographic regions of Prince Edward Island based on forward sortation area (first three characters of the postal code). Forward sortation area data were obtained from Statistics Canada, forward sortation area boundary data, 2011.

Statistical Analyses
We calculated the utilization of PCPs (or EDs) for ocular diagnoses in each of the five regions in PEI as the number of individuals with an ocular condition diagnosed by PCPs (or ED physicians) in a specific region among the total number of individuals with an ocular condition diagnosed by all health care providers with services insured by PEI in that region. Additionally, we calculated the PCP (or ED) utilization for new ocular diagnoses in 2011 and 2012 by excluding individuals with an ocular-related visit in the year(s) prior to the study year. For example, if an individual had an ocular visit in 2010 and/or 2011, this individual was excluded from the calculation of PCP (or ED) utilization for new ocular diagnosis in 2012. The region-specific utilization rates were age-standardized using all ocular patients in PEI as the standard. The age-standardized procedure was used to remove differences caused by different age structures in a population.Citation16 Standardized rate ratios (SRR) were calculated by dividing each standardized rate by the reference rate (Charlottetown).Citation16 For example, with a rate of 22.4% in Prince and 13.5% in Charlottetown, the SRR for Prince vs Charlottetown is 22.4%/13.5%=1.66, which represents the probability of utilization of the population Prince compared to the population in Charlottetown. The 95% confidence interval (CI) of SRR was also computed to assess the statistical significance of differences in rates.Citation16 When this interval includes 1.0, the utilization rates are not significantly different.Citation16 When the 95% CI of SRR does not include 1.0, the differences are statistically significant.Citation16 We also investigated the proportion of patient visits to PCPs (or EDs) that were for ocular diagnosis among all PCP or ED patients in each of the five regions. The 95% CI of this proportion was calculated using the Wilson method.Citation17,Citation18 The Wilson method is used when the proportion or prevalence is very low or very high as exhibited in our study.Citation17 Using the conventional method based on binomial distribution in such scenarios is inappropriate.Citation18
To examine if there were any regional differences in the occurrence of ocular conditions that could account for differences in utilization rates, the prevalence of ocular diagnoses for each of the five regions in PEI were calculated. The prevalence was computed as the total number of individuals with an ocular diagnosis in each region divided by the population in that region in 2011. The prevalence was age-standardized using the PEI census population in 2011 as the standard.Citation15
Diabetic patients may visit PCPs or ED physicians for ocular and non-ocular related complications. Since the diabetes code used by PCPs and ED physicians cannot distinguish between ocular or non-ocular related visits, the PCP and ED utilizations were calculated by including and excluding individuals with a diabetes code in the analyses to test the robustness of the results. If the diabetes code was submitted by ophthalmologists, this diagnostic code was highly likely to be ocular-related and thus was not excluded. Due to similarities in results of excluding and including diabetes code, only the results with diabetes code excluded were presented in this report. All analyses were carried out using SAS v9.4 (Cary, NC). Ethics approval for this study was obtained from the PEI Research Ethics Board.
Results
The mean age of patients with an ocular diagnosis was similar across the five different regions (53–61 years, ). The proportion of females with an ocular diagnosis (51–60%) was consistently higher than the proportion of ocular diagnoses in males (40–49%) in all 5 regions (). This is in line with prior reports.Citation19,Citation20
Table 1 Demographics of Residents with an Ocular Diagnosis from 2010–2012 in Prince Edward Island (PEI), Canada, Stratified by 5 Regions in PEI. ICD-9 Code for Diabetes Was Excluded as a Part of Ocular Diagnoses
Prevalence of Ocular Diagnoses
After the effect of age was removed, the age-standardized prevalence of ocular diagnoses in Prince, Summerside and Queens & Kings regions was significantly lower compared to the rate in Charlottetown (SRR<1 from 2011–2012 in all three regions, P<0.05, ). The age-standardized prevalence of ocular diagnoses in Stratford, however, did not differ significantly from Charlottetown (P>0.05, ). Stratford is the region closest to Charlottetown ().
Table 2 Age-Standardized Prevalence Rate (per 100 Populations) of Ocular Diagnosis and Standardized Rate Ratios (SRR) from 2010–2012, Prince Edward Island, Canada
Utilization of PCPs, ED Physicians and Ophthalmologists for Ocular Diagnoses Among Ocular Patients
Prince is the region farthest away from Charlottetown (). The utilization of PCPs for ocular diagnoses in Prince was greatest among the five regions from 2010 to 2011 (, left panel). In 2010, the utilization was 22.4% (95% CI 21.7–23.1%) in Prince versus 13.5% (95% CI 12.9–14.0%) in Charlottetown, giving an SRR of 1.66 (95% CI 1.51–1.84). In 2011, the SRR was 1.31 (95% CI 1.18–1.44) for Prince versus Charlottetown. In 2012, however, the SRR (1.07; 95% CI 0.96–1.19) for PCP utilization between Prince and Charlottetown was not statistically significant.
Figure 2 Utilization of primary care providers (PCPs, left panel) and emergency department (ED) physicians (right panel) per 100 individuals with ocular diagnoses from 2010 to 2012 in Prince Edward Island, Canada.
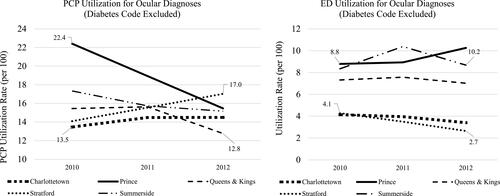
The utilization of ED physicians for ocular diagnoses was similarly greater in Prince than in Charlottetown from 2010–2012 (, right panel), eg, 8.8% (95% CI 8.3–9.3%) in Prince in 2010, compared to 4.1% (95% CI 3.8–4.5%) in Charlottetown (SRR: 2.12, 95% CI 1.76–2.55). The SRR for Prince versus Charlottetown was 2.26 (95% CI 1.89–2.70) in 2011 and 3.0 (95% CI 2.50–3.62) in 2012. The highest ED utilization in Prince was registered in 2012 (10.3% , right panel), which may in part explain the reduced utilization of PCPs in Prince in 2012 (, left panel) as more patients with ocular diagnoses went to EDs rather than PCPs.
The ED utilization in Summerside and Queens & Kings was also significantly higher compared to Charlottetown (, right panel). The ED utilization in Stratford, however, was not statistically greater than Charlottetown (, right panel).
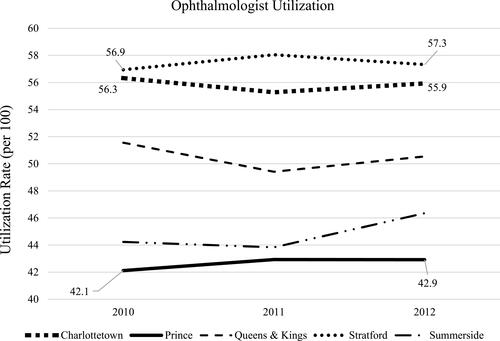
In contrast, the utilization of ophthalmologists by individuals from Prince was significantly lower from 2010 to 2012 (), at 42.1% (95% CI 41.4–42.9%) in Prince in 2010 compared to 56.3% (95% CI 55.6–57.1%) in Charlottetown. The SRR for Prince versus Charlottetown was 0.75 (95% CI 0.72–0.78) in 2010, 0.78 (95% CI 0.75–0.81) in 2011 and 0.77 (95% CI 0.74–0.80) in 2012. Residents in Summerside also utilized ophthalmologists significantly less often than those residing in Charlottetown from 2010–2012 (). The SRR for Summerside versus Charlottetown was 0.79 (95% CI 0.75–0.82) in 2010, 0.79 (95% CI 0.76–0.83) in 2011 and 0.83 (95% CI 0.79–0.87) in 2012.
Figure 3 Utilization of ophthalmologist per 100 individuals with ocular concerns from 2010 to 2012 in Prince Edward Island, Canada.
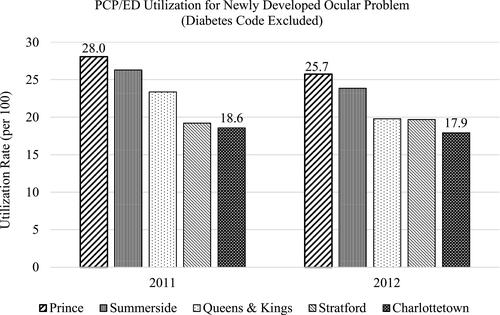
When PCP (or ED) utilization for newly developed ocular concerns was investigated, Prince had the highest PCP (or ED) utilization for new ocular diagnoses in 2011 and 2012, eg, at 28.0% (95% CI 27.3–28.8%) in Prince in 2011 compared to 18.6% (95% CI 17.9–19.2%) in Charlottetown ().
Figure 4 The utilization of primary care providers (PCPs) and emergency department (ED) physicians per 100 individuals with newly developed ocular diagnoses in 2011 and 2012 in Prince Edward Island, Canada. Individuals with an ocular diagnosis in the year(s) prior to the study year were excluded.
Utilization of PCPs and ED Physicians for Ocular Diagnoses Among Patients Visiting PCPs and EDs
Among all patients visiting PCPs, Prince had the highest proportion of ocular diagnoses, eg, at 3.0% (95% CI 2.8–3.3%) in Prince in 2010 compared to 1.6% (95% CI 1.5–1.8%) in Charlottetown in 2010 ().
Table 3 The Proportion (%) of Ocular Diagnoses Among All Patients Visiting Primary Care Providers (PCPs) or Emergency Departments (EDs) from 2010 to 2012 in Prince Edward Island (PEI), Canada, Stratified by 5 Regions in PEI. ICD-9 Code for Diabetes Was Excluded as a Part of Ocular Diagnoses
Similarly, Prince had the highest proportion of ocular diagnoses among all ED patients from 2010–2012, eg, 3.8% (95% CI 3.4–4.3%) in Prince in 2010 versus 1.8% (95% CI 1.5–2.1%) in Charlottetown in 2010 ().
Discussion
In the PEI healthcare system where optometric services available in neighbourhoods are government-uninsured and the government-insured ophthalmologists’ services are geographically distant, we report greater levels of PCP and ED utilization for ocular diagnoses in regions far away from ophthalmologists’ clinics (such as Prince and Summerside). In contrast, the level of utilization of ophthalmologists and the prevalence of ocular diagnoses in Prince and Summerside were significantly lower compared to the utilization of ophthalmologists and the prevalence of ocular diagnoses in Charlottetown where ophthalmologist clinics were concentrated.
We suggest the observed lower prevalence rates of ocular diagnoses in Prince and Summerside may likely reflect the lower detection of ocular diseases in these regions, rather than a truly lower occurrence of ocular diseases. Due to costs associated with seeing a neighbourhood optometrist and difficulty of travelling to Charlottetown to see a government-insured ophthalmologist, some residents with a non-acute eye problem residing in regions far away from ophthalmologist-concentrated Charlottetown may choose to ignore their symptoms. Therefore, they would not have been captured by the PEI health billing system. Among individuals whom chose to seek medical attention, they mostly relied on PCPs and EDs for “alternative eye care” and resulted in an increased use of PCPs and EDs for residents far away from the location of ophthalmologists in Charlottetown. When patients with a history of an ocular visit in the year(s) prior to the study year were removed, nearly a quarter (26%) of patients with newly developed ocular diagnoses residing in Prince relied on PCPs or EDs for medical care compared to about 18% of Charlottetown residents that visited PCPs or EDs for eye care. We believe the policy in PEI prior to 2015 unintentionally steered residents outside of Charlottetown to “alternative eye care” practitioners or potentially not seeking any medical attention for ocular concerns.
Although PCPs and ED physicians can effectively diagnose and manage certain ocular conditions, there may be gaps. For example, in cases of conjunctivitis, they often do not differentiate between viral, bacterial and allergic conjunctivitis and prescribe antibiotics for all.Citation21–Citation23 Furthermore, as PCPs and ED physicians frequently lack sophisticated equipment and specialized training, it may be difficult for them to correctly diagnose and manage the leading causes of blindness in developed countries such as glaucoma, diabetic retinopathy and age-related macular degeneration. Multiple studies report that most PCPs and ED physicians do not diagnose and manage these potentially blinding diseases.Citation6,Citation24,Citation25 In the US, 75% of family physicians do not routinely screen high-risk patients for glaucoma.Citation24 In Canada, among PCPs who claimed to routinely screen for glaucoma, 85% of them would refer the patient to an ophthalmologist or optometrist if they suspected the condition.Citation5 In Australia, a majority of GPs (74%) do not routinely examine their diabetic patients for diabetic retinopathy.Citation6 Lack of confidence in detecting diabetic retinopathy changes (86.4%) and time constraints (73.4%) are the two major barriers to GPs performing dilated fundoscopy on diabetic patients.Citation6
Compared to PCPs and ED physicians, optometrists are well equipped and trained to handle ocular patients with mild-moderate ocular disease and only refer severe or complicated patients to ophthalmologists. Funding optometric services may not only improve eye care for remote residents but can also reduce ophthalmologists’ burden of seeing patients that could be managed by optometrists. demonstrated PCPs and ED physicians in Prince see greater proportion of ocular diagnoses than other four regions in PEI. Funding optometric services could not only free up PCPs and ED physicians to see more patients that are appropriate to their skill sets, but save the expensive hospital cost associated with ED visits.
A study by the Canadian National Institute for the Blind has shown that transportation was one of the two most unmet needs for visually impaired individuals in Canada.Citation26 Transportation difficulties are often greater in rural areas. PEI is one of the most rural Canadian provinces with approximately 50% of the population residing in rural regions.Citation15,Citation26 Funding optometric services in PEI likely would mitigate the problem of transportation to a distant ophthalmologist clinic.
In August 2015, PEI government began to cover optometric services for three eye conditions.Citation9,Citation10 In April 2017, a new telephone consultation service by ophthalmologists was introduced to discuss patient’s complaints, review diagnostic data and provide advice to the referring physician.Citation27 These implemented changes may have lessened the disparities in eye care by geographic differences in recent years. Future investigations are needed to evaluate the effect of these policy changes and determine whether it is cost-effective to the PEI government to expand the optometric and/or ophthalmology telephone consultation services.
While the expansion of optometric services and the addition of telephone consultation by ophthalmologists in PEI may have had a tangible improvement in eye care, barriers to ophthalmologist access remain due to geographical distance. For sight-threatening diseases such as glaucoma, cataract and age-related macular degeneration which require advanced consultations and treatments, a referral to an ophthalmologist may be inevitable. In some cases, life-long follow-up visits to an ophthalmologist are needed. The transportation barrier still poses a challenge.
There are limitations in this study. First, the validity of ICD-9 codes for ocular diseases submitted by PCPs and ED physicians is unknown. To mitigate this limitation, we grouped all ocular diagnostic codes together, rather than examining individual diagnostic code. We believe it is unlikely that PCPs or ED physicians would submit a diagnostic code irrelevant to the eye (eg, a heart disease) for ocular diagnoses. Furthermore, studies reported that compared with ophthalmologists’ diagnoses, PCPs’ ability to recognize the eye as the diseased organ was greater than 92%.Citation28,Citation29 These reports significantly reduce our concerns on this issue. Secondly, the validity of specialty code in the database is unknown. Given the strict fee schedule put in place by the PEI government, we believe the validity of the specialty code is reasonably good. Thirdly, it is unknown, to what extent, the PEI residents have used private or employer insurance or out-of-pocket payment for optometric services. This information is not captured in the database. Prince is rural, and Charlottetown is urban. We suspect the proportion of individuals with private insurance coverage may be higher in Charlottetown. However, Summerside is urban and yet residents in Summerside had greater ED utilization and lower ophthalmologist utilization than Charlottetown. Therefore, differences in urban and rural areas may only play a small role. Fourthly, as of August 2015, only three optometric services (dry eye, red eye and screening for ocular diseases in diabetic patients) have been insured by the PEI government.Citation9,Citation10 It will be interesting to re-evaluate the data regarding the use of PCPs and EDs when the majority of optometric services are government insured. Lastly, information on vision outcomes is rarely available in health administration databases.
The strength of this investigation is that this is a population-based study and it is likely free of selection bias.
In summary, we observed significant disparities in eye care utilization across PEI. In years 2010–2012 the utilization of PCPs and EDs for ocular diagnoses was higher while the utilization of ophthalmologists was lower in regions far from Charlottetown such as Prince and Summerside. Owing to differences in the levels of training and available equipment for eye examinations among PCPs, ED physicians and ophthalmologists, residents outside of Charlottetown and its nearby region Stratford may not have received the same standard of eye care as those residing in these two regions. Distance barriers to see a government-insured ophthalmologist and costs associated with seeing an optometrist likely contributed to the observed disparities in eye care. To minimize the reported disparities, funding all optometric services could potentially reduce the need for some ocular patients to travel to ophthalmologists and reduce the need for public transportation. Funding optometric services could also allow PCPs and ED physicians to see more patients appropriate to their skill sets and reduce the expensive cost associated with ED visits, thus improving the health system efficiency. Alternatively, better ophthalmic training for PCPs working in remote regions and/or attempts to improve the distribution of medical ophthalmologists and address the transportation needs of visually impaired individuals could be considered.
Acknowledgment
The study abstract was presented at the Canadian Association for Health Services and Policy Research (CAHSPR), Toronto, May 24th, 2017, the Department of Ophthalmology and Vision Sciences, University of Toronto, May 27th, 2016 and the Dalla Lana School of Public Health, University of Toronto on November 25th, 2016.
Disclosure
Mr William Jeon reports grants from Canadian Institutes for Health Research, during the conduct of the study. Dr Yvonne M Buys reports grants from CIHR, during the conduct of the study. Dr Richard Wedge reports grants from Canadian Institutes for Health Research, during the conduct of the study. Dr Sherif El-Defrawy reports grants from Canadian Institutes for Health Research, during the conduct of the study. Ms Qi-Sheng Chen reports grants from Canadian Institutes for Health Research, during the conduct of the study. Dr Ya-Ping Jin reports grants from Canadian Institutes for Health Research and the Lindenfield Family Research Grant, during the conduct of the study.
None of the authors have reported any other financial or other conflicts of interest.
Additional information
Funding
References
- Al Ali A, Hallingham S, Buys YM. Workforce supply of eye care providers in Canada: optometrists, ophthalmologists, and subspecialty ophthalmologists. Can J Ophthalmol. 2015;50(6):422–428. doi:10.1016/j.jcjo.2015.09.001
- National Health Service. Eye health. Available from: https://www.england.nhs.uk/primary-care/eye-health/. Accessed January 21, 2021.
- National Eye Institute. Finding an eye doctor. Available from: https://www.nei.nih.gov/learn-about-eye-health/healthy-vision/finding-eye-doctor. Accessed January 21, 2021.
- Australia Government Department of Health. Section three: the delivery of eye health programs and services. Available from: https://www1.health.gov.au/internet/publications/publishing.nsf/Content/ageing-eyehealth-australia-toc.htm~ageing-eyehealth-australia-s3.htm. Accessed January 21, 2021.
- Huang JT, Rhemtulla F, Huang PT. Glaucoma screening by primary care physicians in southern Alberta: patterns, methods and deficiencies. Can J Ophthalmol. 2003;38(4):279–284. doi:10.1016/S0008-4182(03)80092-3
- Ting D, Ng J, Morlet N, et al. Diabetic retinopathy–screening and management by Australian GPs. Aust Fam Physician. 2011;40(4):233–238.
- Madore O. The Canada health act: overview and options. Available from: http://www.publications.gc.ca/Collection-R/LoPBdP/CIR/944-e.htm. Accessed January 21, 2021.
- The Canadian Association of Optometrists. Overview of provincial health coverage for optometric care. Available from: https://opto.ca/sites/default/files/resources/documents/prov_health_coverage_nov_2017.pdf. Accessed August 25, 2018.
- P.E.I. health services expanded to include primary eye care. The costs of primary eye care by optometrists now covered by the province. Available from: http://www.cbc.ca/news/canada/prince-edward-island/p-e-i-health-services-expanded-to-include-primary-eye-care-1.3183639. Accessed January 21, 2021.
- P.E.I. health services expanded to include primary eye care. Available from: http://www.cbc.ca/news/canada/prince-edward-island/p-e-i-health-services-expanded-to-include-primary-eye-care-1.3183639. Accessed January 21, 2021.
- Prince Edward Island Association of Optometrists. What is Optometry? Available from: https://peioptometrists.ca/about-us/. Accessed February 25, 2021.
- Khan AM, Trope GE, Wedge R, et al. Policy implications of regional variations in eye disease detection and treatment on Prince Edward Island: a repeated cross-sectional analysis, 2010–2012. BMC Health Serv Res. 2018;18(1):273. doi:10.1186/s12913-018-3068-z
- Maclennan PA, McGwin G Jr, Searcey K, Owsley C. A survey of Alabama eye care providers in 2010–2011. BMC Ophthalmol. 2014;14:44. doi:10.1186/1471-2415-14-44
- Kumar R. Ophthalmic manpower in India–need for a serious review. Int Ophthalmol. 1993;17(5):269–275. doi:10.1007/BF01007795
- Statistics Canada. 2011 Census Profile. Prince Edward Island (Code 11). Available from: https://www12.statcan.gc.ca/census-recensement/2011/dp-pd/prof/details/page.cfm?Lang=E&Geo1=PR&Code1=11&Geo2=PR&Code2=01&Data=Count&SearchText=11&SearchType=Begins&SearchPR=01&B1=All&Custom=&TABID=3. Accessed January 21, 2021.
- Boyle P, Parkin DM. Chapter 11. Statistical methods for registries. Int Agency Res Cancer. 1991;126–158.
- Wilson E. Probable Inference, the Law of Succession, and Statistical Inference. J Am Stat Assoc. 1927;22:209–212. doi:10.1080/01621459.1927.10502953
- Newcombe RG, Altman DG. Proportions and their differences. In: Altman DG, Machin D, Bryant TN, Cardner MJ, editors. Statistics with Confidence. 2nd ed. Bristol: J W Arrowsmith Ltd; 2000:45–55.
- Jin YP, Trope GE. Eye care utilization in canada: disparity in the public funded health care system. Can J Ophthalmol. 2011;46(2):133–138. doi:10.3129/i10-120
- Keeffe JE, Weih LM, McCarty CA, Taylor HR. Utilisation of eye care services by urban and rural Australians. Br J Ophthalmol. 2002;86(1):24–27. doi:10.1136/bjo.86.1.24
- Everitt H, Little P. How do GPs diagnose and manage acute infective conjunctivitis? A GP survey. Fam Pract. 2002;19(6):658–660. doi:10.1093/fampra/19.6.658
- Sheldrick JH, Wilson AD, Vernon SA, Sheldrick CM. Management of ophthalmic disease in general practice. Br J Gen Pract. 1993;43(376):459–462.
- Gordon-Shaag A, Zimmerman DR, Shneor E. The epidemiology and treatment of conjunctivitis at Urgent Care Centres in Israel. Clin Ophthalmol. 2019;13:771–779. doi:10.2147/OPTH.S202362
- Zoorob RJ, Khouri AS, Malpani V. Screening and referral patterns for glaucoma in family practice. J La State Med Soc. 1999;151(10):521–526.
- Basilious A, Cheng J, Buys YM. Comparison of glaucoma knowledge and referral practices among family physicians with ophthalmologists’ expectations. Can J Ophthalmol. 2015;50(3):202–208. doi:10.1016/j.jcjo.2015.01.006
- Simson H, Gold D, Zuvela B. An unequal playing field: report on the needs of people who are blind or visually impaired living in Canada. Toronto, Canada: Canadian National Institute for the Blind; 2005.
- Master agreement between the medical society of Prince Edward Island and the government of prince edward island and health PEI. Available from: https://www.princeedwardisland.ca/sites/default/files/publications/master_agreement.pdf. Accessed January 21, 2021.
- Sheldrick JH, Vernon SA, Wilson A. Study of diagnostic accord between general practitioners and an ophthalmologist. BMJ. 1992;304(6834):1096–1098. doi:10.1136/bmj.304.6834.1096
- Pierscionek TJ, Moore JE, Pierscionek BK. Referrals to ophthalmology: optometric and general practice comparison. Ophthalmic Physiol Opt. 2009;29(1):32–40. doi:10.1111/j.1475-1313.2008.00614.x