
 ?Mathematical formulae have been encoded as MathML and are displayed in this HTML version using MathJax in order to improve their display. Uncheck the box to turn MathJax off. This feature requires Javascript. Click on a formula to zoom.
Abstract
Purpose
The constitutive activation of the Ras–MEK–ERK signaling pathway in oral cavity squamous cell carcinoma (OSCC) has been found to be tightly controlled at multiple levels under physiological conditions. RASA1 and SPRED1 are two important negative regulators of this pathway, but the exact regulating mechanism remains unclear. In this study, we aimed to explore the potential regulating mechanisms involved in the Ras–MEK–ERK signaling pathway in OSCC.
Materials and methods
MicroRNA (miRNA) expression was detected by quantitative reverse-transcription polymerase chain reaction. The protein levels of RASA1, SPRED1, and signaling proteins were detected by Western blot. Cell growth was determined using CCK-8 reagent, colony formation was stained by crystal violet, and cell invasion was tested using transwell chambers. Cell apoptosis and the cell cycle were then analyzed by flow cytometry. The binding of miR182 with RASA1 or SPRED1 was evaluated by luciferase reporter assays on a dual-luciferase reporter system.
Results
The expression of miR182 was found to be upregulated significantly in malignant oral carcinoma tissues compared with the adjacent nonmalignant tissues, and was inversely correlated with protein levels of RASA1 and SPRED1. Overexpression of miR182 in OSCC cell lines sustained Ras–MEK–ERK signaling-pathway activation, and promoted cell proliferation, cell-cycle progression, colony formation, and invasion capacity, whereas miR182 downregulation alleviated these properties significantly in vitro. Furthermore, we demonstrated that miR182 exerted its oncogenic role in OSCC by directly targeting and suppressing RASA1 and SPRED1.
Conclusion
Our results bring new insights into the important role of miR182 in the activation of the Ras–MEK–ERK signaling pathway, and suggest that miR182 may be used as a potential target for treatment of OSCC, prompting further investigation into miRNA antisense oligonucleotides for cancer therapy.
Keywords:
Introduction
Oral cavity squamous cell carcinoma (OSCC), the most common type of head and neck cancer, is a leading cause of cancer-related mortality worldwide. OSCC constitutes approximately 90% of all oral malignancies, which mainly occur in the tongue and the floor of the mouth.Citation1,Citation2 Despite advances in diagnostic techniques and therapeutic regimens, the prognosis of OSCC remains poor, and is marked by an average 5-year survival rate of 50%, locoregional recurrence of 25%, and distant metastasis of 25%.Citation3 Carcinogenesis, including OSCC,Citation4 is thought to be prompted by the progressive accumulation of multiple genetic abnormalities, which include the deregulation of oncogenes or tumor-suppressing genes that play crucial roles in the pathogenesis of cancer. Therefore, there is an urgent need to gain a better understanding of the molecular mechanisms underlying the development of OSCC for improving early diagnosis and identifying new therapeutic targets.
MicroRNAs (miRNAs) are small, highly conserved, noncoding RNAs that are considered to play crucial roles in various cellular processes, such as proliferation, development, differentiation, and apoptosis. These single-strand RNAs can induce direct degradation of target messenger RNAs (mRNAs) or translational inhibition by negatively regulating gene expression at the posttranscriptional level.Citation5,Citation6 A single miRNA can regulate hundreds of protein-coding genes, while more than a third of all protein-coding genes are thought to be under translational control of miRNAs.Citation7
In recent years, miRNAs have been studied most intensively in the regulation of tumorigenisis, and growing evidence shows that the deregulation of certain miRNAs regulating oncogenes or tumor-suppressing genes is involved in the pathogenesis of cancers.Citation8 Emerging evidence has suggested that miRNAs can regulate the cellular signaling pathways involved in tumorigenesis through targeting the 3′-untranslated region (3′UTR) of corresponding mRNAs.Citation9–Citation12 Accordingly, the deregulation of certain miRNAs in OSCC has been reported to influence cell growth and development. For instance, transfection of an miR21 inhibitor to tongue SCC cell lines inhibits anchorage-independent growth, induces apoptosis, and suppresses tumor formation.Citation13 miR-31 has been found to be upregulated significantly in OSCC and head and neck squamous cell carcinoma,Citation14,Citation15 and overexpression of miR-31 represses the expression of factor-inhibiting HIF, thus activating the HIF pathway.Citation15 In addition, miR137 and miR193a inhibit cell growth by inducing apoptosis and G1–S arrest of OSCC cells by targeting CDK6 and E2F6.Citation16
The MAPK pathway is commonly activated in various cellular processes, of which the MEK–ERK pathway is one of the most deregulated in human cancers.Citation17 Upon stimulation, receptor tyrosine kinases translate the ligand-binding event into a signal and Ras is activated to a GTP-bound state. GTP-bound RAS (RAS-GTP) can activate the MAPKKK (Raf) family, leading to the sequential phosphorylation and activation of MAPKK (MEK) and ERK1/2. Notably, Ras is constitutively activated in various human cancer types and plays important roles in cell growth and development.Citation18 RASA1 and SPRED1, two negative regulators of the Ras–MEK–ERK signaling pathway, have been proved to be involved in the regulation of Ras activation. RASA1 can enhance the weak intrinsic GTPase activity of Ras, resulting in an increase in the inactive GDP-bound form of Ras, thereby leading to an aberrant intracellular signaling through the Raf–MEK–ERK pathway.Citation19 Whereas SPRED1 interacts with neurofibromin (NF1 gene products) and recruits it to the plasma membrane, where NF1 performs its function as an Ras GTPase-activating protein, hydrolyzing active Ras-GTP to inactive Ras-GDP.Citation20 Although mutations of RAS genes occur in approximately 15%–30% of all human cancers,Citation19 it appears that activated RAS mutations are rarely involved in head and neck tumors.Citation21,Citation22 Therefore, further exploring the regulatory mechanisms of key components of the Ras–MEK–ERK cascade, such as RASA1 and SPRED1, would increase our knowledge of the biological basis of activation of Ras in cancer and provide novel insights for tumor therapy.
Various miRNAs have been demonstrated to target members of the Ras–MEK–ERK pathway. Therefore, deregulation of such miRNAs in cancer cells most likely contributes to tumorigenesis by leading to an aberrant activation of the Ras–MEK–ERK pathway. In the present study, miR182 was revealed as a potential regulator of RASA1 and SPRED1 by in silico analysis. The expression of miR182, RASA1, and SPRED1 on malignant tissues and adjacent normal tissues from OSCC patients were examined by quantitative reverse-transcription polymerase chain reaction (qRT-PCR) and Western blot analysis. Direct inhibition of RASA1 and SPRED1 translation by miR182 and a potential role of MIR182 as an oncogene in OSCC tumorigenesis were experimentally validated in vitro. Notably, RASA1 and SPRED1 were determined to be direct targets of miR182 in regulating the Ras–MEK–ERK signaling pathway. Our data demonstrated that MIR182 functioned as an oncogene through regulating RASA1 and SPRED1, and uncovered a novel mechanism for constitutive Ras activation in OSCC.
Materials and methods
Human tongue SCC Tca8113 cells were obtained from the Cell Resource Center of Peking Union Medical College (Beijing, People’s Republic of China [PRC]). Fetal bovine serum was purchased from Biological Industries (Cromwell, CT, USA). An miRNA-isolation kit, miRNA RT kit, and miRNA qRT-PCR kit were all purchased from HaiGene Inc (Harbin, PRC). A cell-cycle assay kit and annexin V–fluorescein isothiocyanate (FITC)/propidium iodide (PI) kit for apoptosis analysis were also purchased from HaiGene. The primary antibodies against RASA1, SPRED1, β-actin, and secondary antibodies were all purchased from Santa Cruz Biotechnology Inc (Dallas, TX, USA), and primary antibodies against ERK1/2 and phospho-ERK1/2 were purchased form Cell Signaling Technology (Danvers, MA, USA). The transfection reagent Lipofectamine 2000 was obtained from Thermo Fisher Scientific (Waltham, MA, USA), and miR182 mimics, anti-miR182 oligonucleotides, and corresponding controls were all obtained from Ruibo Inc (Guangzhou, PRC). CCK-8 reagent was purchased from Dojindo (Kumamoto, Japan). Matrigel basement membrane matrix was purchased from BD (Franklin Lakes, NJ, USA). An active Ras pull-down assay kit was purchased from EMD Millipore (Billerica, MA, USA). A luciferase-activity assay kit was obtained from Promega Corporation (Fitchburg, WI, USA).
Patient samples and cell culture
Fresh malignant tissues and adjacent noncancerous tissues were collected from ten OSCC patients (tongue, gum, and floor of the mouth) who underwent surgery at Harbin First Hospital (Harbin, PRC). Written informed consent of tissue donation for research purposes and for this study were obtained from each patient, and this study was approved by the institutional review board of Harbin First Hospital. None of the patients had received chemotherapy, radiotherapy, or immunotherapy before surgery. The clinical and pathological profiles of patients are shown in . Tumor tissues from the tongue, gum, and floor of the mouth were histopathologically diagnosed and verified by experienced pathologists. Adjacent noncancerous tissues were examined by routine histopathological analysis and confirmed to be tumor-free. Specimens were snap-frozen in liquid nitrogen immediately after surgery and stored at -80°C. Tca8113 cells were cultured in Roswell Park Memorial Institute 1640 medium supplemented with 10% fetal bovine serum, penicillin, and streptomycin (100 IU/mL) at 37°C under a 5% CO2 atmosphere in a humidified incubator.
Table 1 Clinical and pathological data of patients in this study
miRNA qRT-PCR analysis
miRNAs were isolated from the paired tissues according to the protocol provided by the manufacturer and reverse-transcribed to complementary DNA with TaqMan miRNA RT primer. Expression differentiation of miRNAs in paired tissues was analyzed by quantitative PCR analysis on a Bio-Rad Opticon 2 real-time PCR system. The specific forward and reverse primers were included in the kit. Relative expressions of miRNAs were calculated by the method of
, and small nuclear RNA U6b was used for normalization.
Western blot analysis
Tissue samples or cells were lysed in radioimmunoprecipitation- assay buffer supplemented with 1 mM phenylmethylsulfonyl fluoride. Protein concentrations were determined using a bicinchoninic acid protein-assay kit. Total proteins were separated with sodium dodecyl sulfate-polyacrylamide gel electrophoresis and transferred onto nitrocellulose membrane in 20 mM Tris-HCl (pH 8) containing 150 mM glycine and 20% (v/v) methanol. Membranes were blocked with 5% nonfat dry milk in Tris-buffered saline containing 0.05% Tween 20 at room temperature for 1 hour. Then, the membranes were probed with polyclonal antibodies against RASA1 (1:500), SPRED1 (1:300), ERK1/2 (1:800), or pERK1/2 (p44/42) (1:500) overnight at 4°C, and β-actin antibody (1:1,000) was used as a loading control. Then, the membranes were incubated with horseradish peroxidase-conjugated secondary antibody (1:5,000) for 1 hour. The signals were developed with enhanced chemiluminescence reagent, and digital images were captured using an LAS 4000 charge-coupled device camera system. The relative intensity of bands was analyzed with Image-Pro Plus 6.0 software.
miRNA transfection
The miR182 mimics (50 nM), negative control (NC; 50 nM), anti-miR182 oligonucleotides (100 nM), and anti-miR182 NC (100 nM) were synthesized for transfection. Anti-miR182 oligonucleotides are modified antisense oligonucleotides designed specifically to bind to and inhibit endogenous miR182 with rare off-target effect. The corresponding miRNA sequences were: miR-NC, 5′-AUAUGACGUACGUGUAACGUACUC-3′; miR182 mimics, 5′-UUUGGCAAUGGUAGAACUCACACU-3′; anti-miR NC, 5′-UCCGAGUGCUAUACGCUAGUAAAU-3′; and anti-miR182 oligonucleotides, 5′-AGUGUGAG UUCUACCAUUGCCAAA-3′. Transfections with miR182 mimics, anti-miR182 oligonucleotides, or controls were performed using Lipofectamine 2000 reagent in Tca8113 according to the manufacturer’s instructions.
Cell-proliferation assay
Cell-proliferation assays were conducted using CCK-8 reagent: 104 Tca8113 cells per well were seeded in 96-well plates and incubated overnight. Tca8113 cells were transfected with miR182 mimics, anti miR182 oligonucleotides, or controls using Lipofectamine 2000. The cells were incubated with 10 μL of CCK-8 reagent for 2 hours at 24, 36, 48, 60, and 72 hours after transfection, and then absorbance at 450 nm was measured at each time point. Assays were conducted in three replicate wells for each sample, and the experiment was performed in triplicate.
Colony-formation assay
Tca8113 cells (500 cells per well) were collected and seeded in six-well plates after transfection for 48 hours, and continued to culture for 14 days. Cells were subsequently fixed with methanol (20% v/v) and stained with crystal violet (0.2% w/v) for 5 minutes. Colonies with more than 50 cells per colony were counted. The experiments were repeated in triplicate to get standard deviations.
Cell-invasion assay
The invasive capacity of cells was tested using BD transwell invasion chambers. Transwell chambers were covered with Matrigel beforehand, and Tca8113 cells (105 per chamber) suspended in 100 μL serum-free medium were added to the upper chambers. The lower chambers were filled with complete growth medium (Roswell Park Memorial Institute 1640+10% fetal bovine serum). After incubation for 48 hours, cells on the upper surface of the membrane were wiped off using a cotton swab. Then, the invaded cells were fixed in 4% formaldehyde for 30 minutes and stained with 0.1% crystal violet for 5 minutes. Finally, the cells were counted and imaged under a microscope. The experiment was performed in triplicate.
Cell-cycle analysis
Cells (0.5×10⁶ per well) were harvested from six-well plates and then fixed in 75% ice-cold ethanol. The fixed cells were subsequently treated with a cell-cycle assay kit according to the manufacturer’s manual protocol. Briefly, the fixed cells were resuspended in phosphate-buffered saline at a concentration of 3×10⁵/mL. Then, the cells were treated with RNase A for 20 minutes, followed by incubation with PI for 15 minutes. Cell-cycle analysis was performed using Guava® EasyCyte flow cytometry with GuavaSoft 2.5. Data were analyzed with FlowJo software, and cell-cycle distribution was shown as the percentage of cells in the G1, S, and G2 populations. The experiment was performed three times to get standard deviations.
Cell-apoptosis analysis
Apoptosis analysis was performed using an annexin V–FITC/PI kit according to the manufacturer’s instructions on Guava flow cytometry with GuavaSoft 2.5. Cells (0.5×10⁶) were harvested from six-well plates and resuspended in binding buffer at a concentration of 105/mL. Cells were subsequently incubated with annexin V–FITC and PI for 15 minutes at room temperature. Then, cells were detected on flow cytometry and the data analyzed with the FlowJo software. The percentage of cells that were annexin V–FITC-positive but PI-negative was compared among different treatment groups. Each experiment was performed in triplicate.
Active Ras pull-down assay
Active Ras was determined using an Ras-assay reagent, a glutathione S-transferase fusion protein corresponding to the Ras-binding domain of Raf1. According to the manufacturer’s instructions, Tca8113 cells were seeded in 100 mm dishes at 2×10⁶ per dish. After transfection with miR182 mimics or anti-miR182 oligonucleotides for 48 hours, the cells were lysed with lysis buffer. Then, cell lysates were centrifuged at 14,000× g at 4°C, and the supernatant was used as the sample for subsequent Ras pull-down assay. A protein sample (1 mg) was mixed with 10 μg Raf1 Ras-binding domain agarose beads, and incubated for 45 minutes at 4°C. The beads were collected by centrifugation and resuspended in 40 μL reducing sample buffer, followed by boiling at 95°C for 5 minutes. Next, the samples of each pull-down reaction group were subjected to Western blot analysis using anti-Ras antibody (1:2,000 dilution).
Luciferase activity assay
Partial lengths of the 3′UTR of RASA1 (GenBank NM_002890.2) and SPRED1 (GenBank NM_152594.2) genes were synthesized and inserted downstream of the luciferase reporter gene in a PmirGLO vector. For luciferase reporter assays, cells were seeded in 24-well plates and incubated for 24 hours before transfection. Firefly luciferase constructs containing the 3′UTR of the potential miR182 target and pRL-TK Renilla luciferase-normalization control, miR182 mimics, or anti-miR182 oligonucleotides and NCs were cotransfected into Tca8113 cells using Lipofectamine 2000. Lysates were collected 48 hours after transfection and measured using a dual-luciferase reporter system according to the manufacturer’s protocol. Three independent experiments were performed, and the data are presented as mean ± standard deviation.
Statistical analysis
All experiments were done in triplicate, and results are presented as mean ± standard deviation. Comparisons of the data among different groups were performed by paired t-tests and one-way analysis of variance using SPSS software version 13.0. P<0.05 was considered statistically significant.
Results
miR182 expression is elevated in OSCC patients and inversely correlated with the expression of RASA1 and SPRED1
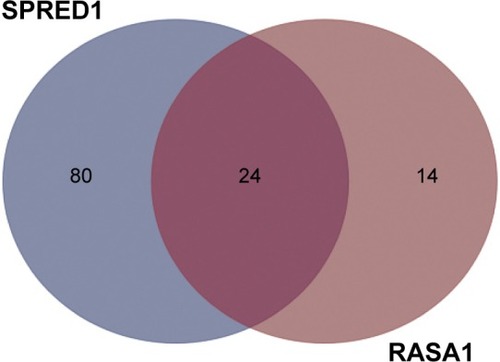
Since a single miRNA can affect hundreds of different protein-coding genes and one specific mRNA can be targeted by multiple miRNAs, we attempted to identify the miRNAs that activate Ras–MEK–ERK signaling pathway in OSCC through targeting RASA1 and SPRED1. To gain new insight into the mechanisms of activation of the Ras–MEK–ERK cascade in OSCC, the prediction algorithm of TargetScan was used to identify the potential miRNAs regulating both RASA1 and SPRED1. The 24 overlapped miRNAs were thought to be potential target miRNAs according to the prediction algorithm ().
Figure 1 Shared putative microRNAs potentially regulating both RASA1 and SPRED1 are identified by the prediction algorithm of TargetScan.
Then, expression of the 24 predicted miRNAs was screened in malignant tissues and paired nonmalignant tissues of ten OSCC patients through a TaqMan qPCR-based method (for patient information, refer to ). The results showed that four miRNAs – miR31, miR182, miR200a, and miR141 – were significantly upregulated, while three miRNAs – miR1, miR206, and miR212 – were downregulated in OSCC tumor tissues compared with paired noncancerous tissues (), but there was no significant differentiation in the expression of other miRNAs (containing four miRNAs undetected). Among these, miR31 was the most significantly upregulated (4.27-fold upregulation) in OSCC tumor samples, and miR182, miR200a, and miR141 were upregulated to 2.87-fold, 2.4-fold, and 1.7-fold, respectively (). Notably, the upregulation of miR31 has been intensively investigated in a variety of cancers, and thus miR182 was our research focus, and the expression differentiation of miR182 between the pairing tissues was matched ().
Figure 2 Expression differentiation of predicted miRNAs between malignant tissues and adjacent nonmalignant tissues from ten OSCC patients.
Abbreviations: T, malignant tumor tissues; N, adjacent nonmalignant tissues; miRNAs, microRNAs; OSCC, oral cavity squamous cell carcinoma; qRT-PCR, quantitative reverse-transcription polymerase chain reaction.
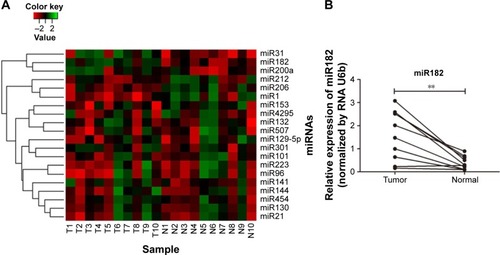
Table 2 Deregulated miRNAs potentially regulating RASA1 and SPRED1 between ten paired OSCC malignant tissues and adjacent noncancerous tissues
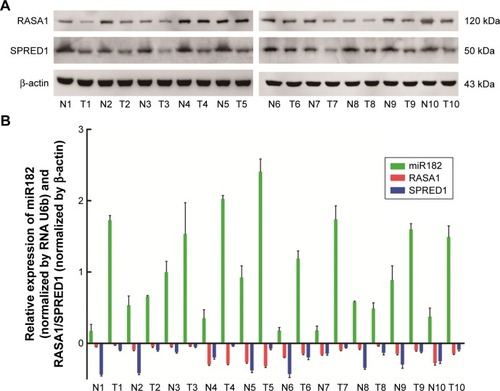
Based on the sequence alignment, it was found that there was a perfect base pairing between the seed of miR182 and 3′UTR of RASA1 or SPRED1. To identify further correlations among miR182 and RASA1 and SPRED1, Western blot was performed to compare the expression of RASA1 and SPRED1 in malignant OSCC tissues and adjacent normal tissues. The results showed that expression of RASA1 and SPRED1 was dramatically downregulated in OSCC tumor tissues (), which indicated that miR182 was inversely correlated with the expression of RASA1 and SPRED1 (). As such, we speculated that miR182 might be an oncogene and RASA1 and SPRED1 would be the potential targets of miR182 in regulating the tumorigenesis and progression of OSCC.
Figure 3 The reverse correlation of miR182 and RASA1 or SPRED1 protein levels.
Abbreviations: T, malignant tumor tissues; N, adjacent nonmalignant tissues; OSCC, oral cavity squamous cell carcinoma.
MiR182 promotes OSCC cell proliferation and cell-cycle progression
To elucidate the oncogenic role of miR182 in OSCC, Tca8113 cells were used for further investigation. Overexpression of miR182 was achieved by transfection of miR182 mimics, whereas downregulation of miR182 was achieved by transfection of anti-miR182 oligonucleotides. Similarly, control experiments were performed by transfection of miR-NC and anti-miR-NC.
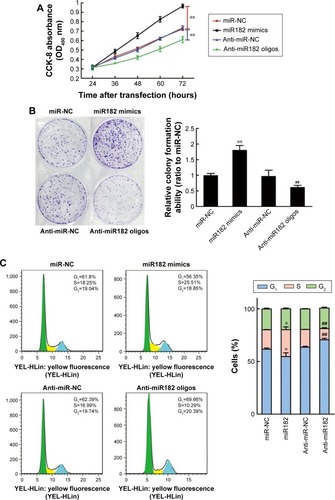
Cell proliferation was determined using CCK-8 reagent at 24, 36, 48, 60, and 72 hours after transfection. As shown in , the overexpression of miR182 significantly increased the growth rate of Tca8113 cells compared with the miR-NC group; however, downregulation of miR182 led to a decrease in cell viability. To prove further the proproliferating effect of miR182 in OSCC cells, a colony-formation assay was performed. The results showed that overexpression of miR182 increased the colony numbers of Tca8113 cells, and the colonies were much larger than the NC, while downregulation of miR182 depressed colony formation (). To understand further the proproliferating mechanism, the effects of miR182 on the cell cycle were investigated using flow cytometry. The data showed that there was a dramatic decrease in the percentage of cells in the G1/G0 phase (6.9%) and an increase in cells in the S phase (7.1%) in miR182-overexpressing Tca8113 cells compared with NC cells. In contrast, there was a significant increase in the percentage of cells in the G1/G0 phase (7.2%) and a decrease in the percentage of cells in the S phase (6.3%) in miR182 downregulation of Tca8113 cells compared with anti-miR-NC cells (). As such, overexpression of miR182 promoted proliferation and cell-cycle progression of OSCC cells in vitro.
Figure 4 miR182 promotes OSCC cell proliferation and cell-cycle progression.
Abbreviations: Oligos, oligonucleotides; OSCC, oral cavity squamous cell carcinoma; NC, negative control; OD, optical density.
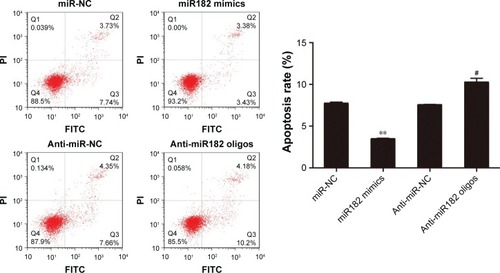
miR182 inhibits OSCC cell apoptosis
Since the proproliferating role of miR182 had been proved in OSCC cells, its involvement in cell apoptosis was further investigated by annexin V–FITC/PI costaining. The results showed that miR182-overexpressing cells had a lower apoptosis rate than miR-NC cells (3.45% vs 7.7%). On the contrary, the apoptosis rate was dramatically increased by downregulation of miR182 by transfection of anti-miR182 oligonucleotides (10.24% vs 7.53%) (). The results indicated that overexpression of miR182 inhibited the apoptosis of OSCC cells, whereas inhibition of miR182 enhanced Tca8113 apoptosis.
Figure 5 miR182 inhibits the apoptosis of OSCC cells.
Abbreviations: Oligos, oligonucleotides; OSCC, oral cavity squamous cell carcinoma; NC, negative control; FITC, fluorescein isothiocyanate; PI, propidium iodide.
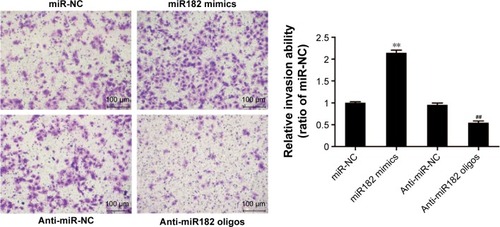
miR182 enhances invasive capacity of OSCC cells
To study further the effects of miR182 on the invasive capacity of OSCC cells, a Matrigel invasion assay was performed using transwell chambers. shows that overexpression of miR182 significantly increased the invasive potential of Tca8113 cells compared with miR-NC cells. In contrast, downregulation of miR182 resulted in dramatically decreased invasive cell numbers. The results indicated that overexpression of miR182 enhanced invasion of OSCC cell in vitro.
Figure 6 miR182 promotes the invasion of OSCC cells.
Abbreviations: Oligos, oligonucleotides; OSCC, oral cavity squamous cell carcinoma; NC, negative control.
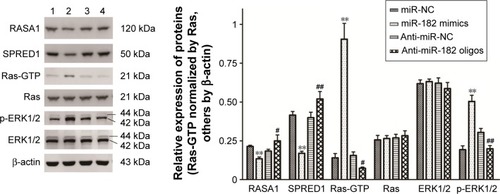
miR182 promotes activation of the Ras–MEK–ERK signaling pathway by regulating RASA1 and SPRED1
Since miR182 was predicted to be a putative miRNA regulating RASA1 and SPRED1 by in silico analysis and was found to be inversely correlated with the expression of RASA1 and SPRED1 based on the data from ten OSCC patients, we attempted to investigate whether miR182 directly regulates the expression of RASA1 and SPRED1. Western blot was performed to examine the expression differentiations of RASA1 and SPRED1 by upregulating or downregulating miR182 in Tca8113 cells. The results showed that RASA1 and SPRED1 expression was significantly decreased in miR182-overexpressing cells compared with miR-NC cells, whereas they were significantly increased in miR182-downregulated cells (). Since RASA1 and SPRED1 are two important negative regulators that directly influence the activation of GTP-Ras in the Ras–MEK–ERK signaling pathway, GTP-Ras and phospho-ERK1/2 were determined by Western blot after transfection of miR182 mimics or anti-miR182 oligonucleotides. The results revealed a significant increase in GTP-Ras and phospho-ERK1/2 by upregulation of miR182 (), which indicated that miR182 played a crucial role in activating the Ras–MEK–ERK signaling cascade. These results suggested that miR182 promotes activation of the Ras–MEK–ERK signaling pathway by suppressing RASA1 and SPRED1.
Figure 7 miR182 promotes the activation of the Ras–MEK–ERK signaling pathway by suppressing the expression of RASA1 and SPRED1.
Abbreviations: NC, negative control; p, phospho.
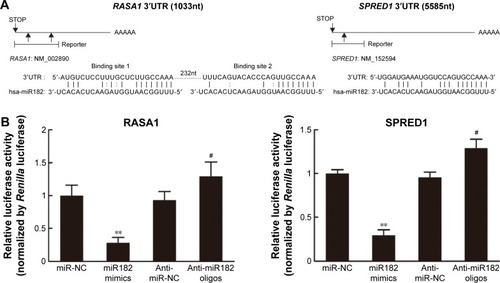
miR182 represses the translation of RASA1 and SPRED1 by directly targeting their 3′UTRs
Given that Western blot results had revealed that expression of RASA1 and SPRED1 was decreased significantly in miR182-overexpressing cells and increased in miR182-downreguled cells, we hypothesized that RASA1 and SPRED1 might be direct downstream targets of miR182. To confirm our hypothesis, we first aligned the sequence of miR182 with the 3′UTR of RASA1 and SPRED1. As shown in , there were two miR182-binding sites in the RASA1 mRNA 3′UTR and one binding site in the SPRED1 mRNA 3′UTR, and miR182 was predicted to bind to them strongly, due to good base pairing. Next, luciferase-binding assays were conducted using the PmirGLO luciferase plasmid to determine whether miR182 suppressed RASA1 and SPRED1 through directly binding to their 3′UTRs. The partial length of wild-type RASA1 or SPRED1 3′UTRs were synthesized and cloned into the PmirGLO luciferase reporter plasmid. Then, the constructed luciferase reporter plasmids were cotransfected with either miR182 mimics, anti-miR182 oligonucleotides, or controls into Tca8113 cells. As shown in , the luciferase activity of wild-type RASA1 and SPRED1 decreased by 6.33-fold and 3.41-fold, respectively, by transfection of miR182 mimics compared with miR-NC. These results indicated that RASA1 and SPRED1 were direct targets of miR182 in OSCC.
Figure 8 miR182 regulates RASA1 and SPRED1 by directly targeting their 3′UTRs.
Abbreviations: UTRs, untranslated regions; mRNAs, messenger RNAs; NC, negative control.
Discussion
Deregulation of miRNAs has been demonstrated to be involved in tumorigenesis and progression in various types of cancers; however, elucidation of their potential roles in OSCC remains relatively rare. In the present study, it was found that miR182 was significantly upregulated in OSCC carcinoma tissues compared with adjacent noncancerous tissues, which was consistent with previous data on differential miRNA-expression profiles in OSCC.Citation23 Overexpression of miR182 in OSCC cell lines sustained Ras–MEK–ERK signaling pathway activation by suppressing RASA1 and SPRED1. Moreover, introduction of anti-miR182 oligonucleotides strikingly repressed the oncogenic properties of miR182, represented by inhibiting cell proliferation, colony formation, invasion, and promoting cell apoptosis. Therefore, our results provide new insights into the important role of miR182 in activation of the Ras–MEK–ERK signaling pathway, and demonstrate that miR182 functions as an oncogenic miRNA in OSCC.
The highly conserved Ras–MEK–ERK signaling pathway is involved in a wide range of cellular processes, including cell growth, proliferation, differentiation, survival, and senescence. This pathway is aberrantly activated in a variety of human cancers. Previous research has mostly focused on the somatic mutations in genes encoding Ras/Erk members that frequently occur in cancers, of which the RAS mutation is the most prevalent event in human cancers. Aberrant RAS function is closely associated with a single mutation, typically at codon 12, 13, or 61.Citation24 Mutation at these conserved sites favors GTP binding, and leads to constitutive activation of the Ras–MEK–ERK pathway. RAS plays essential roles in controlling the activity of multiple downstream effectors of pathways responsible for cellular proliferation and survival.Citation18 However, RAS mutation in oral carcinomas is not so common as in other cancers, such as lung cancer and colorectal cancer. RAS mutation has been reported in 20%–35% of cases from India,Citation25 whereas lower frequencies (4%) were reported from the UK and no mutation reported from the US.Citation26,Citation27 Therefore, it is likely that mechanisms other than RAS mutation contribute to the constitutive activation of the Ras–MEK–ERK cascade in oral carcinomas.
The Ras protein cycles between the inactive GDP-bound and the active GTP-bound state, and the GTPase activity of normal Ras p21 is mediated by two negative regulators: RASA1 and SPRED1. A number of studies have shown that deregulation of RASA1 has an oncogenic effect in multiple types of human cancer. For instance, the expression of RASA1 was repressed by miR31, and the Ras–MEK–ERK signaling pathway was activated to stimulate tumorigenesis in human colorectal cancer.Citation28 Downregulation of RASA1 by miR31 was also found to promote cellular proliferation and inhibit cellular apoptosis in intrahepatic cholangiocarcinoma by activating the Ras–MAPK signaling pathway.Citation10 In addition, miR206/21 was illustrated to promote coordinately Ras–ERK signaling by suppressing the translation of RASA1 and SPRED1 in breast cancer.Citation29 Herein, we found that overexpression of miR182 significantly increased but downregulation of miR182 inhibited ERK activation by targeting RASA1 and SPRED1 in OSCC. Consistently, overexpression of miR182 can enhance the aggressiveness of oral carcinoma cells. Therefore, our results indicate that miR182 plays important oncogenic roles in the tumorigenesis and progression of OSCC through activating the Ras–MEK–ERK signaling pathway.
Our results showed that the expression of miR182 was elevated in malignant tissues compared with adjacent normal tissues in OSCC. Consistent with our findings, other studies have correlated a high level of miR182 to increased pathological aggression of tumors and poor survival of patients in various human cancers. For example, miR182 was found to be frequently upregulated in human breast-tumor tissues and cell lines, and was also significantly elevated in the serum of breast cancer patients compared with healthy controls.Citation30,Citation31 Although the role of miR182 in lung cancer seems to be controversial, upregulated expression of miR182 was indeed found in lung cancer cells and tissues.Citation32,Citation33 In addition, miR182 has also proved to be upregulated in clinical tissue samples of melanoma, glioma tumors, ovarian cancer, colorectal cancer, and prostate cancer, which promoted survival, migration, invasion, and metastasis of tumor cells.Citation34–Citation38
There are several possible causes for the deregulation of miR182 in human cancers. One possible cause is regional amplification. miR182 is a member of an miRNA cluster (miR183/96/182), a highly conserved cluster residing on an intergenic region of human chromosomes 7q31–34, and is frequently amplified in human cancers.Citation39 For example, miR182 has been confirmed to be amplified in advanced human melanoma and soft tissue sarcomas, which correlates with poor prognosis.Citation34,Citation40 Another possible mechanism may be the regulation of transcriptional factors. It has been reported that miR182 is transcriptionally activated by the Wnt-pathway effector β-catenin to promote colony formation and invasiveness of MDA-MB-231 breast cancer cells.Citation41 However, overexpression of miR182 has been reported to inhibit lung cancer tumorigenicity both in vitro and in vivo. In addition, miR182 exerts antiproliferative activity and inhibits cell invasion by targeting the G protein GNA13 in prostate cancer-cell lines.Citation42,Citation43 Since each single miRNA can target multiple mRNAs and be involved in various signaling pathways to exert diversified functions, it is reasonable to speculate that the molecular routes through which miR182 exerts its regulatory effects are largely context-dependent, which helps in understanding the pluripotency of this miRNA in cancer.
Upregulation of miR182 was demonstrated to promote cell proliferation and colony formation in Tca8113 cells. The cell-cycle analysis by flow cytometry showed that overexpression of miR182 led to a significant decrease in the percentage of cells in the G0/G1 phase and a significant increase in the percentage of cells in the S phase. It has been reported that Ras can regulate cell-cycle progression by modulating transcriptional factors in diverse cell types and act at different phases of the cell cycle.Citation44 Therefore, it is likely that miR182 controls the cell cycle through regulating Ras by targeting RASA1 and SPRED1. Moreover, elevation of miR182 was also found to promote cell invasion in Tca8113. In fact, miR182 has been proved to be correlated with metastasis in melanoma and sarcomas,Citation34,Citation40,Citation45 which establishes a novel regulating mechanism for tumor metastasis. miR182 is overexpressed in human metastatic melanoma-cell lines and metastatic melanoma, and its overexpression can enhance the metastatic behavior of melanoma cells in vivo by converging onto FOXO3 and MITF inactivation. Besides, miR182 was found to be markedly overexpressed in sarcomas with lung metastasis, and downregulation of miR182 substantially inhibited, while elevated miR182 considerably accelerated the rate of lung metastasis of sarcomas. Furthermore, miR182 has been identified as a promising predictor of aggressive phenotype and an independent prognostic biomarker to predict the survival rate of patients following surgery in colorectal cancer, prostate cancer, and metastatic melanoma. Nevertheless, larger cohorts of patients with OSCC with complete clinical data, including staging, therapy, and disease-free survival, should be studied to determine whether miR182 can be a predictor of diagnosis and prognosis in OSCC.
Conclusion
In conclusion, our study identified miR182 as an oncogenic miRNA that exerts its regulatory effects on the Ras–MEK–ERK signaling pathway by inhibiting RASA1 and SPRED1 in OSCC. Therefore, miR182, RASA1, and SPRED1 might be used as potential therapeutic targets for the treatment of OSCC.
Author contributions
All authors contributed toward data analysis, drafting and critically revising the paper, and agree to be accountable for all aspects of the work.
Acknowledgments
This work was supported by the Foundation of Harbin Talent Introduction Project (grant 2014SYYRCYJ03).
Disclosure
The authors report no conflicts of interest in this work.
References
- RapidisADGullanePLangdonJDLefebvreJLScullyCShahJPMajor advances in the knowledge and understanding of the epidemiology, aetiopathogenesis, diagnosis, management and prognosis of oral cancerOral Oncol2009454–529930019411038
- ScullyCBaganJOral squamous cell carcinoma overviewOral Oncol2009454–530130819249237
- BozecAPeyradeFFischelJLMilanoGEmerging molecular targeted therapies in the treatment of head and neck cancerExpert Opin Emerg Drugs200914229931019519286
- ScullyCFieldJKTanzawaHGenetic aberrations in oral or head and neck squamous cell carcinoma (SCCHN) – 1: carcinogen metabolism, DNA repair and cell cycle controlOral Oncol200036325626310793327
- BartelDPMicroRNAs: genomics, biogenesis, mechanism, and functionCell2004116228129714744438
- HeLHannonGJMicroRNAs: small RNAs with a big role in gene regulationNat Rev Genet20045752253115211354
- GomesCCGomezRSMicroRNA and oral cancer: future perspectivesOral Oncol2008441091091418620891
- GarzonRCalinGACroceCMMicroRNAs in cancerAnnu Rev Med20096016717919630570
- JiangLYuLZhangXmiR-892b silencing activates NF-κB and promotes aggressiveness in breast cancerCancer Res20167651101111126747895
- HuCHuangFDengGNieWHuangWZengXmiR-31 promotes oncogenesis in intrahepatic cholangiocarcinoma cells via the direct suppression of RASA1Exp Ther Med2013651265127024223656
- YanBGuoQNanXXMicro-ribonucleic acid 29b inhibits cell proliferation and invasion and enhances cell apoptosis and chemotherapy effects of cisplatin via targeting of DNMT3b and AKT3 in prostate cancerOnco Targets Ther2015855756525784815
- ZhanYXiangFWuRMiRNA-149 modulates chemosensitivity of ovarian cancer A2780 cells to paclitaxel by targeting MyD88J Ovarian Res201584826223974
- LiJHuangHSunLMiR-21 indicates poor prognosis in tongue squamous cell carcinomas as an apoptosis inhibitorClin Cancer Res200915123998400819509158
- LiuCJKaoSYTuHFTsaiMMChangKWLinSCIncrease of microRNA miR-31 level in plasma could be a potential marker of oral cancerOral Dis201016436036420233326
- LiuCJTsaiMMHungPSmiR-31 ablates expression of the HIF regulatory factor FIH to activate the HIF pathway in head and neck carcinomaCancer Res20107041635164420145132
- KozakiKImotoIMogiSOmuraKInazawaJExploration of tumor-suppressive microRNAs silenced by DNA hypermethylation in oral cancerCancer Res20086872094210518381414
- SantarpiaLLippmanSMEl-NaggarAKTargeting the MAPK-RAS-RAF signaling pathway in cancer therapyExpert Opin Ther Targets201216110311922239440
- DownwardJTargeting RAS signalling pathways in cancer therapyNat Rev Cancer200331112212509763
- ClarkGJWestwickJKDerCJp120 GAP modulates Ras activation of Jun kinases and transformationJ Biol Chem19972723167716818999845
- StoweIBMercadoELStoweTRA shared molecular mechanism underlies the human rasopathies Legius syndrome and neurofibromatosis-1Genes Dev201226131421142622751498
- CoutinhoCMBassiniASGutierrezLGGenetic alterations in Ki-Ras and Ha-Ras genes in juvenile nasopharyngeal angiofibromas and head and neck cancerSao Paulo Med J1999117311312010511729
- SathyanKMNalinakumariKRKannanSH-Ras mutation modulates the expression of major cell cycle regulatory proteins and disease prognosis in oral carcinomaMod Pathol200720111141114817767136
- SeverinoPBrüggemannHAndreghettoFMMicroRNA expression profile in head and neck cancer: HOX-cluster embedded microRNA-196a and microRNA-10b dysregulation implicated in cell proliferationBMC Cancer20131353324209638
- PriorIALewisPDMattosCA comprehensive survey of Ras mutations in cancerCancer Res201272102457246722589270
- DasNMajumderJDasGuptaUBRas gene mutations in oral cancer in eastern IndiaOral Oncol2000361768010889924
- ChangSEBhatiaPJohnsonNWRas mutations in United Kingdom examples of oral malignancies are infrequentInt J Cancer19914834094122040536
- XuJGimenez-ContiIBCunninghamJEAlterations of p53, cyclin D1, Rb, and H-Ras in human oral carcinomas related to tobacco useCancer19988322042129669801
- SunDYuFMaYMicroRNA-31 activates the RAS pathway and functions as an oncogenic microRNA in human colorectal cancer by repressing RAS p21 GTPase activating protein 1 (RASA1)J Biol Chem2013288139508951823322774
- SharmaSBLinCCFarrugiaMKMicroRNAs 206 and 21 cooperate to promote RAS-extracellular signal-regulated kinase signaling by suppressing the translation of RASA1 and SPRED1Mol Cell Biol201434224143416425202123
- GuttillaIKWhiteBACoordinate regulation of FOXO1 by miR-27a, miR-96, and miR-182 in breast cancer cellsJ Biol Chem200928435232042321619574223
- LiPShengCHuangLMiR-183/-96/-182 cluster is up-regulated in most breast cancers and increases cell proliferation and migrationBreast Cancer Res201416647325394902
- RoaWBrunetBGuoLIdentification of a new microRNA expression profile as a potential cancer screening toolClin Invest Med2010332E12420370992
- ChoWCChowASAuJSRestoration of tumour suppressor hsa-miR-145 inhibits cancer cell growth in lung adenocarcinoma patients with epidermal growth factor receptor mutationEur J Cancer200945122197220619493678
- SeguraMFHannifordDMenendezSAberrant miR-182 expression promotes melanoma metastasis by repressing FOXO3 and microphthalmia-associated transcription factorProc Natl Acad Sci U S A200910661814181919188590
- JiangLMaoPSongLmiR-182 as a prognostic marker for glioma progression and patient survivalAm J Pathol20101771293820472885
- LiuZLiuJSeguraMFMiR-182 overexpression in tumourigenesis of high-grade serous ovarian carcinomaJ Pathol2012228220421522322863
- LiuHDuLWenZUp-regulation of miR-182 expression in colorectal cancer tissues and its prognostic valueInt J Colorectal Dis201328569770323474644
- HirataHUenoKShahryariVMicroRNA-182-5p promotes cell invasion and proliferation by down regulating FOXF2, RECK and MTSS1 genes in human prostate cancerPLoS One201381e5550223383207
- WeeraratneSDAmaniVTeiderNPleiotropic effects of miR-183~96~182 converge to regulate cell survival, proliferation and migration in medulloblastomaActa Neuropathol2012123453955222402744
- LarramendyMLTarkkanenMBlomqvistCComparative genomic hybridization of malignant fibrous histiocytoma reveals a novel prognostic markerAm J Pathol19971514115311619327749
- ChiangCHHouMFHungWCUp-regulation of miR-182 by β-catenin in breast cancer increases tumorigenicity and invasiveness by targeting the matrix metalloproteinase inhibitor RECKBiochim Biophys Acta2013183043067307623333633
- PengXLiWYuanLMehtaRGKopelovichLMcCormickDLInhibition of proliferation and induction of autophagy by atorvastatin in PC3 prostate cancer cells correlate with downregulation of Bcl2 and upregulation of miR-182 and p21PLoS One201388e7044223936432
- RasheedSATeoCRBeillardEJVoorhoevePMCaseyPJMicroRNA-182 and microRNA-200a control G-protein subunit α-13 (GNA13) expression and cell invasion synergistically in prostate cancer cellsJ Biol Chem2013288117986799523329838
- WinstonJTCoatsSRWangYZPledgerWJRegulation of the cell cycle machinery by oncogenic RasOncogene19961211271348552383
- SachdevaMMitoJKLeeCLMicroRNA-182 drives metastasis of primary sarcomas by targeting multiple genesJ Clin Invest2014124104305431925180607