
Abstract
Background
The grading of pancreatic neuroendocrine neoplasms (PanNENs) is associated with the choice of treatment strategy. The aim of this study is to identify the magnetic resonance imaging (MRI) features in differentiating pancreatic neuroendocrine tumors (PanNETs) grade 1/2 (G1/G2) and pancreatic neuroendocrine carcinoma grade 3 (PanNEC G3).
Patients and methods
A total of 59 patients with histologically proven PanNENs and who underwent pretreatment MRI were retrospectively analyzed. Tumor location, size, boundary, cystic or solid appearance, enhancement degree, pancreatic duct dilatation, metastases and MRI signal were evaluated. Apparent diffusion coefficients (ADCs) were measured on ADC maps. Receiver operating characteristic curve was used to determine the cut off values and the sensitivity and specificity of prediction. Spearman correlation and logistic regression analysis were adopted to identify the association between MRI features and pathological parameters.
Results
A total of 47 lesions were PanNETs G1/G2 and 12 lesions were PanNEC G3. G1/G2 tumors were more common with well-circumscribed border compared with PanNEC G3. Ill- defined boundary, big size, necrosis, low-moderate enhancement, pancreatic duct dilatation, metastases and high diffusion-weighted imaging (DWI) intensity were more common in PanNEC G3 than in PanNETs G1/G2. The ADC values of PanNEC G3 were also significantly lower compared with the PanNETs G1/G2 and normal pancreatic parenchyma. The cut off value of ADC was 0.95×10⁻³ mm2/s for differentiating PanNEC G3 from PanNETs G1/G2 with 72.3% sensitivity and 91.6% specificity, respectively. Ki-67 index and mitosis count positively correlated with tumor size, pancreatic duct dilatation and metastases (P<0.05) and negatively correlated with ADC values (P<0.01), respectively. Regression analysis further showed that metastases and ADC value were associated with PanNENs grade.
Conclusion
Metastases and ADC value may have potential for differentiating PanNEC G3 from PanNETs G1/G2.
Introduction
Neuroendocrine neoplasms (NENs) are tumors that arise from neuroendocrine cells of various locations.Citation1 They commonly affect the gastrointestinal tract. They also occur in the pancreas and lung. Pancreatic NENs (PanNENs) are rare and correspond to 1%–2% of all pancreatic neoplasms.Citation2 Many PanNENs are benign neoplasms, while some are malignant.Citation3,Citation4 Treatment strategy and prognosis closely depend on the tumor differentiation and clinical symptoms.
In 2010, the updated WHO classification for PanNENs divided NENs into grade 1 (G1), grade 2 (G2) and pancreatic neuroendocrine carcinoma G3 (PanNEC G3) based on the histological differentiation, including mitotic count and the Ki-67 proliferation index.Citation5 The biological behaviors of PanNENs are closely related to the pathological grades.Citation6 In the updated WHO classification, all PanNENs are regarded as potentially malignant tumors. The grading of PanNENs is associated with the choice of treatment strategy. Surgical resection is usually adopted for G1/G2 pancreatic neuroendocrine tumors (PanNETs G1/G2) without local invasion and extensive metastases. Chemotherapy or radiotherapy is usually adopted for PanNEC G3 besides surgical resection.Citation7 In addition, targeted therapy with everolimus (10 mg/d) or sunitinib (37.5 mg/d) is also valuable for PanNETs G1/G2.Citation8,Citation9 Though many imaging modalities could detect PanNENs,Citation10 including endoscopic ultrasound, computed tomography (CT), magnetic resonance imaging (MRI) and positron emission tomography (PET)/CT, the surgeons do not know the histological grades until the tumor has been resected has undergone biopsy.Citation11 The pretreatment prediction of PanNENs grade is important in determining treatment strategy.Citation12
Several studies have shown that imaging techniques, such as contrast-enhanced CTCitation13 and FDG-PET,Citation14 may have great potential for differentiating PanNETs (G1/G2) from PanNEC G3. Recently, a large series study (including 154 PanNETs G1/G2 and 13 PanNEC G3)Citation6 showed that CT features, such as portal enhancement ratio, can differentiate PanNEC G3 from PanNETs G1/G2. Several studies also showed that MRI was useful for preoperative grading of PanNENs.Citation15,Citation16 Diffusion-weighted imaging (DWI) is a functional modality that uses the diffusion of water molecules to generate contrast MR images.Citation17 Based on the difference in proliferation ability among PanNETs G1, G2 and PanNEC G3, DWI has been used for differentiating PanNETs G1 from G2Citation15,Citation16 or non-benign from benign PanNENs.Citation3 A study also showed that DWI could differentiate PanNETs from PanNEC.Citation16 However, the PanNENs were classified as per the 2000 WHO classification report in that study. A recent study showed the MRI features, including DWI, for grading PanNENs based on a large population size (108 PanNETs, 11 PanNEC G3).Citation18 However, the sample sizes of PanNEC G3 in the previous studies were small (n≤ 11) because of the low incidence of PanNEC, and further MRI studies are needed to confirm the previous findings.
In this study, we show the MRI features of PanNETs G1/G2 and PanNEC G3 based on a relatively large series population. In addition, we investigate the value of DWI in differentiating PanNEC G3 from PanNETs G1/G2 and show the relationships between histopathological characteristics and MRI findings.
Patients and methods
Patient selection
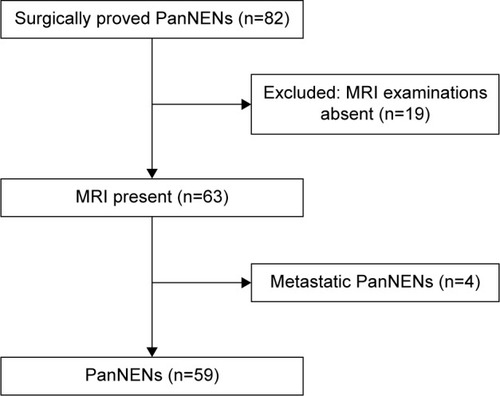
This retrospective study was approved by the institutional review board of the First Affiliated Hospital, College of Medicine Zhejiang University. The requirement of the formal consent for patient data review was waived because this was a retrospective study. From February 2012 to March 2016, we identified 82 patients with surgically proven PanNENs in our hospital’s data warehouse. The following criteria were used for patients’ inclusion: 1) patients with surgically proven PanNENs; 2) patients who underwent preoperative MRI; 3) patients who did not undergo chemotherapy or local treatments before surgery, and 4) patients with primary PanNENs. A total of 23 patients were excluded because of the absence of MRI data (n=19) and metastatic PanNENs (n=4). Finally, a total of 59 patients were included in this study (). According to the WHO 2010 classification for NENs,Citation7 the PanNENs were divided into PanNET G1, PanNET G2 and PanNEC G3 in this study.
Figure 1 Flow diagram of the study patients with PanNETs.
MRI examinations
All MRI examinations were performed in 3.0 or 1.5 T superconducting system (Signa HDx 3.0 T; GE Medical Systems, Milwaukee, WI, USA, n=36 or Achieva 1.5 T; Philips, Best, the Netherlands, n=23) using an eight-channel or 16 eight- channel phased-array torso coils. Patients fasted for 8 h prior to MR examination. All scans were performed in the head-first supine position. Conventional axial and coronal T1 -weighted fast spin echo imaging sequence (TR(repetitiontime)/TE(echedelaytime): 3.1/1.5 ms [3.0 T] or 4.6/2.2 ms [1.5 T], with 4–5 mm slice thickness, 1–2 mm interslice gap, 256×256 [1.5 T]−384×256 [3.0 T] matrix and 24–32 cm field-of-view), a single shot fast spin echo T2-weighted sequence (TR/TE: 6,000–8,000/80–90 ms, 3.0 T; 1,000/80 ms, 1.5 T) with 4–5 mm slice thickness, 1–2 mm interslice gap, 384×256 or 256×256 matrix and 24–32 cm field-of-view were performed for each patient. The axial DWI was performed using the respiratory-triggered single shot echo-planar sequence (TR/TE: 6,000–8,000/60–70 ms [3.0 T] or 4,000/60 ms [1.5 T], with 4–5 mm slice thickness, 1 mm interslice gap, 256×256 matrix, 24–32 cm field-of-view) with b values of 0 and 1,000 s/mm2. Gadopentetate dimeglumine (Magnevist; Bayer HealthCare Pharmaceuticals, Berlin, Germany) was administered at a dose of 0.1 mmol per kilogram (2.5 mL/s) followed by a 20 mL saline flush, and then axial and coronal T1 images were obtained using sequence as mentioned earlier.
MRI analysis
Two abdominal radiologists with >8 years of experience in abdominal MRI reading who were blinded to pathological findings analyzed the images. All images were reviewed on a picture archiving communication system (PACS) and extended to an MR workstation for quantitative analysis. The imaging information included the tumor position (head-neck or body-tail), size, tumor margin (well-circumscribed or ill- defined border), the presence of cystic components (solid or cystic-solid), and presence or absence of enhancement, enhancement degree, T1 and T2 signal intensity and signal on DWI. The presence of pancreatic duct dilatation and metastases (lymph node, local invasion or distal metastases) was also reviewed. Mortelé et alCitation19 showed that the diameter of pancreatic duct ranged from 1.5 to 3.5 mm. Considering the increase in diameter in old persons, pancreatic duct dilatation was considered if the main pancreatic duct diameter was ≥4 mm. Cystic lesions of the tumor were identified as areas that were hypointense on precontrast T1-weighted, markedly hyperintense on T2-weighted images, and with nonenhancing.
Based on the DWI with b values of 0 and 1,000 s/mm2, apparent diffusion coefficient (ADC) maps could be obtained at workstation. ADC values of both the tumor and the normal pancreatic parenchyma were measured by another reviewer (QDW). To obtain the ADC values of tumors, a region of interest (ROI) was manually drawn as large as possible in an image where the tumor was at its maximum dimension, while avoiding the most peripheral portions that might cause partial volume effects of adjacent extralesional tissues. Necrotic or cystic components in the lesions were avoided by referring to T2-weighted images. For the normal pancreatic parenchyma, a similar ROI was drawn avoiding the main duct. The ADC values were measured at least three times, and then the mean data were finally analyzed.
Histological analysis
The tumor specimens were fixed with formalin, embedded in paraffin, sliced with a microtome and then the sections were stained with hematoxylin and eosin (H&E), and immunohistochemical analysis was done. The PanNENs were classified as PanNET G1, NET G2 and PanNEC G3 according to the WHO 2010 classification for neuroendocrine tumors by counting the number of mitoses (per 10 high-power fields [HPF]) and Ki-67 proliferation index (percentage of positive cells in areas of highest nuclear labeling). NET G1: <2 mitoses per 10 HPF, Ki-67 ≤2%; NET G2: 2–20 mitoses per 10 HPF, Ki-67 index 3%–20%; PanNEC G3: >20 mitoses per 10 HPF, Ki-67 index >20%.
Statistical analysis
The data were managed using SPSS 16.0 (SPSS Inc, Chicago, IL, USA). Quantitative data were displayed as mean ± SD and were analyzed by independent sample t-test or one-way analysis of variance (ANOVA). Qualitative data were shown as percentage and were analyzed using the Chi-square test or Fisher’s exact Chi-square test. Spearman rank test was adopted to assess the correlation between MRI findings and histopathological variables. Receiver operating characteristic (ROC) curve was adopted to determine the cut off values and the sensitivity and specificity of prediction using MedCalc software (MedCalc, Mariakerke, Belgium). The diagnostic odds ratios (ORs) of MRI findings (size, pancreatic duct dilatation, ADC and metastases) were estimated using logistic regression models. P-values <0.05 were considered statistically significant.
Results
Patients’ characteristics
The characteristics of the patients, ie, age, sex and clinical symptoms, are summarized in . The age range was from 25 to 76 years (mean 54.2±10.8). Thirty (61.4%) patients were male. Twenty-one (38.6%) patients were asymptomatic. Abdominal pain, confusion of consciousness or dizziness and hypodynamia were observed in 18, 9 and 5 patients, respectively. PanNETs G1/G2 were observed in 47 patients (77.3%) and PanNEC G3 was observed in 12 patients (22.7%). Thirty-four lesions were located in pancreatic head-neck and 25 lesions occurred in body-tail. There was no significant difference in age, tumor location and clinical symptoms (does not include abdominal pain) between PanNETs G1/G2 and PanNEC G3. However, significant differences in sex (P<0.05) and abdominal pain (P<0.001) were found between PanNETs G1/G2 and PanNEC G3.
Table 1 Clinical data of patients
MRI findings
MRI findings of PanNENs are summarized in . There were no significant differences in TIWI/T2WI signal intensity and enhancement heterogeneity between PanNETs G1/G2 and PanNEC G3. Significant differences were found in tumor boundary, size, solid and cystic pattern, enhancement degree, pancreatic duct dilatation, metastases and DWI intensity between G1/G2 and PanNEC G3. Ill-defined boundary, big size, necrosis, pancreatic duct dilatation, metastases and high DWI intensity were more common in PanNEC G3 compared with PanNETs G1/G2. The T1-, T2-weighted images, DWI, ADC map and gadolinium-enhanced images of PanNETs G1/G2 and PanNEC G3 are shown in –. In addition, shows that the mean ADC values of PanNETs are statistically lower than normal pancreas parenchyma (1.34±0.11×10⁻³ mm2/s; P<0.05). In addition, the ADC values of PanNEC G3 (0.85±0.23×10⁻³ mm2/s) were also significantly lower compared with the G1/G2 tumors (1.09±0.13×10⁻³ mm2/s).
Figure 2 A 65-year-old female with a pathologically proven, grade 1 neuroendocrine tumor in the pancreatic head.
Abbreviation: ADC, apparent diffusion coefficient.
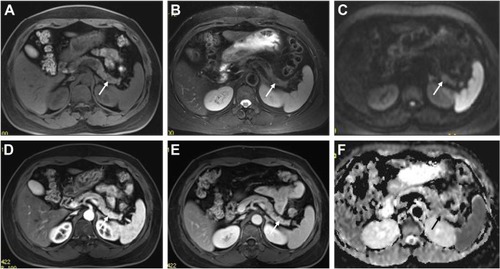
Figure 3 A 48-year-old male with a pathologically proven, grade 2 neuroendocrine tumor in the pancreatic tail.
Abbreviation: ADC, apparent diffusion coefficient.
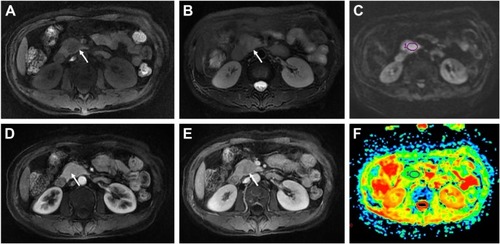
Figure 4 A 32-year-old male with a pathologically proven, grade 3 neuroendocrine carcinoma in the pancreatic head.
Abbreviation: ADC, apparent diffusion coefficient.
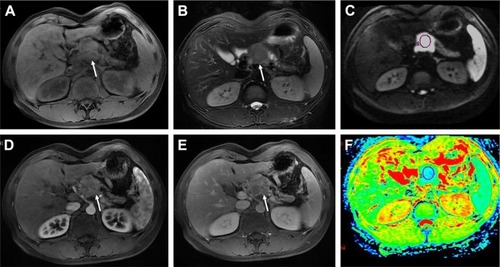
Figure 5 ADC values of normal pancreatic parenchyma, PanNETs G1/G2 and PanNEC G3.
Abbreviations: ADC, apparent diffusion coefficient; PanNETs G1/G2, grade 1/2 pancreatic neuroendocrine tumors; PanNEC G3, pancreatic neuroendocrine carcinoma G3.
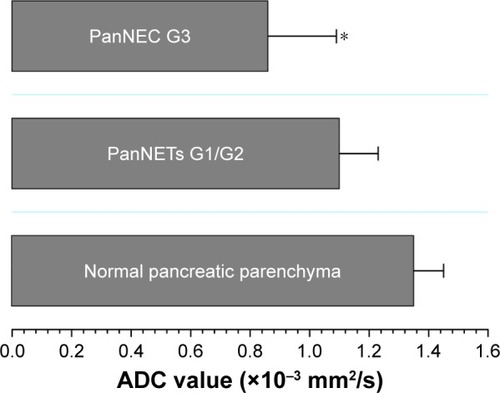
Table 2 The summary of MRI findings
Specificity and sensitivity of MR findings
ROC curves were used to determine the cut off values of ADC in differentiating the PanNETs G1/G2 from PanNEC G3 (). The area under the curve was 0.90. The cut off value was 0.950×10⁻³ mm2/s with 72.3% sensitivity and 91.6% specificity for predicting PanNETs G1/G2 tumors. In addition, we also analyzed the sensitivity and specificity of tumor sizes, pancreatic duct dilatation and metastases for differentiating the PanNETs G1/G2 from PanNEC G3 ( and ). Pancreatic duct dilatation and metastases both showed sensitivity of 91.5%. However, they showed low specificity of 33.3% and 50.0%, respectively. Tumor sizes showed sensitivity of 60.5% and specificity of 100%.
Figure 6 ROC curves of the mean ADC value and tumor size for differentiating PanNETs G1/G2 from PanNEC G3.
Abbreviations: ROC, receiver operating characteristic; ADC, apparent diffusion coefficient; PanNETs, pancreatic neuroendocrine tumors; PanNEC G3, pancreatic neuroendocrine carcinoma G3.
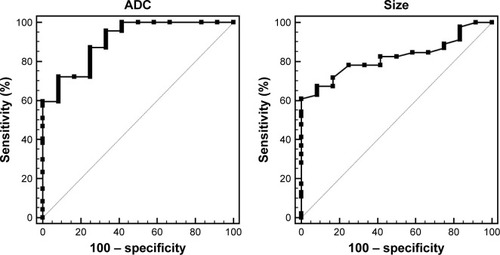
Table 3 Sensitivity and specificity of MR findings and ADC value for differentiating grade 3 from grade 1/2 pancreatic neuroendocrine tumors
Correlation and regression analysis
Subsequently, we observed the correlation between MRI findings and histological features (). The data showed that negative correlations were found between ADC values and Ki-67 proliferation index (r=−0.409, P<0.01) and mitosis count (r=−0.465, P<0.01). Ki-67 index and mitosis were positively correlated with pancreatic duct dilatation (P<0.01), metastases (P<0.01) and tumor size (P<0.01). Tumor size was also positively correlated with pancreatic duct dilatation (r=0.627, P<0.01) and metastases (r=0.340, P<0.05).
Table 4 Correlation analysis between MRI findings and histological features
Logistic regression analysis further showed that pancreatic duct dilatation (P=0.06), metastases (P=0.03) and low ADC value (OR =31.7, 95% CI: 2.06–487.8) were more common in PanNEC G3 compared with PanNETs G1/G2 ().
Table 5 ORs for the associations between MRI findings and PanNEN grade (G3 vs GI/G2)
Discussion
PanNENs are divided into PanNET s G1, G2 and PanNEC G3 according to the updated WHO 2010 classification of tumor. The histological grades are related to the biological behavior and the treatment strategy. The preoperative determination of tumor grade is helpful for the appropriate treatment planning. Imaging techniques have been used to grade PanNENs, such as contrast-enhanced CT and PET/CT.Citation13,Citation14,Citation20 However, only a few studies differentiate PanNETs G1/G2 from PanNEC G3 using MRI,Citation16,Citation18 especially based on the WHO 2010 classification and large number of PanNEC G3. In this study, we compared the MRI features of PanNETs G1/G2 and PanNEC G3 and showed that tumor size, pancreatic duct dilatation, metastases and DWI may have great potential for discriminating PanNETs G1/G2 from PanNEC G3. In addition, our data also showed that ADC values were correlated with Ki-67 proliferation index and mitosis count.
The treatment strategy for PanNENs is related to the histological grade.Citation5,Citation21 Surgical resection is usually used for resectable PanNETs G1/G2. Targeted therapy with everolimus or sunitinib is also valuable for PanNETs G1/G2.Citation8,Citation9 For PanNEC G3, besides surgical resection, platinum-based chemotherapy is recommended as the standard treatment.Citation7,Citation22 In addition, the prognosis of PanNEC is much poorer than for the PanNETs G1/G2.Citation23 The preoperative discrimination between PanNETs G1/G2 and PanNEC G3 is important for the surgeons.Citation21 PanNENs are usually hypervascular tumors. Therefore, dynamic contrast-enhanced CT or MRI was used to discriminate between presumably benign and malignant PanNENs.Citation3,Citation6,Citation13 There were differences in contrast enhancement patternCitation13 and portal enhancement ratioCitation6 between PanNETs G1/G2 and PanNEC G3. Kim et alCitation15 also showed that there was difference in the MR contrast enhancement pattern between PanNET G1 and PanNEC G3. A study also showed that MRI perfusion was applicable to differentiate G1/G2 from G3.Citation24 The maximum standardized uptake value of PanNEC G3 was significantly higher than that of PanNETs G1/G2, which suggested that FDG-PET is useful for differentiating PanNEC G3 from PanNETs G1/G2.Citation14 In addition, recent studies showed that the metabolic tumor volume and total lesion glycolysis of PanNET G2 were higher than those of PanNET G1 using 18F-FDG PET/CT.Citation25 However, no PanNEC G3 was included in their study. Both the studies of Kim et alCitation6,Citation15 found that there was no difference in pancreatic duct dilatation between PanNET G1 and PanNEC G3, which was not consistent with our data. We speculate that this may be due to the small number of PanNEC cases in their study or to the low sensitivity of detection in pancreatic duct dilatation on CT. A recent study showed that pancreatic duct dilatation was more common in PanNEC compared with PanNETs G1/G2 (36% vs 17.5%) based on MR images.Citation18 Though all PanNENs are regarded as potentially malignant tumors, the risk of metastases of PanNEC G3 is higher than the PanNETs G1/G2.Citation18,Citation21 In the present study, we also showed that there was a significant difference in the metastases between PanNEC G3 and PanNETs G1/G2, which was consistent with the previous data.Citation21
It has been shown that PanNEC is larger, with a mean diameter of 5.8 cmCitation26 or 5.6 cm,Citation6 compared with PanNETs. In the present study, the mean diameter (5.3 cm) of PanNEC G3 was close to the previous reports. Bettini et alCitation27 showed that Ki-67 index was significantly correlated with tumor size. In our study, we also found that tumor size was significantly correlated with Ki-67 index and mitoses count, which was consistent with the gastroenteropancreatic NEN.Citation28 In addition, our data also demonstrated that tumor size was associated with pancreatic dilatation, metastases and ADC values, which suggested that tumor size was also related to the malignant behavior.
In the present study, 40% of PanNEC G3 shows ill- defined boundary, which was consistent with the previous report.Citation15 However, Kim et alCitation6 showed that only 15% PanNEC G3 showed poorly defined margin in conventional CT. We speculate that MRI may have more advantages in delineating the border than CT. In addition, we also found that there was a difference in tumor components between PanNETs G1/G2 and PanNEC G3. A total of 58% PanNEC G3 showed cystic components in our study, which was in accordance with the previous study (61.5%).Citation6 However, the cause of cystic degeneration in PanNENs is not clarified.Citation6
DWI has been widely used for differentiating malignant lesions from benign lesions. DWI can detect water molecular motion.Citation29 Denser cellularity and extracellular space tortuosity can impact water diffusion and are recognized as the reasons for the decrease in ADC value in malignant tumors.Citation29,Citation30 Previous study showed that DWI + T2WI could improve the detection of PanNENs.Citation31 DWI may have advantages in detecting small PanNENsCitation31,Citation32 due to its high contrast resolution. The PanNEC G3 cells show high proliferative activity with Ki-67 index >20% and mitoses >20%. Therefore, the cell density of PanNECs is higher than that of PanNETs G1/G2. The water molecular motion in PanNEC G3 should be markedly restricted compared with PanNETs G1/G2. However, only a few studies assessed PanNENs using DWI.Citation3,Citation16 A recent study showed the value of DWI-MRI for grading PanNENs based on a large population size (number of PanNEC G3 = 11).Citation18 In that study, they showed that the ADC values were significantly decreased as grade increased. Because of the low incidence of PanNEC G3, additional studies are needed to confirm the previous findings. In the present study, PanNEC G3 showed significantly lower ADC values compared with PanNETs G1/G2. DWI, in particular to ADC, has great potential for discriminating PanNEC G3 from PanNET s G1/G2. Our data further confirm that the ADC value is associated with grade of the PanNENs. Furthermore, we also showed that the risk of PanNEC G3 was much higher in those PanNENs patients with pancreatic duct dilatation, metastases and low ADC value.
Based on the WHO 2010 classification of NENs, Ki-67 index and mitosis count are recognized as the critical pathological parameters.Citation5 The PanNENs are divided into G1 (mitotic count <2 per 10 HPF and/or Ki-67 index ≤2%), G2 (mitotic count 2-20 per 10 HPF and/or Ki-67 index 3%–20%) and PanNEC G3 (mitotic count >20 per 10 HPF and/or Ki-67 index >20%). Our study also shows that tumor size, metastases and ADC value are significantly correlated with mitosis count and Ki-67 proliferation index. Previous study also showed that ADC value was negatively correlated with Ki-67 index.Citation16 DWI-MRI cannot replace histological grading of PanNENs. However, the preoperative evaluation via ADC values or MRI features is useful in treatment planning.
This study also has several potential limitations. First, because of the rarity of NENs, the number of patients was relatively small, especially for PanNEC G3, which might have impact on statistical power. Further studies with larger sample sizes are required. Second, because previous studies have shown that contrast-enhanced CT or MRI have great potential for differentiating PanNEC G3 from PanNETs G1/G2, the value of the enhancement pattern of MRI is only simply evaluated in this study. Third, because the results of ROC and regression analysis are related to the size of population, our data should be validated by future studies. In addition, even though it has been shown that there are no significant differences in ADC values of pancreas between MR systems from different vendors and between different field strengths,Citation33 MR scanners and field strengths may have little impact on ADC determination. Finally, selection bias may exist because this is a retrospective study.
Conclusion
PanNEC G3 has characteristic MRI features. Our data demonstrate that there are differences in tumor size, ADC values and risk of metastases between PanNEC G3 and PanNETs G1/G2. DWI-MRI, in particular to ADC, has great potential for discriminating PanNEC G3 from PanNETs G1/G2. In addition, ADC value is also correlated with the pathological parameters (mitosis count and Ki-67 index).
Disclosure
The authors report no conflicts of interest in this work.
References
- DeneckeTBaurADIhmCEvaluation of radiological prognostic factors of hepatic metastases in patients with non-functional pancreatic neuroendocrine tumorsEur J Radiol20138210e550e55523891296
- WangYMillerFHChenZEDiffusion-weighted MR imaging of solid and cystic lesions of the pancreasRadiographics2011313E47E6421721197
- JangKMKimSHLeeSJChoiDThe value of gadoxetic acid- enhanced and diffusion-weighted MRI for prediction of grading of pancreatic neuroendocrine tumorsActa Radiol201455214014823897307
- ItoTSasanoHTanakaMEpidemiological study of gastroen- teropancreatic neuroendocrine tumors in JapanJ Gastroenterol201045223424320058030
- KlimstraDSArnoldRCapellaCNeuroendocrine neoplasms of the pancreasBosmanFTCarneiroFHrubanRHTheiseNDWHO Classification of Tumours of the Digestive SystemLyonInternational Agency for Research on Cancer (IARC)2010322326
- KimDWKimHJKimKWNeuroendocrine neoplasms of the pancreas at dynamic enhanced CT: comparison between grade 3 neuroendocrine carcinoma and grade 1/2 neuroendocrine tumourEur Radiol20152551375138325465713
- KulkeMShahMHBensonABNCCN clinical practice guidelines in oncology (NCCN Guidelines1) neuroendocrine tumors. Version 22014
- YaoJCShahMHItoTRAD001 in Advanced Neuroendocrine Tumors, Third Trial (RADIANT-3) Study GroupEverolimus for advanced pancreatic neuroendocrine tumorsN Engl J Med2011364651452321306238
- RaymondEDahanLRaoulJLSunitinib malate for the treatment of pancreatic neuroendocrine tumorsN Engl J Med2011364650151321306237
- KartalisNMucelliRMSundinARecent developments in imaging of pancreatic neuroendocrine tumorsAnn Gastroenterol201528219320225830417
- RindiGWiedenmannBNeuroendocrine neoplasms of gut and pancreas: new insightsNat Rev Endocrinol2012815464
- TakumiKFukukuraYHigashiMPancreatic neuroendocrine tumors: correlation between the contrast-enhanced computed tomography features and the pathological tumor gradeEur J Radiol20158481436144326022520
- CappelliCBoggiUMazzeoSContrast enhancement pattern on multidetector CT predicts malignancy in pancreatic endocrine tumoursEur Radiol201525375175925447971
- TomimaruYEguchiHTatsumiMClinical utility of 2-[(18)F] fluoro-2-deoxy-D-glucose positron emission tomography in predicting World Health Organization grade in pancreatic neuroendocrine tumorsSurgery2015157226927625311263
- KimJHEunHWKimYJHanJKChoiBIStaging accuracy of MR for pancreatic neuroendocrine tumor and imaging findings according to the tumor gradeAbdom Imaging20133851106111423728305
- WangYChenZEYaghmaiVDiffusion-weighted MR imaging in pancreatic endocrine tumors correlated with histopathologic characteristicsJ Magn Reson Imaging20113351071107921509863
- HagmannPJonassonLMaederPThiranJPWedeenVJMeuliRUnderstanding diffusion MR imaging techniques: from scalar diffusion- weighted imaging to diffusion tensor imaging and beyondRadiographics200626suppl 1S205S22317050517
- LotfalizadehERonotMWagnerMPrediction of pancreatic neuroendocrine tumour grade with MR imaging features: added value of diffusion-weighted imagingEur Radiol Epub2016819
- MorteléKJRochaTCStreeterJLTaylorAJMultimodality imaging of pancreatic and biliary congenital anomaliesRadiographics200626371573116702450
- SadowskiSMNeychevVMilloCProspective Study of 68Ga- DOTATATE positron emission tomography/computed tomography for detecting gastro-enteropancreatic neuroendocrine tumors and unknown primary sitesJ Clin Oncol201634658859626712231
- ItoTHijiokaSMasuiTAdvances in the diagnosis and treatment of pancreatic neuroendocrine neoplasms in JapanJ Gastroenterol201752191827539256
- IkedaMOkuyamaHTakahashiHChemotherapy for advanced poorly differentiated pancreatic neuroendocrine carcinomaJ Hepatobiliary Pancreat Sci201522862362725755102
- Velayoudom-CephiseFLDuvillardPFoucanLAre G3 ENETS neuroendocrine neoplasms heterogeneous?EndocrRelat Cancer2013205649657
- KimJHLeeJMParkJHSolid pancreatic lesions: characterization by using timing bolus dynamic contrast-enhanced MR imaging assessment - a preliminary studyRadiology2013266118519623192779
- SatohKSadowskiSMDieckmannW18F-FDG PET/CT volumetric parameters are associated with tumor grade and metastasis in pancreatic neuroendocrine tumors in von Hippel-Lindau diseaseAnn Surg Oncol201623suppl 571472127638678
- IchikawaTFederleMOhbaSAtypical exocrine and endocrine pancreatic tumors (anaplastic, small cell, and giant cell types): CT and pathologic features in 14 patientsAbdom Imaging200025440941910926196
- BettiniRPartelliSBoninsegnaLTumor size correlates with malignancy in nonfunctioning pancreatic endocrine tumorSurgery20111501758221683859
- ChoMYSohnJHJinSYProposal for a standardized pathology report of gastroenteropancreatic neuroendocrine tumors: prognostic significance of pathological parameters. Gastrointestinal Pathology Study Group of Korean Society of PathologistsKorean J Pathol201347322723723837015
- PadhaniARLiuGKohDMDiffusion-weighted magnetic resonance imaging as a cancer biomarker: consensus and recommendationsNeoplasia200911210212519186405
- HiganoSYunXKumabeTMalignant astrocytic tumors: clinical importance of apparent diffusion coefficient in prediction of grade and prognosisRadiology2006241383984617032910
- BrennerRMetensTBaliMDemetterPMatosCPancreatic neuroendocrine tumor: added value of fusion of T2-weighted imaging and high b-value diffusion-weighted imaging for tumor detectionEur J Radiol2012815e746e74922386133
- CaramellaCDromainCDe BaereTEndocrine pancreatic tumours: which are the most useful MRI sequences?Eur Radiol201020112618262720668861
- DonatiOFChongDNanzDDiffusion-weighted MR imaging of upper abdominal organs: field strength and intervendor variability of apparent diffusion coefficientsRadiology2014270245446324471390