
Abstract
Background
Molecular analysis is a promising source of clinically useful prognostic biomarkers. The aim of this investigation was to identify prognostic biomarkers for patients with early-stage pancreatic ductal adenocarcinoma (PDAC) after pancreaticoduodenectomy.
Methods
An RNA sequencing dataset of PDAC was obtained from The Cancer Genome Atlas. Survival analysis and weighted gene co-expression network analysis were used to investigate the prognostic markers of early-stage PDAC after pancreaticoduodenectomy.
Results
Using whole genome expression level screening, we identified 1,238 markers that were related to the prognosis of PDAC after pancreaticoduodenectomy, and identified 9 hub genes (ARHGAP30, HCLS1, CD96, FAM78A, ARHGAP15, SLA2, CD247, GVINP1, and IL16) using the weighted gene co-expression network analysis approach. We also constructed a signature comprising the 9 hub genes and weighted by the regression coefficient derived from a multivariate Cox proportional hazards regression model to divide patients into a high-risk group, with increased risk of death, and a low-risk group, with significantly improved overall survival (adjusted P=0.026, adjusted HR =0.513, 95% CI =0.285–0.924). The prognostic signature of the 9 genes demonstrated good performance for predicting 1-year overall survival (area under the respective receiver operating characteristic curves =0.641).
Conclusion
Our results have provided a new prospect for prognostic biomarkers of PDAC after pancreaticoduodenectomy, and may have a value in clinical application.
Introduction
Pancreatic cancer is a highly lethal malignant tumor. The major histological type of pancreatic cancer is pancreatic ductal adenocarcinoma (PDAC) accounting for >80% of total cases.Citation1–Citation3 The Chinese National Cancer Center estimated that in 2015, about 90,100 Chinese would be newly diagnosed with pancreatic cancer and 79,400 would die of the disease, with mortality rates showing a rising trend in the Chinese male population.Citation4 The age-standardized 5-year survival rate in patients with pancreatic cancer remains as low as 11.7% in China.Citation5 However, pancreatic cancer is also one of the most aggressive malignancies with an estimated overall 5-year survival rate of <7%, and the fourth leading cause of cancer death in the USA.Citation6 The high mortality rate can be attributed to multiple factors, the most important factor of which is that most patients with pancreatic cancer are often diagnosed at the advanced stage and cannot undergo surgery.Citation7,Citation8 Even after potentially curative resection, most patients will eventually have a recurrence. Because of the growing incidence, late diagnosis, and insufficient treatment options, it is necessary to investigate early diagnostic and prognostic markers of pancreatic cancer and apply them in treatment guidance and patient management.
Treatment of pancreatic cancer includes surgical resection, chemotherapy, radiation therapy, and palliative care. Indeed, surgery is the only option to permanently remove or cure pancreatic cancer, but only 15%–20% of patients are eligible for surgical resection at the time of initial diagnosis. Radical surgical resection with adjuvant chemotherapy or chemo-radiotherapy is the most effective treatment for PDAC. Treatment options are selected depending on the stage of pancreatic cancer in a multidisciplinary approach.Citation7,Citation9 In addition, pancreaticoduodenectomy, also known as the Whipple procedure, has become a commonly performed operation with a low hospital mortality and has become an effective operation for pancreatic cancer in those patients that are node-negative with a negative tumor margin.Citation10
Previous studies have demonstrated that tumor size and histological grade, lymph node status, resection margins and vascular or neural invasion are the prognostic factors of pancreatic cancer.Citation11 Furthermore, a number of molecular markers have also been identified as potential prognostic markers for pancreatic cancer, and molecular analysis is a promising source of clinically useful prognostic biomarkers.Citation12 These could be involved in pancreatic tumor growth, apoptosis, angiogenesis, invasion, and resistance to chemotherapy.Citation12 The purpose of the present study was to investigate the prognostic markers for patients with early-stage PDAC after pancreaticoduodenectomy by using whole genome expression profile dataset. By searching the public expression profile database, we found that the dataset of pancreatic cancer in The Cancer Genome Atlas (TCGA) database could satisfy our study requirements.
Materials and methods
Data source and pre-processing
An RNA sequencing dataset of pancreatic cancer patients was obtained from TCGA (https://tcga-data.nci.nih.gov/), while the corresponding survival profiles and clinical features were obtained from the University of California Santa Cruz (UCSC) Xena (http://xena.ucsc.edu/). The raw dataset of RNA sequencing was normalized by the DESeq package in the R platform.Citation13
Inclusion and exclusion criteria
The inclusion criteria of study patients were as follows: 1) complete survival data available; 2) the histology type was PDAC, 3) American Joint Committee on Cancer (AJCC 7th) stage I or II; and 4) patients underwent pancreaticoduodenectomy. PDAC patients with stage III or IV disease and those who underwent other types of surgery were excluded.
Identification of prognosis-related genes
Survival analyses were conducted on patients with normalized mRNA expression and overall survival (OS) profiles. Patients were divided into low- and high-expression groups according to the gene expression median value. Multivariate Cox proportional hazards regression analysis was applied to estimate survival in the study sample by using the survival package in the R platform, and the low expression group was set as a reference group. An adjusted P-value cutoff of 0.05 was considered statistically significant and used to identify prognosis-related genes.
Weighted gene co-expression network analysis (WGCNA) and hub gene detection
WGCNA, an R package for weighted correlation network analysis,Citation14 was used for co-expression analysis of genes and for screening hub genes in the current study. An appropriate soft threshold power was selected in accordance with standard scale-free distribution, with which adjacencies between all input genes were calculated by a power function.Citation15 Based on the selected soft threshold power, and by using clustering in combination with the topological overlap matrix (TOM) in module detection analysis, we selected the number of genes in each module with a minimum threshold of 20, setting a cutoff height of 0.8. Then, the threshold of weighted co-expression correlation coefficient between 2 genes >0.4 was exported for hub gene screening and weighted co-expression network construction. The degree of a node was defined as the number of connections or edges the node has to other nodes in a network. The node degree represented the overall strength of connections between a given node and all of the other nodes in a network and was used for screening the hub genes.
Construction of prognostic model and receiver operating characteristic curve
Furthermore, we utilized the hub genes that were derived from the WGCNA analysis to construct a prognostic model. A prognosis risk score was established on the basis of a linear combination of gene expression level multiplied by a regression coefficient (β) as the weight that was derived from a multivariate Cox proportional hazards regression model, adjusted for the hub genes’ expression and clinical features, with the following formula: Risk score = expression of Gene1 × β1Gene1 + expression of Gene2 × β2Gene2 +… expression of Genen × βn Genen.Citation16,Citation17 The time-dependent receiver operating characteristic (ROC) curve analysis was performed by using the survival ROC package in the R platform to evaluate the predictive accuracy of our prognostic model for time-dependent cancer death.Citation18
Functional assessment
The Database for Annotation, Visualization and Integrated Discovery (DAVID; https://david.ncifcrf.gov/home.jsp) v6.8 is a comprehensive set of functional annotation tools to understand the biological meaning of specified genes.Citation19,Citation20 Gene ontology (GO) terms and Kyoto Encyclopedia of Genes and Genomes (KEGG) pathway enrichment analysis were carried out using DAVID. An enrichment P-value <0.05 was considered statistically significant.
Statistical analysis
A multivariate Cox proportional hazards regression model was used for calculating the clinical outcome between different gene expression groups. Hazard ratio (HR) and 95% CI were calculated from the multivariate Cox proportional hazards regression model after adjusting for pathologic stage, histologic grade, radical resection, radiation therapy and targeted molecular therapy. The heat map of genes was constructed using the ggplot2 package in the R platform. The weighted co-expression networks were constructed using the Cytoscape software (version 3.4.0; http://www.cytoscape.org/), a biomolecular interaction networks platform.Citation21 A value of P<0.05 was considered statistically significant. All statistical analyses were conducted with SPSS version 20.0 (IBM Corporation, Armonk, NY, USA) and R 3.3.0 (https://mirrors.tuna.tsinghua.edu.cn/CRAN/).
Results
Study population
An RNA sequencing dataset of 177 patients was downloaded from the TCGA, and the corresponding survival profiles were obtained from the UCSC Xena. By performing our inclusion and exclusion criteria, 112 early-stage PDAC patients that underwent pancreaticoduodenectomy were included in further analysis. Of these patients, only 8 were stage I, while the remaining were stage II. The histologic grade of PDAC was significantly associated with OS (log-rank P=0.034). There were 66 (59%) patients who received a radical resection and with a significantly long median survival time (MST: radical resection vs non-radical resection, 691 vs 473 days; log-rank P=0.009, ). Patients received radiation therapy (log-rank P=0.029, HR =0.527, 95% CI =0.293–0.947, ) and targeted molecular therapy (log-rank P<0.001, HR =0.168, 95% CI =0.095–0.296, ) had significantly decreased risk of death in PDAC, respectively.
Table 1 Correlation between OS and clinical features of PDAC patients
Prognosis-related genes screening
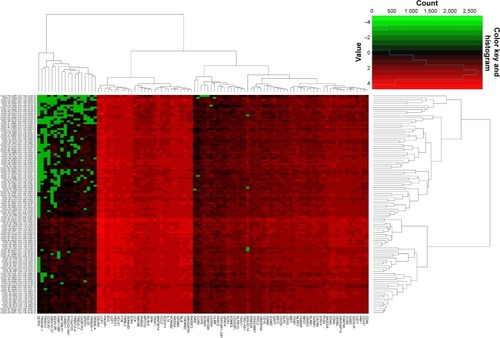
Early-stage PDAC patients (n=112) that underwent pancreaticoduodenectomy with complete follow-up data were included in further survival analyses. A multivariate Cox proportional hazards regression model after being adjusted for pathologic stage, histologic grade, radical resection, radiation therapy and targeted molecular therapy was performed using the survival package in R platform. A total of 1,238 genes with an adjusted P-value <0.05 were identified as prognosis-related genes for early-stage PDAC after pancreaticoduodenectomy (Table S1). The heat map of all prognosis-related genes is shown in Figure S1. Among these prognosis-related genes, several of them have already been identified as pancreatic cancer prognosis-related genes in previous studies, such as C-X-C motif chemokine receptor 4 (CXCR4, adjusted P=0.032, HR =0.523, 95% CI =0.289–0.947),Citation22–Citation24 XIAP-associated factor 1 (XAF1, adjusted P=0.048, HR =1.738, 95% CI =1.00–3.01),Citation25 interleukin 18 (IL18, adjusted P=0.036, HR =1.851, 95% CI =1.04–3.29),Citation26 and secreted protein acidic and cysteine rich (SPARC, adjusted P=0.012, HR =0.0487, 95% CI =0.277–0.855).Citation27–Citation30
Weighted gene co-expression network analysis
WGCNA was used for co-expression analysis and hub gene screening. The appropriate soft threshold power beta was set to 3 based on the soft threshold screening by PickSoftThreshold function (). A total of 4 modules were revealed using the cuttreeStaticColor function from the WGCNA package (cutHeight =0.8; minSize =20), and the number of genes in the module ranged from 20 to 1,086 (Table S2; ). In addition, the gray module represents a gene set that is not assigned to any of the modules, containing 1,086 genes. TOM plot was generated by the TOMplot function from the WGCNA package (). Then, the value of weighted co-expression coefficient between 2 genes >0.4 was exported for weighted co-expression network construction by the Cytoscape software (). Weighted co-expression network construction was also performed in modules ( and ). The heat map of the turquoise module is shown in .
Figure 1 Plot of WGCNA analysis.
Abbreviations: WGCNA, weighted gene co-expression network analysis; TOM, topological overlap matrix.
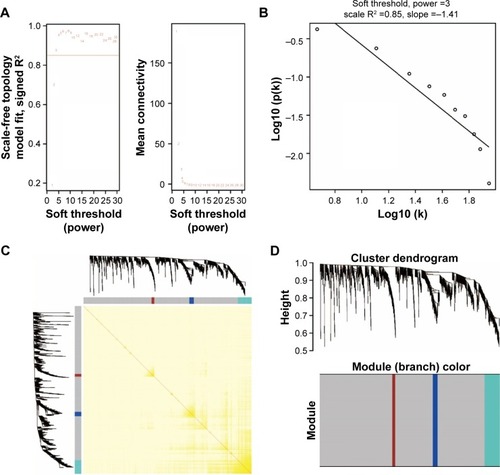
Figure 2 Weighted co-expression network for all prognosis-related genes.
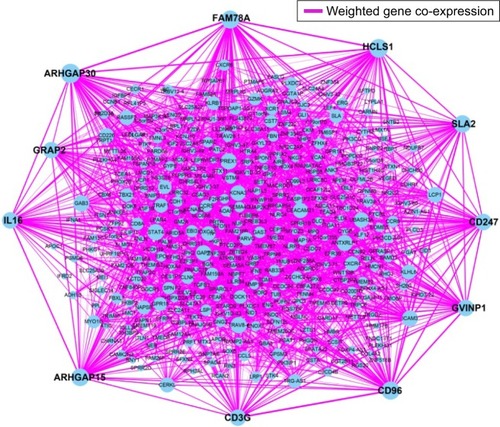
Figure 3 Weighted co-expression network for turquoise module prognosis-related genes.
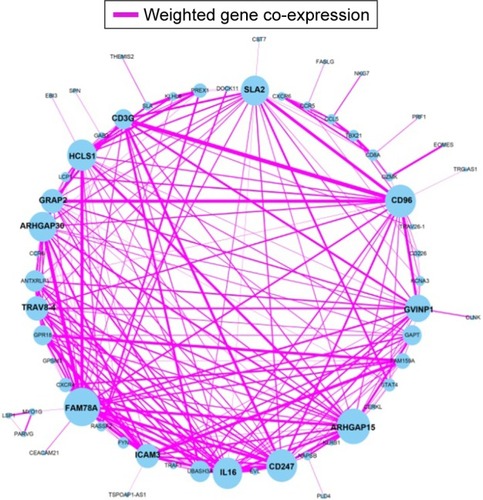
Figure 4 Weighted co-expression network for blue and brown module and enrichment results.
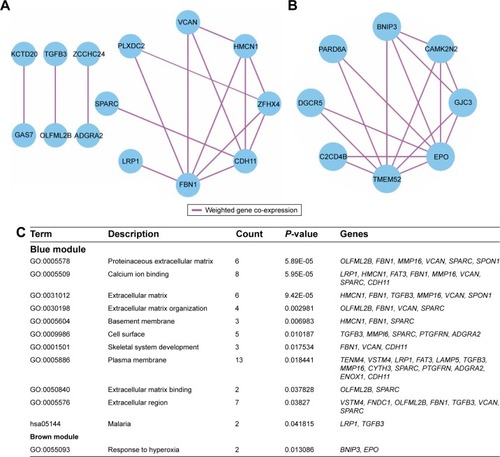
Figure 5 Heat map for turquoise module.
The weighted co-expression networks of all potential prognosis-related genes and genes in the turquoise module were used for hub gene screening, and the top 10 node degree genes at the intersection of 2 interactome networks were identified as hub genes. We identified 9 genes as hub genes (; ): Rho GTPase-activating protein 30 (ARHGAP30), hematopoietic cell-specific Lyn substrate 1 (HCLS1), CD96 molecule (CD96), family with sequence similarity 78 member A (FAM78A), Rho GTPase-activating protein 15 (ARHGAP15), Src-like adaptor 2 (SLA2), CD247 molecule (CD247), GTPase, very large interferon-inducible pseudogene 1 (GVINP1) and interleukin 16 (IL16). The highest node degree of all prognosis-related genes and turquoise module networks was ARHGAP30 with a node degree of 69 and FAM78A with a node degree of 25 (), respectively.
Figure 6 Kaplan–Meier survival curves of nine hub genes.
Abbreviations: ARHGAP30, Rho GTPase activating protein 30; HCLS1, hematopoietic cell-specific Lyn substrate 1; CD96, CD96 molecule; FAM78A, family with sequence similarity 78 member A; ARHGAP15, Rho GTPase activating protein 15; SLA2, Src like adaptor 2; CD247, CD247 molecule; GVINP1, GTPase, very large interferon inducible pseudogene 1; IL16, interleukin 16.
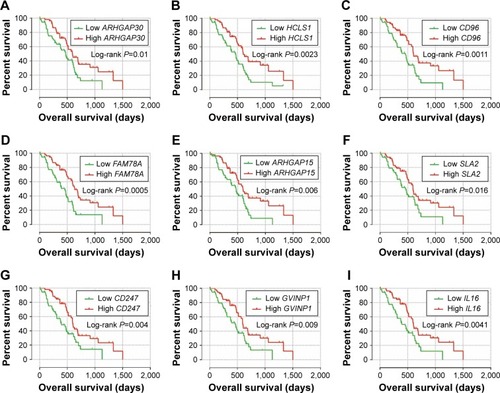
Table 2 Correlation between OS and hub gene expression of PDAC patients
Prognostic model construction and ROC curve analysis
We further investigated the co-expression relationship among the hub genes and observed that these genes had a strong positive correlation with each other (). Patients were divided into 2 groups according to the median cutoff of the prognosis risk score from the formula (): Risk score = expression of ARHGAP30 × (−0.446) + expression of HCLS1 × (−0.211) + expression of CD96 × (−0.376) + expression of FAM78A × (−0.284) + expression of ARHGAP15 × (0.372) + expression of SLA2 × (−0.443) + expression of CD247 × (0.267) + expression of GVINP1 × (0.137) + expression of IL16 × (0.001). Survival analysis indicates that patients with a low-risk score have a significantly longer MST than those with a high-risk score (log-rank P=0.0038; 603 vs 458 days for low risk vs high risk; ), and a significantly decreased risk of death (adjusted P=0.026, HR =0.513, 95% CI =0.285–0.924; ; ). This risk score also demonstrated a prognosis prediction on early-stage PDAC after pancreaticoduodenectomy, as the area under ROC curve (AUC) was 0.641, 0.623, and 0.554 for 1, 3 and 5 years (), respectively. This prognostic signature of the 9 genes showed a good performance in clinical outcome prediction for the 1-year survival of PDAC patients. The expression level distribution of the 9 genes in the low- and high-risk group is also presented in .
Figure 7 Prognostic risk score model analysis of nine hub genes in PDAC patients.
Abbreviations: ARHGAP30, Rho GTPase activating protein 30; HCLS1, hematopoietic cell-specific Lyn substrate 1; CD96, CD96 molecule; FAM78A, family with sequence similarity 78 member A; ARHGAP15, Rho GTPase activating protein 15; SLA2, Src like adaptor 2; CD247, CD247 molecule; GVINP1, GTPase, very large interferon inducible pseudogene 1; IL16, interleukin 16; ROC, receiver operating characteristic; PDAC, pancreatic ductal adenocarcinoma.
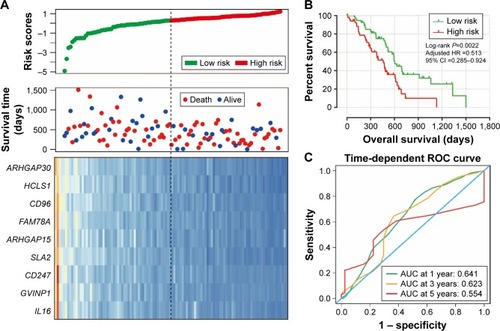
Figure 8 The expression level distribution of the nine genes in the low- and high-risk group.
Abbreviations: ARHGAP30, Rho GTPase activating protein 30; HCLS1, hematopoietic cell-specific Lyn substrate 1; CD96, CD96 molecule; FAM78A, family with sequence similarity 78 member A; ARHGAP15, Rho GTPase activating protein 15; SLA2, Src like adaptor 2; CD247, CD247 molecule; GVINP1, GTPase, very large interferon inducible pseudogene 1; IL16, interleukin 16.
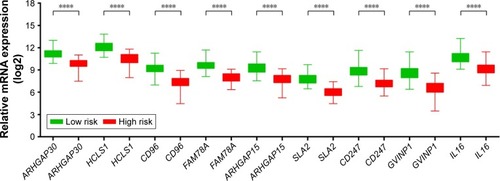
Table 3 Co-expression correlation coefficient among nine hub genes in WGCNA
Table 4 Correlation between OS and nine-gene prognostic signature of PDAC patients
Functional assessment
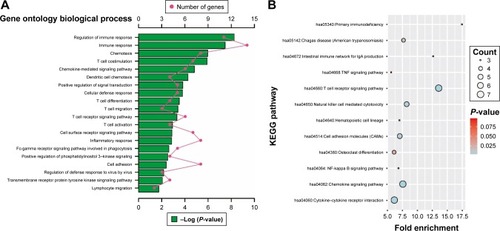
Enrichment analysis was performed in modules and for all prognosis-related genes. Enrichment analysis for all prognosis-related genes suggested that these genes were significantly involved in cell adhesion, regulation of cytokine production, positive regulation of cell migration and hepatocyte apoptotic biological processes, and cytokine–cytokine receptor interaction, PI3K-Akt signaling pathway, FoxO signaling pathway, Hippo signaling pathway, Rap1 signaling pathway, chemokine signaling pathway and Ras signaling pathway (). Enrichment analysis indicated that regulation of the immune response and PI3K signaling, T cell co-stimulation, chemokine-mediated signaling pathway, T cell differentiation, T cell migration, T cell receptor signaling pathway, T cell activation and cell adhesion biological processes were involved in turquoise module, whereas KEGG showed that these genes were enriched in the T cell receptor signaling pathway, Chemokine signaling pathway, cytokine–cytokine receptor interaction, natural killer cell-mediated cytotoxicity and the cell adhesion molecule (CAM) signaling pathway (). Enrichment analyses for blue and brown modules correlated with calcium ion binding and extracellular matrix, while brown module genes were related to the hyperoxia response ().
Figure 9 GO and KEGG enrichment results of all prognosis-related genes.
Abbreviations: GO, gene ontology; KEGG, Kyoto Encyclopedia of Genes and Genomes.
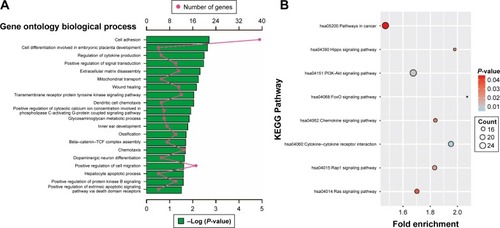
Figure 10 GO and KEGG enrichment results of turquoise module genes.
Abbreviations: GO, gene ontology; KEGG, Kyoto Encyclopedia of Genes and Genomes.
Discussion
The prognosis of PDAC is determined by the interaction of multivariate factors, such as clinical factors, tumor biological characteristics and genetic factors. Pancreatic stump closure and pancreatic fistula after pancreatoduodenectomy may have affected the patients’ prognosis,Citation31,Citation32 as well as the tumor’s biological characteristics, such as tumor size and histological grade, lymph node status, vascular or neural invasion.Citation11 In addition, it has already been substantiated that genetic factors in pancreatic cancer may play a critical role in tumor occurrence, development, and prognosis.Citation7,Citation12,Citation33 Due to the high mortality rate of pancreatic cancer, it is necessary to investigate reliable prognostic markers in order to select a subset of patients that would benefit from additional treatment options to improve survival. RNA sequencing can investigate the gene functions at the whole genome-scale level, whereas the WGCNA is a method of systems biology for describing the correlation patterns among genes across microarray samples.Citation14 Our current study used an RNA sequence dataset of patients receiving pancreaticoduodenectomy to identify 1238 genes that were associated with PDAC prognosis, then we used WGCNA to investigate a hub of genes among these prognosis-related genes. Through the WGCNA assessment, we identified 9 hub genes among the prognosis-related gene co-expression networks and constructed a 9-gene signature consisting of ARHGAP30, HCLS1, CD96, FAM78A, ARHGAP15, SLA2, CD247, GVINP1 and IL16, which was validated as an independent predictor for PDAC patient survival. The AUC of a survival ROC curve for the 9-gene signature in predicting 1-year survival was 0.633. This 9-gene signature showed a good performance in predicting the 1-year survival of PDAC patients and may have further potential in predicting the prognosis in patients with PDAC after pancreaticoduodenectomy to reveal targets for the development of therapy.
The high expression of all the 9 genes was associated with a favorable prognosis of PDAC patients; however, the role of these genes in PDAC prognosis has not been reported in previous studies. It is worth noting that several of these genes have already been reported to be associated with the prognosis of cancer disease. Work by Wang et al revealed that ARHGAP30 promotes p53 acetylation, and low expression of ARHGAP30 was associated with unfavorable prognosis in colorectal cancer patients, consistent with our results of ARHGAP30 in PDAC patients’ survival.Citation34 In previous studies, the expression of another hub gene, IL16, appeared to be a useful prognostic biomarker in patients with multiple myeloma and prostate cancer,Citation35,Citation36 while polymorphisms in IL16 also showed a correlation with clinical outcome in prostate cancer and non-small cell lung cancer.Citation37,Citation38 In addition, a study has demonstrated that the expression of HCLS1 plays a central role in lymphocyte trafficking and homing regulation, and influences tissue invasion and infiltration in chronic lymphocytic leukemia (CLL).Citation39 Furthermore, HCLS1 was notably up-regulated in CLL patients compared with healthy subjects, and high expression of HCLS1 and its phosphorylation in CLL were significantly correlated with poor survival, respectively.Citation40–Citation42 The prognostic prediction value of gene expression in CLL can also be observed in CD247 by using gene co-expression network analysis.Citation43 A study by Arai et al indicated that DNA methylation alteration of FAM78A combined with the DNA methylation of other genes alteration at precancerous stages can be used to identified tumor aggressiveness and patient outcome in clear cell renal cell carcinomas.Citation44 No studies have reported a correlation of the 4 remaining genes, CD96, SLA2, GVINP1, and ARHGAP15, with the prognosis of cancer.
We also performed functional enrichment analysis for these prognosis-related genes in order to identify potential biological processes and pathways that are associated with PDAC prognosis. Cell adhesion was the most significant biological process in GO enrichment analysis of all prognosis-related genes and was also the significant GO enrichment in turquoise module genes. In addition, the turquoise module was also significantly enriched in the CAM pathway. Numerous studies have demonstrated that the altered expression of adhesion molecules is associated with pancreatic cancer invasion and metastasis.Citation45,Citation46 CAMs also serve as predictive biomarkers for pancreatic cancer prognosis.Citation47,Citation48 Expanding evidence reveals that the Rap1 signaling pathway was associated with cell adhesionCitation49 and that Rap1 activation is required for epidermal growth factor receptor-mediated metastasis in pancreatic cancer.Citation50 KEGG enrichment results of all the prognosis-related genes suggested that PI3K-Akt, Ras, cytokine–cytokine receptor interaction, and FoxO signaling pathway were associated with PDAC prognosis. Evidence shows that PI3K-Akt and the Ras signaling pathway can serve as a potential targeted therapy for pancreatic cancer.Citation51,Citation52 Bioinformatics analysis in the comparison of pancreatic cancer patients and healthy subjects identified that cytokine–cytokine receptor interaction and the FoxO signaling pathway play a role in the occurrence of pancreatic cancer.Citation53,Citation54
The most significant biological process in the GO enrichment analysis of the turquoise module genes was the regulation of the immune response, while the most significant pathway in KEGG enrichment analysis was the T cell receptor signaling pathway. Furthermore, biological processes of turquoise module genes were also significantly involved in T cell co-stimulation, differentiation, migration, activation, and the T cell receptor signaling pathway. The latest research argues that spatial computation of intratumoral T cells correlates with pancreatic cancer prognosis,Citation55 and the level of T cells have a prognostic prediction value that can be considered an independent prognostic factor for pancreatic cancer.Citation56–Citation58 In addition, a high degree of infiltration of both CD4+ and CD8+ T cells around tumor cells seems to be associated with favorable prognosis and a high prevalence of regulatory T cells can serve as an independent negative predictive factor of PDAC.Citation30,Citation59,Citation60
There were limitations in our study that need to be recognized. First, the clinical information from the TCGA database was not comprehensive, and the detailed information of some clinical treatment regimens also could not be obtained, such as the detailed information of radiation and targeted molecular therapy. Therefore, our study evaluates the association between gene expression level and OS based on a multivariate survival analysis that was only adjusted for pathologic stage, histologic grade, radical resection, radiation therapy and targeted molecular therapy in the multivariate Cox proportional hazards regression model. In addition, due to the incomplete clinical information in the present study, we could not analyse the joint effect between this 9-gene prognostic signature and the prognostic model that was constructed using only clinical data.Citation61–Citation63 Second, the TCGA PDAC cohort had a relatively short follow-up period (median follow-up of 518 days) and the censored rate was high, which may have affected the reliability of the Kaplan–Meier estimates. Third, patients in our study were exclusively from a single source, and the development and assessment of this prognostic model still have certain limitations. Independent external validation datasets with long-term follow-up and complete clinical information to provide a realistic assessment of the performance of this gene signature would be more reliable.
Despite these limitations, our current study has identified 1,238 prognostic markers via a whole genome expression level screening and 9 hub genes by using a bioinformatics method. We then constructed a 9-gene prognostic signature of early-stage PDAC. These findings provide insight into prognosis-related genes of PDAC and may have a clinical utility for prognosis prediction and decision-making in PDAC management.
Conclusions
On the basis of whole genome expression level screening, we identified 1,238 markers that are related to the prognosis of PDAC after pancreaticoduodenectomy and selected 9 genes among these prognosis-related genes by using a WGCNA analysis. In addition, we also succeeded in identifying a gene signature comprising 9 hub genes (ARHGAP30, HCLS1, CD96, FAM78A, ARHGAP15, SLA2, CD247, GVINP1, and IL16), which helped to classify patients into a high-risk group that had increased risk of death, and a low-risk group that had significantly improved OS. The independent prognostic model demonstrated a good performance in the clinical 1-year survival prediction for PDAC patients and can be used for prognosis prediction indicators in PDAC patients after pancreaticoduodenectomy. Due to the limitations in the present study, our findings still need to be verified in a future large cohort study.
Acknowledgments
This work was supported in part by the National Nature Science Foundation of China (No: 81560535, 81072321, 30760243, 30460143 and 30560133), 2009 Program for New Century Excellent Talents in University (NCET), Guangxi Nature Sciences Foundation (No: GuiKeGong 1104003A-7), and Guangxi Health Ministry Medicine Grant (Key-Scientific Research-Grant Z201018). Self-raised Scientific Research Fund of the Health and Family Planning Commission of Guangxi Zhuang Autonomous Region (Z2016318). The authors thank the contributors of TCGA for sharing the PDAC data on open access. In addition, we also would like to acknowledge the helpful comments on this paper received from our reviewers.
Disclosure
The authors report no conflicts of interest in this work.
References
- SeufferleinTBachetJBVan CutsemERougierPGroup EGWPancreatic adenocarcinoma: ESMO-ESDO Clinical Practice Guidelines for diagnosis, treatment and follow-upAnn Oncol201223Suppl 7vii33vii4022997452
- SiegelRMaJZouZJemalACancer statistics, 2014CA Cancer J Clin201464192924399786
- TorreLABrayFSiegelRLFerlayJLortet-TieulentJJemalAGlobal cancer statistics, 2012CA Cancer J Clin20156528710825651787
- ChenWZhengRBaadePDCancer statistics in China, 2015CA Cancer J Clin201666211513226808342
- ZengHZhengRGuoYCancer survival in China, 2003–2005: a population-based studyInt J Cancer201513681921193025242378
- SiegelRLMillerKDJemalACancer statistics, 2016CA Cancer J Clin201666173026742998
- KamisawaTWoodLDItoiTTakaoriKPancreatic cancerLancet201638810039738526830752
- HidalgoMPancreatic cancerN Engl J Med2010362171605161720427809
- VincentAHermanJSchulickRHrubanRHGogginsMPancreatic cancerLancet2011378979160762021620466
- CameronJLRiallTSColemanJBelcherKAOne thousand consecutive pancreaticoduodenectomiesAnn Surg20062441101516794383
- GarceaGDennisonARPattendenCJNealCPSuttonCDBerryDPSurvival following curative resection for pancreatic ductal adenocarcinoma. A systematic review of the literatureJOP2008929913218326920
- AnsariDRosendahlAElebroJAnderssonRSystematic review of immunohistochemical biomarkers to identify prognostic subgroups of patients with pancreatic cancerBr J Surg20119881041105521644238
- AndersSHuberWDifferential expression analysis for sequence count dataGenome Biol20101110R10620979621
- LangfelderPHorvathSWGCNA: an R package for weighted correlation network analysisBMC Bioinformatics2008955919114008
- ZhangBHorvathSA general framework for weighted gene co-expression network analysisStat Appl Genet Mol Biol20054 Article17
- ZhouMZhaoHWangZIdentification and validation of potential prognostic lncRNA biomarkers for predicting survival in patients with multiple myelomaJ Exp Clin Cancer Res20153410226362431
- ZhouXHuangZXuLA panel of 13-miRNA signature as a potential biomarker for predicting survival in pancreatic cancerOncotarget2016743696166962427626307
- HeagertyPJZhengYSurvival model predictive accuracy and ROC curvesBiometrics20056119210515737082
- Huang daWShermanBTLempickiRASystematic and integrative analysis of large gene lists using DAVID bioinformatics resourcesNat Protoc200941445719131956
- Huang daWShermanBTLempickiRABioinformatics enrichment tools: paths toward the comprehensive functional analysis of large gene listsNucleic Acids Res200937111319033363
- ShannonPMarkielAOzierOCytoscape: a software environment for integrated models of biomolecular interaction networksGenome Res200313112498250414597658
- MarechalRDemetterPNagyNHigh expression of CXCR4 may predict poor survival in resected pancreatic adenocarcinomaBr J Cancer200910091444145119352387
- MarchesiFMontiPLeoneBEIncreased survival, proliferation, and migration in metastatic human pancreatic tumor cells expressing functional CXCR4Cancer Res200464228420842715548713
- LiaoWCWangHPHuangHYCXCR4 expression predicts early liver recurrence and poor survival after resection of pancreatic adenocarcinomaClin Transl Gastroenterol20123e2223238349
- HuangJYaoWYZhuQXAF1 as a prognostic biomarker and therapeutic target in pancreatic cancerCancer Sci2010101255956719922503
- CarboneAVizioBNovarinoAIL-18 paradox in pancreatic carcinoma: elevated serum levels of free IL-18 are correlated with poor survivalJ Immunother200932992093119816189
- SinnMSinnBVStrieflerJKSPARC expression in resected pancreatic cancer patients treated with gemcitabine: results from the CONKO-001 studyAnn Oncol20142551025103224562449
- HanWCaoFChenMBPrognostic value of SPARC in patients with pancreatic cancer: a systematic review and meta-analysisPLoS One2016111e014580326731428
- InfanteJRMatsubayashiHSatoNPeritumoral fibroblast SPARC expression and patient outcome with resectable pancreatic adenocarcinomaJ Clin Oncol200725331932517235047
- OikonomopoulosGMSyrigosKNSaifMWPrognostic factors in pancreatic cancerJOP201314432232423846918
- MaurielloCPolistenaAGambardellaCPancreatic stump closure after pancreatoduodenectomy in elderly patients: a retrospective clinical studyAging Clin Exp Res201729Suppl 13540
- ConzoGGambardellaCTartagliaEPancreatic fistula following pancreatoduodenectomy. Evaluation of different surgical approaches in the management of pancreatic stump. Literature reviewInt J Sur201521Suppl 1S4S9
- BaileyPChangDKNonesKGenomic analyses identify molecular subtypes of pancreatic cancerNature20165317592475226909576
- WangJQianJHuYArhGAP30 promotes p53 acetylation and function in colorectal cancerNat Commun20145473525156493
- AtanackovicDHildebrandtYTemplinJRole of interleukin 16 in multiple myelomaJ Natl Cancer Inst2012104131005102022745469
- ComperatERoupretMDrouinSJTissue expression of IL16 in prostate cancer and its association with recurrence after radical prostatectomyProstate201070151622162720687232
- WoodsNTMonteiroANThompsonZJInterleukin polymorphisms associated with overall survival, disease-free survival, and recurrence in non-small cell lung cancer patientsMol Carcinog201554Suppl 1E172E18425597281
- HughesLRuthKRebbeckTRGiriVNGenetic variation in IL-16 miRNA target site and time to prostate cancer diagnosis in African-American menProstate Cancer Prostatic Dis201316430831424061634
- ScielzoCBertilaccioMTSimonettiGHS1 has a central role in the trafficking and homing of leukemic B cellsBlood2010116183537354620530793
- ButrymAMajewskiMDzietczeniaJKuliczkowskiKMazurGHigh expression of hematopoietic cell specific Lyn substrate-1 (HS1) predicts poor survival of B-cell chronic lymphocytic leukemia patientsLeuk Res201236787688022333038
- FrezzatoFGattazzoCMartiniVHS1, a Lyn kinase substrate, is abnormally expressed in B-chronic lymphocytic leukemia and correlates with response to fludarabine-based regimenPLoS One201276e39902
- ScielzoCGhiaPContiAHS1 protein is differentially expressed in chronic lymphocytic leukemia patient subsets with good or poor prognosesJ Clin Invest200511561644165015931393
- ZhangJXiangYDingLUsing gene co-expression network analysis to predict biomarkers for chronic lymphocytic leukemiaBMC201011Suppl 9S5
- AraiEChikuSMoriTSingle-CpG-resolution methylome analysis identifies clinicopathologically aggressive CpG island methylator phenotype clear cell renal cell carcinomasCarcinogenesis20123381487149322610075
- PrincipeMBorgoniSCascioneMAlpha-enolase (ENO1) controls alpha v/beta 3 integrin expression and regulates pancreatic cancer adhesion, invasion, and metastasisJ Hematol Oncol20171011628086938
- PerlAKDahlUWilgenbusPCremerHSembHChristoforiGReduced expression of neural cell adhesion molecule induces metastatic dissemination of pancreatic beta tumor cellsNat Med19995328629110086383
- TsutsumiSMorohashiSKudoYL1 Cell adhesion molecule (L1CAM) expression at the cancer invasive front is a novel prognostic marker of pancreatic ductal adenocarcinomaJ Surg Oncol2011103766967321360711
- LiHWangXFangYIntegrated expression profiles analysis reveals novel predictive biomarker in pancreatic ductal adenocarcinomaOncotarget2017
- BosJLLinking Rap to cell adhesionCurr Opin Cell Biol200517212312815780587
- HuangMAnandSMurphyEAEGFR-dependent pancreatic carcinoma cell metastasis through Rap1 activationOncogene201231222783279321963850
- KennedyALAdamsPDMortonJPRas, PI3K/Akt and senescence: paradoxes provide clues for pancreatic cancer therapySmall GTPases20112526426722292129
- HubbardPAMoodyCLMuraliRAllosteric modulation of Ras and the PI3K/AKT/mTOR pathway: emerging therapeutic opportunitiesFront Physiol2014547825566081
- GiuliettiMOcchipintiGPrincipatoGPivaFIdentification of candidate miRNA biomarkers for pancreatic ductal adenocarcinoma by weighted gene co-expression network analysisCell Oncol2017402181192
- WangCJXuRHYuanQYBioinformatics method to analyze the mechanism of pancreatic cancer disorderJ Comput Biol201320644445223614574
- CarstensJLCorrea de SampaioPYangDSpatial computation of intratumoral T cells correlates with survival of patients with pancreatic cancerNat Commun201781509528447602
- LiuLZhaoGWuWLow intratumoral regulatory T cells and high peritumoral CD8(+) T cells relate to long-term survival in patients with pancreatic ductal adenocarcinoma after pancreatectomyCancer Immunol Immunother2016651738226646849
- LiuHLGuanCJWuYJHuMGZhaoZMLiuRClinical significance of preoperative CD8+ central memory T cells for operable pancreatic asdenocarcinomaDig Surg201532643343826402444
- NiccolaiECappelloPTaddeiAPeripheral ENO1-specific T cells mirror the intratumoral immune response and their presence is a potential prognostic factor for pancreatic adenocarcinomaInt J Oncol201649139340127210467
- HiraokaNOnozatoKKosugeTHirohashiSPrevalence of FOXP3+ regulatory T cells increases during the progression of pancreatic ductal adenocarcinoma and its premalignant lesionsClin Cancer Res200612185423543417000676
- FukunagaAMiyamotoMChoYCD8+ tumor-infiltrating lymphocytes together with CD4+ tumor-infiltrating lymphocytes and dendritic cells improve the prognosis of patients with pancreatic adenocarcinomaPancreas2004281e26e3114707745
- FerroneCRKattanMWTomlinsonJSThayerSPBrennanMFWarshawALValidation of a postresection pancreatic adenocarcinoma nomogram for disease-specific survivalJ Clin Oncol200523307529753516234519
- BrennanMFKattanMWKlimstraDConlonKPrognostic nomogram for patients undergoing resection for adenocarcinoma of the pancreasAnn Surg2004240229329815273554
- de CastroSMBiereSSLagardeSMBuschORvan GulikTMGoumaDJValidation of a nomogram for predicting survival after resection for adenocarcinoma of the pancreasBr J Surg200996441742319283741