
 ?Mathematical formulae have been encoded as MathML and are displayed in this HTML version using MathJax in order to improve their display. Uncheck the box to turn MathJax off. This feature requires Javascript. Click on a formula to zoom.
Abstract
Bladder cancer (BC) is a common urinary system tumor with high aggressiveness, and it results in relatively high mortality due to a lack of precise and suitable biomarkers. In this study, we applied the weighted gene coexpression network analysis method to miRNA expression data from BC patients, and screened for network modules associated with BC progression. Hub miRNAs were selected, followed by functional enrichment analyses of their target genes for the most closely related module. These hub miRNAs were found to be involved in several functional pathways including pathway in cancer, regulation of actin cytoskeleton, PI3K-Akt signaling pathway, mitogen-activated protein kinase (MAPK) signaling pathway, Wnt signaling pathway, proteoglycans in cancer, focal adhesion and p53 signaling pathway via regulating target genes. Finally, their prognostic significance was tested using analyses of overall survival. A few novel prognostic miRNAs were identified based on expression profiles and related survival data. In conclusion, several miRNAs that were critical in BC initiation and progression have been identified in this study. These miRNAs, which may contribute to a comprehensive understanding of the pathogenesis of BC, could serve as potential biomarkers for BC prognosis or as new therapeutic targets.
Introduction
Bladder cancer (BC) is one of the most common malignant cancers of the urinary system and is associated with an annual mortality of over 150,000.Citation1,Citation2 Bladder transitional cell carcinoma accounts for more than 90% of these deaths. Approximately 70%–75% of transitional cell carcinoma cases are non-muscle invasive bladder cancer and the remaining 25%–30% are muscle invasive bladder cancer. Approximately 70% of non-muscle invasive bladder cancer patients ultimately develop relapse within 5 years after undergoing transurethral resection of BC. Meanwhile, muscle invasive bladder cancer is likely to be linked with lethal metastasis at the time of diagnosis.Citation3–Citation5 To date, sensitive and specific markers for the diagnosis and treatment of BC have not been found. Therefore, it is crucial to search for biomarkers to predict the development and prognosis of BC, which can also be used as therapeutic targets.
miRNAs are constituted by a large number of naturally occurring endogenous small non-coding RNAs. miRNAs, with lengths of 22–25 nucleotides, can regulate gene expression through translational inhibition or mRNA cleavage.Citation6 A variety of studies have shown that miRNAs play important regulatory roles in diverse physiologic processes, including cell proliferation, adhesion and migration.Citation7,Citation8 Furthermore, miRNAs can target multiple mRNAs, which render them powerful regulators. For example, loss of miR-218, a tumor suppressor, enhances cancer cell migration and invasion in prostate cancer through direct regulation of LIM and SH3 domain protein 1 (LASP1), which is a member of the nebulin family of actin-binding proteins.Citation9 miR-124/miR-9 plays a role in the neuronal development of primary neurons by regulating glycoprotein M6A (GPM6A), a transmembrane glycoprotein.Citation10 Moreover, a study has shown that miR-1 inhibits cell proliferation, invasion, metastasis and further progression of esophageal squamous cell carcinoma by binding to its target gene, TAGLN2, which also belongs to the family of actin-binding proteins.Citation11 In addition, abnormal miRNA expression may interfere with many cellular signaling pathways; moreover, it can profoundly affect the pathogenesis and progression of cancer. Abnormal expression of miRNAs has been observed in several kinds of human tumors, including BC.Citation12–Citation14 The role of miRNAs in BC is a promising area of research to better understand the mechanisms of BC initiation, development and metastasis.
The rapid growth of high-throughput microarray technology in recent years has provided new methods to identify BC progression-related genes. Previously, identification of these genes was accomplished through basic gene expression analysis methods. Molecular mechanisms can be partially understood by screening differentially expressed genes or differentially expressed miRNAs (DEMs).Citation15,Citation16 Moreover, recent bioinformatics advancements allow us to apply the weighted gene coexpression network analysis (WGCNA) algorithm to interpret expression profiles, which ensure more comprehensive identification of new biomarkers.Citation17 WGCNA can detect highly coexpressed genes that are closely connected within the network based on similarities in sample expression profiles. These subnetwork regions are called modules and are usually composed of functionally related genes.Citation17,Citation18 Therefore, the WGCNA algorithm for BC microarray miRNA expression data was performed in order to construct a coexpression network based on interactions between DEMs. In the meantime, hub miRNAs potentially associated with the pathogenesis of BC were identified and validated as prognostic biomarkers. These miRNAs may further reveal the biologic mechanisms of BC initiation and progression and may also serve as potential therapeutic targets.
Materials and methods
Acquisition of gene expression data and DEMs
The raw miRNA expression data from 418 BC and 19 normal tissue samples were downloaded from the Cancer Genome Atlas (TCGA).Citation19 DEMs between BC and normal samples were selected using the “edgeR” R package.Citation20 miRNAs with a false discovery rate of <0.05 and | log2 fold change | of >0.585 were identified as DEMs.
WGCNA and the identification of clinically significant modules
As reported above, the WGCNA package provided an approach to constructing miRNA modules within a network based on correlations between DEM expression profiles.Citation21,Citation22 First, a Pearson’s correlation matrix was computed for all pair-wise miRNAs. Subsequently, an adjacency matrix was constructed using a power adjacency function (αmn = Power (Smnβ) = |Smn|β, αmn = adjacency between two miRNAs, Smn = Pearson’s correlations between two miRNAs). β is a soft thresholding parameter allowing for a maximal correlation coefficient. The power of β=3 (model fitting index R2=0.83) was chosen in accordance with the scale-free topology criterion. Next, the topological overlap matrix was calculated from the adjacency matrix to assess the interconnectedness of the miRNAs.Citation23 Finally, the “cutreeStaticColor” function was applied to classify similar expression miRNAs into gene modules (minModuleSize =20 and mergeCutHeight =0.95). To identify the modules that were significantly associated with BC development, gene significance (GS) was calculated according to the formula: GSi = −log(Pi), where Pi was obtained from the value of the student’s t-test (two-tailed) to identify the differential expression between two groups. GS represented the correlation between gene expression and disease progression. The module significance was defined as the mean GS in a module, while a module with a high module significance value was considered to be the key module.Citation21
Detection of candidate hub DEMs
Hub miRNAs were defined based on intramodular connectivity and module membership (MM) in our study. The intramodular connectivity was calculated as follows: , where i, j belongs to Module q, Ki = intramodular connectivity of gene i and aij = adjacency between genes i and j.Citation24 Intramodular connectivity reflects the correlation between miRNAs in the coexpression network. The MM was computed as originally described, namely, MMi = |cor (x(i), ME), where the module eigengene stands for the first principal component of a given module. The MMi ranged from 0 to 1, which reflected the Pearson’s correlation coefficient between gene expression and the module eigengene in the network.Citation25 In general, miRNAs showing a high degree of connectivity and MM values within a module were defined as “hub miRNAs”, which were assumed to be functionally significant.Citation22,Citation24,Citation26 The top 25% of miRNAs with the highest connectivity and MM values in the blue module were selected based on the module sizes as hub miRNAs for further study.
Bioinformatics analysis of miRNA target genes
Potential target genes of hub DEMs were retrieved from the target prediction database TargetScan (http://www.targetscan.org/). In addition, genes with a cumulative weighted context++ score of ≤−0.4 in the software were selected.Citation27 Functional Gene Ontology (GO) enrichment analysis and Kyoto Encyclopedia of Genes and Genomes (KEGG) pathway analysis were performed using DAVID v6.8 (http://david.abcc.ncifcrf.gov/) bioinformatics online resources in order to uncover the biologic function of target genes. A P-value cutoff of <0.01 was set, and at least five genes were selected as the enriched function of target genes.
Human tissue specimens
Human tumor tissues and adjacent normal tissue specimens were obtained from the Department of Urology at Nanjing First Hospital, Nanjing Medical University. Ethical approval was obtained from the ethics committee of Nanjing First Hospital and written informed consent was obtained from all patients. The specimens were collected during surgery and frozen in liquid nitrogen.
Western blotting
Total protein was extracted from the tumor tissues and adjacent normal tissue specimens using radioimmunoprecipitation assay lysis buffer containing a protease inhibitor cocktail (Roche, Shanghai, China). The protein concentration was quantified using a bicinchoninic acid protein assay kit (Beyotime, Shanghai, China). Equivalent amounts of proteins were separated by sodium dodecyl sulfate-polyacrylamide gel electrophoresis, transferred to polyvinylidene fluoride membranes (EMD Millipore, Billerica, MA, USA) and blocked with 5% non-fat milk in distilled water for 2 h at room temperature. Later, the membranes were incubated with diluted anti-TAGLN2 primary antibodies (Abcam, #ab121146) overnight at 4°C, followed by incubation with horseradish peroxidase-conjugated secondary antibody (YI FEI XUE BIOTECHNOLOGY, Nanjing, China) for 2 h at room temperature. β-Actin was used as an internal control.
Human protein atlas
Expression of the TAGLN2 protein in BC tissues and normal bladder tissues was determined from immunohistochemical data publicly available in the Human Protein Atlas (www.proteinatlas.org).Citation28
Survival analyses
Survival analyses in this study were performed using the TCGA database. The miRNA expression profile and survival data from 406 BC patients were used in our study after eliminating patients without available clinical information. The prognostic values of signature candidate miRNA profiles were assessed using GraphPad Prism 7. BC samples were divided into two groups according to their median proposed miRNA expression. The survival of two patient cohorts with candidate miRNAs was compared using a Kaplan–Meier survival plot. Moreover, log-rank P-values and the hazard ratio (HR) with 95% CIs were also calculated.
Results
Identification of DEMs
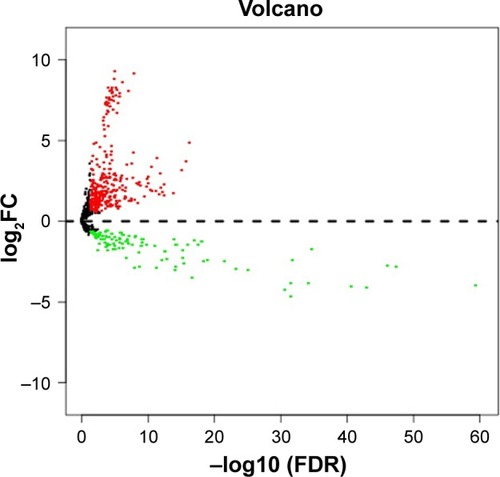
Using TCGA miRNA expression data, DEM expression profiles from BC and normal tissue samples were acquired by the “edgeR” package in R, with P<0.05 and log2 (fold change)| >0.585 being selected as the criteria. A total of 480 DEMs were identified after analysis, among which 350 genes were upregulated while 130 were downregulated (; Table S1).
Figure 1 Volcano plot of differentially expressed miRNAs.
Coexpression network and clinical significant modules
The miRNA coexpression network in this study was constructed using the WGCNA. In addition, DEMs with similar expression patterns were divided into modules adopting the average hierarchical clustering linkage. Modules containing at least 20 miRNAs were extracted, and 5 modules were eventually identified (). The blue module had the highest mean GS among these modules (), and the correlation coefficient (r) of this module indicated a significant correlation of intramodular connectivity with gene significance (). This suggested that the blue module was closely related to BC progression. The top 25% of the 54 miRNAs () showing the highest connectivity and MM values in the blue module were chosen as candidate hub miRNAs.Citation29
Figure 2 Identification of key modules associated with the progression of BC.
Abbreviations: BC, bladder cancer; DEMs, differentially expressed miRNAs.
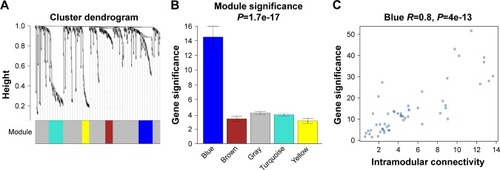
Table 1 Top 25% of the 54 miRNAs showing the highest connectivity and MM values in the blue module
Hub miRNA target prediction and functional annotation
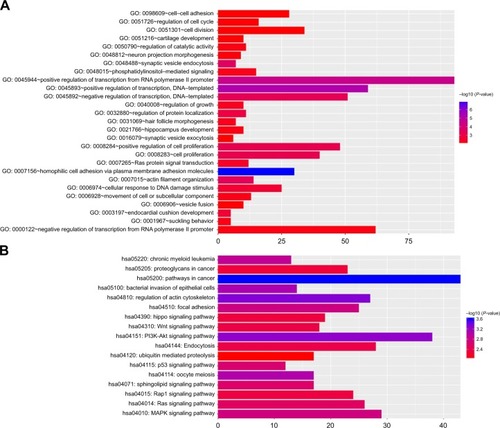
Target genes of hub miRNAs were predicted using Target-Scan V7.1. Those with cumulative weighted context++ scores of ≤−0.4 in the software were selected (Table S2).Citation27 The miRNA regulatory network was visualized using CytoScape software, and miRNAs with many interactions were graphically highlighted (). In total, 1351 predicted target genes were selected for further analysis. Altogether, 27 enriched GO biologic process terms () and 17 KEGG pathways () were obtained using a threshold of P<0.01 within the online software DAVID. GO analysis results suggested that the most represented GO terms in biologic processes were related to cell proliferation and regulation of growth. On the other hand, target genes were found to be significantly enriched in cancer-related pathways, such as pathways in cancer, regulation of actin cytoskeleton, PI3K-Akt signaling pathway, mitogen-activated protein kinase (MAPK) signaling pathway, Wnt signaling pathway, proteoglycans in cancer, focal adhesion and p53 signaling pathway.
Figure 3 A network of hub miRNAs and their target genes.
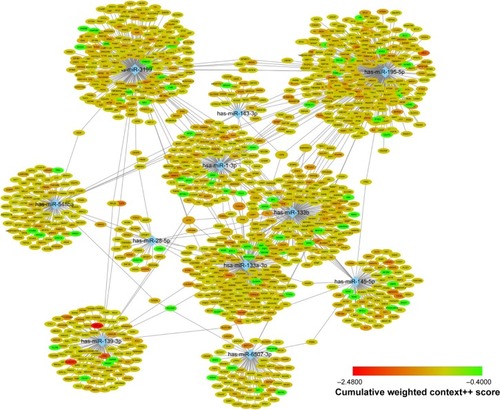
Figure 4 Functional annotations of the target genes.
Abbreviations: GO, Gene Ontology; KEGG, Kyoto Encyclopedia of Genes and Genomes.
Validation of the identified target genes
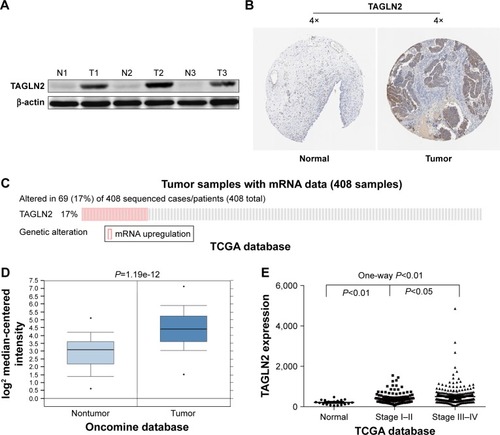
TAGLN2, the target gene with the highest repeatability, was randomly selected for further validation in order to determine the clinical relevance of target gene expression. It was a common target gene for miR-1–1/miR-1–2, miR-133a-1/miR-133a-2 and miR-133b. Western blots showed significantly higher TAGLN2 expression levels in BC tissue than in adjacent normal tissue specimens (), which was consistent with immunohistochemistry from the human protein map (www.proteinatlas.org, ). The TAGLN2 mRNA level was consistently higher in BC tissues than in normal bladder tissue (), and increased TAGLN2 expression also significantly increased the risk of advanced TNM stages (), as shown in Compendia Biosciences (www.oncomine.org) and TCGA BC RNAseq.
Figure 5 TAGLN2 is upregulated in human BC specimens.
Abbreviations: ANOVA, analysis of variance; BC, bladder cancer; N, normal; TCGA, The Cancer Genome Atlas; T, tumor.
Identification of hub miRNAs with prognostic value
Hub miRNAs in the blue module associated with the overall survival of BC patients were assessed in order to validate hub miRNAs as prognostic biomarkers. miRNA expression and clinical data of BC patients obtained from TCGA were applied toward assessing prognostic significance. As shown in , the low-expression miRNA candidate group had significantly poorer overall survival, which included hsa-miR-133a-1 (P=0.0327, HR: 1.372, 95% CI: 1.026–1.834), hsa-miR-133b (P=0.0498, HR: 1.530, 95% CI: 1.145–2.045), hsa-miR-143 (P=0.0018, HR: 1.597, 95% CI: 1.195–2.134), hsa-miR-195 (P=0.0127, HR: 1.452, 95% CI: 1.086–1.94) and hsa-miR-145 (P=0.0004, HR: 1.705, 95% CI: 1.276–2.279). These results indicate that the downregulated hsa-miR-133a-1, hsa-miR-133b, hsa-miR-143, hsa-miR-195, hsa-miR-6507, hsa-miR-145 and hsa-miR-548ba miRNAs were negative factors for the survival of BC patients.
Table 2 Overall survival of the hub miRNAs in the blue module
Discussion
BC is a fatal form of cancer, and the identification of new precise and suitable targets is of vital importance. Circulating miRNAs may serve as potential targets due to their involvement in various biologic processes, including cell proliferation, differentiation, apoptosis, metabolism and tumorigenesis. The identification of miRNA biomarkers and targets was accomplished by analyzing the microarray-based miRNA expression data obtained from TCGA database. Initially, 480 DEMs were identified in each group, including 350 upregulated and 130 downregulated miRNAs. A weighted miRNA coexpression network was subsequently constructed and several miRNA modules were identified based on DEM expression profiles. The blue module of coexpressed miRNAs was found to be of more importance than other modules, suggesting that it played a crucial role in the development of BC. Meanwhile, the top 25% miRNAs with the highest connectivity and MM values were selected as hub miRNAs for further research.
Among the blue module hub miRNAs, miR-1 and miR-133a are located in the same chromosomal region, or “cluster”. Furthermore, there are two different chromosomal loci harboring miR-1 and miR-133a clusters (miR-1–1 and miR-133a-2 on 20q13.33, as well as miR-1–2 and miR-133a-1 on 18q11.2). Yamasaki et alCitation30 reported that silencing the miR-1/miR-133a cluster could regulate the carcinogenicity of prothymosin-α and purine nucleoside phosphorylase and promote the proliferation and invasion of BC cells. In another study by Kawakami et al,Citation31 the expression levels of miR-1 and miR-133a were remarkably inhibited in renal cell carcinoma cell lines and specimens, while miR-1 and miR-133a restoration could induce apoptosis in renal cell carcinoma cell lines. miR-133b, which is located in chromosomal region 6p12.2, has been shown to be downregulated in various tumors. Furthermore, it is distinctly associated with invasive clinicopathologic features, tumor subtypes and lower survival rate.Citation32,Citation33 Some evidence has shown that downregulating miR-195 may inhibit apoptosis and promote the proliferation and invasion of non-small-cell lung cancer cells by upregulating the oncogene CHEK1 (checkpoint kinase 1).Citation34 Moreover, it has been found that miR-143, miR-145 and miR-28 are frequently markedly downregulated in colon cancer. These miRNAs are involved in regulation of several cellular processes, including proliferation, migration and chemoresistance.Citation35,Citation36
Furthermore, the enriched GO terms and KEGG pathways of hub miRNA target genes were also characterized by functional enrichment analysis. These target genes were found to be enriched in pathways in cancer, regulation of actin cytoskeleton, PI3K-Akt signaling pathway, MAPK signaling pathway, Wnt signaling pathway, proteoglycans in cancer, focal adhesion, p53 signaling pathway, cell proliferation and regulation of growth. In particular, many of these enriched functions regulated by hub miRNAs participate in the formation and progression of multiple tumors. For instance, the MAPK cascade is a critical pathway for human cancer cell survival, dissemination and resistance to drug therapy. Numerous stimuli, including DNA damage pathways and internal metabolic stress, as well as signaling from external growth factors, cell–matrix interactions and communication from other cells, can cause increased protein amplification. Moreover, these stimuli can alter the tumor microenvironment, thus over-activating the pathway and leading to tumor progression, as other studies have shown.Citation37,Citation38 Studies have demonstrated that miR-1/miR-133a regulates the MAPK pathway by inhibiting the phosphorylation of extracellular regulated protein kinases, which are involved in the metastasis of colorectal carcinoma.Citation39,Citation40 The regulation of actin cytoskeleton signaling pathways is identified as a cancer-related factor in multiple cancer datasets. Many key proteins are involved in this pathway, including WASP family proteins, Arp2/3 complexes, LIM-kinases, cofilin and cortactin. These proteins are regulated by miR-143 and overexpressed in multiple cancers, and can promote the migration, invasion and metastasis of cancer cells.Citation41–Citation44 The p53 gene plays an important role in various functional activities, such as avoiding the accumulation of damaged DNA, maintaining genomic stability, regulating cell differentiation by inducing cell cycle arrest, promoting apoptosis and DNA repair senescence. Cell division and proliferation will be uncontrolled if the p53 gene is damaged by cancer-induced factors.Citation45,Citation46 Increasing evidence has highlighted the important roles of miRNAs in mediating tumor suppression functions of p53. Sachdeva et al have reported that miR-145 is involved in the regulation of the dynamic balance between p53, a tumor suppressor, and c-Myc, a proto-oncogene, so as to maintain normal cell growth and proliferation. The downregulation of miR-145 expression will subsequently trigger cell malignancy.Citation47
Notably, it is found that many genes are targeted by multiple hub miRNAs. For example, GPM6A, LASP1 and TAGLN2 are targeted by at least four hub miRNAs (Table S3). GPM6A has been shown in previous studies to promote the aggressiveness of lymphoid leukemia by inducing cell migration.Citation48 Zhao et al demonstrated that LASP1 might promote liver, gut and mesentery metastases by using an orthotopic xenograft mouse model of pancreatic ductal adenocarcinoma, the upregulation of which was closely related to poor prognosis for pancreatic ductal adenocarcinoma patients.Citation9 In this study, TAGLN2 was randomly selected for further verification. The results suggested that TAGLN2 expression was significantly higher in tumor tissue than in adjacent normal bladder tissue, and increased TAGLN2 expression also significantly increased the risk of advanced TNM stages, indicating that these genes may be closely associated with the development of BC. Thus, further studies regarding BC initiation and progression should be conducted on these genes independently from the proposed miRNAs.
Finally, the potential prognostic value of hub miRNAs was validated based on miRNA expression profiles in BC patients, as well as their survival information in the TCGA database. Seven out of the 11 hub miRNAs (including hsa-miR-133a-1, has-miR-133b, has-miR-143, has-miR-195 and hsa-miR-145) were found to be closely associated with the overall survival for BC patients.
Conclusion
To summarize, a key module significantly associated with BC progression has been confirmed in this study. Hub miRNAs within this module may play vital roles in the initiation and progression of BC, and may therefore be candidates for functional studies. Moreover, they were found to regulate a variety of cancer-related pathways at the functional level, such as pathways in cancer, regulation of actin cytoskeleton, MAPK, Wnt, proteoglycans in cancer, focal adhesion and p53-associated cellular signaling pathways, as well as cell proliferation and various cancer-related genes. In addition, some miRNAs were also found to be associated with overall survival for BC patients. Our study not only provides new insights into the initiation and progression of BC, but also identifies new potential biomarkers and therapeutic targets. Nonetheless, further studies are still needed.
Acknowledgments
This study was supported by grants from the National Natural Science Foundation of China (81370853 and 81570613) to RPJ, and Research and Innovation Program for Graduates of Jiangsu Province (CXZZ13_0583), Jiangsu Provincial Medical Youth Talent (QNRC2016073), Key Program of Science and Technology Foundation from Nanjing Medical University (2016NJMUZD042), and Natural Science Foundation of Jiangsu Province (BK20170135) to YZG.
Disclosure
The authors report no conflicts of interests in this work.
References
- JemalABrayFCenterMMFerlayJWardEFormanDGlobal cancer statisticsCA Cancer J Clin2011612699021296855
- KnowlesMAHurstCDMolecular biology of bladder cancer: new insights into pathogenesis and clinical diversityNature Reviews Cancer2015151254125533674
- YafiFAAprikianAGChinJLContemporary outcomes of 2287 patients with bladder cancer who were treated with radical cystectomy: a Canadian multicentre experienceBJU Int2011108453954521166753
- NargundVHTanabalanCKKabirMNManagement of non-muscle-invasive (superficial) bladder cancerSemin Oncol201239555957223040252
- ShelleyMDMasonMDKynastonHIntravesical therapy for superficial bladder cancer: A systematic review of randomised trials and meta-analysesCancer Treat Rev201036319520520079574
- WilsonRCDoudnaJAMolecular mechanisms of RNA interferenceAnnu Rev Biophys20134221723923654304
- KentOAMendellJTA small piece in the cancer puzzle: microRNAs as tumor suppressors and oncogenesOncogene20062546618817028598
- RaskLBalslevESøkildeRDifferential expression of miR-139, miR-486 and miR-21 in breast cancer patients sub-classified according to lymph node statusCell Oncol (Dordr)201437321522725027758
- ZhaoTRenHLiJLASP1 is a HIF1α target gene critical for metastasis of pancreatic cancerCancer Res201575111111925385028
- GuXFuCLinLmiR-124 and miR-9 mediated downregulation of HDAC5 promotes neurite development through activating MEF2C-GPM6A pathwayJ Cell Physiol2017233167368728332716
- DuYYZhaoLMChenLThe tumor-suppressive function of miR-1 by targeting LASP1 and TAGLN2 in esophageal squamous cell carcinomaJ Gastroenterol Hepatol201631238439326414725
- DraytonRMDudziecEPeterSReduced expression of miRNA-27a modulates cisplatin resistance in bladder cancer by targeting the cystine/glutamate exchanger SLC7A11Clin Cancer Res20142071990200024516043
- EissaSHabibHAliEKotbYEvaluation of urinary miRNA-96 as a potential biomarker for bladder cancer diagnosisMed Oncol201532117
- HirataHUenoKShahryariVOncogenic miRNA-182–5p Targets Smad4 and RECK in Human Bladder CancerPLoS One2012711e5105623226455
- YuHPeiDChenLZhouXZhuHIdentification of key genes and molecular mechanisms associated with dedifferentiated liposarcoma based on bioinformatic methodsOncoTargets Ther20171030173027
- KangLTaoXHeBSMicroRNA expression profiles predict progression and clinical outcome in lung adenocarcinomaOnco Targets Ther201695679569227695346
- GiuliettiMOcchipintiGPrincipatoGPivaFIdentification of candidate miRNA biomarkers for pancreatic ductal adenocarcinoma by weighted gene co-expression network analysisCell Oncol (Dordr)201740218119228205147
- VoineaguIWangXJohnstonPTranscriptomic analysis of autistic brain reveals convergent molecular pathologyNature2011474735138038421614001
- National Institutes of HealthThe Cancer Genome Atlas Available from: https://cancergenome.nih.gov/Accessed March 23, 2017
- RobinsonMDMccarthyDJSmythGKedgeR: a Bioconductor package for differential expression analysis of digital gene expression dataBioinformatics201026113914019910308
- LangfelderPHorvathSWGCNA: an R package for weighted correlation network analysisBMC Bioinformatics2008955919114008
- DupuisJGeometric interpretation of gene coexpression network analysisPLoS Comput Biol200848e100011718704157
- YipAMHorvathSGene network interconnectedness and the generalized topological overlap measureBMC Bioinformatics200782217250769
- LangfelderPLuoROldhamMCHorvathSIs my network module preserved and reproducible?PLoS Comput Biol201171e100105721283776
- LangfelderPHorvathSEigengene networks for studying the relationships between co-expression modulesBMC Syst Biol2007115418031580
- DeweyFEPerezMVWheelerMTGene coexpression network topology of cardiac development, hypertrophy, and failureCirc Cardiovascu Genet2011412635
- AgarwalVBellGWNamJWBartelDPPredicting effective microRNA target sites in mammalian mRNAseLife20154e05005
- UhlenMOksvoldPFagerbergLTowards a knowledge-based Human Protein AtlasNat Biotechnol201028121248125021139605
- ShannonPMarkielAOzierOCytoscape: a software environment for integrated models of biomolecular interaction networksGenome Res200313112498250414597658
- YamasakiTYoshinoHEnokidaHMolecular targets regulated by tumor suppressive microRNA-1 and microRNA-133a in bladder cancerInt J Oncol20124061821183022378464
- KawakamiKEnokidaHChiyomaruTThe functional significance of miR-1 and miR-133a in renal cell carcinomaEur J Cancer201248682783621745735
- PatronJPFendlerABildMMiR-133b targets antiapoptotic genes and enhances death receptor-induced apoptosisPLoS One201274e3534522532850
- KaraMYumrutasOOzcanODifferential expressions of cancer-associated genes and their regulatory miRNAs in colorectal carcinomaGene20155671818625925209
- LiuBQuJXuFMiR-195 suppresses non-small cell lung cancer by targeting CHEK1Oncotarget20156119445945625840419
- AlmeidaMINicolosoMSZengLStrand-specific miR-28–5p and miR-28–3p have distinct effects in colorectal cancer cellsGastroenterology2012142488689622240480
- GomesSESimõesAESPereiraDMCastroRERodriguesCMPBorralhoPMmiR-143 or miR-145 overexpression increases cetuximab-mediated antibody-dependent cellular cytotoxicity in human colon cancer cellsOncotarget2016789368938726824186
- BurottoMChiouVLLeeJMKohnECThe MAPK pathway across different malignancies: a new perspectiveCancer2014120223446345624948110
- KimEKChoiEJCompromised MAPK signaling in human diseases: an updateArch Toxicol201589686788225690731
- XuLZhangYWangHZhangGDingYZhaoLTumor suppressor miR-1 restrains epithelial-mesenchymal transition and metastasis of colorectal carcinoma via the MAPK and PI3K/AKT pathwayJ Transl Med201412111224387290
- WangHAnHWangBmiR-133a represses tumour growth and metastasis in colorectal cancer by targeting LIM and SH3 protein 1 and inhibiting the MAPK pathwayEur J Cancer201349183924393523968734
- LiuWLiCXuYTopologically inferring risk-active pathways toward precise cancer classification by directed random walkBioinformatics201329172169217723842813
- YamaguchiHCondeelisJRegulation of the actin cytoskeleton in cancer cell migration and invasionBiochim Biophys Acta20071773564265216926057
- LiDHuJSongHmiR-143–3p targeting LIM domain kinase 1 suppresses the progression of triple-negative breast cancer cellsAm J Transl Res2017952276228528559978
- LiuRYangMMengYTumor-suppressive function of miR-139–5p in esophageal squamous cell carcinomaPLoS One2013810e7706824204738
- EldeiryWSTokinoTVelculescuVEWAF1, a potential mediator of p53 tumor suppressionCell19937548178258242752
- LevineAJMomandJFinlayCAThe p53 tumour suppressor geneNature19983516326453456
- SachdevaMZhuSWuFp53 represses c-Myc through induction of the tumor suppressor miR-145Proc Natl Acad Sci U S A200910693207321219202062
- CharfiCEdouardERassartEIdentification of GPM6A and GPM6B as potential new human lymphoid leukemia-associated oncogenesCell Oncol (Dordr)201437317919124916915