
Abstract
Introduction
Osteosarcoma is a malignant primary bone cancer and is lethal to children and adolescents. Recently, the dysregulation of long noncoding RNAs (lncRNAs) has been shown in various types of cancers.
Aim
The present study aimed to examine the role of the lncRNA prostate cancer-associated transcript 1 (PCAT1) in osteosarcoma progression.
Materials and methods
The expression levels of relevant genes in clinical samples and cell lines were determined by quantitative real-time polymerase chain reaction. Cell proliferation, invasion and migration were examined by CCK-8 assay, transwell invasion and migration assay, respectively. Cell apoptosis and cell cycle were detected by flow cytometry. Protein levels were detected by Western blot.
Results
Our results showed that PCAT1 was upregulated in osteosarcoma tissues when compared to normal bone tissues. PCAT1 was also upregulated in osteosarcoma cell lines when compared to normal bone cell line. The upregulation of PCAT1 was significantly associated with advanced clinical stage, tumor metastasis and shorter overall survival in patients with osteosarcoma. In vitro studies showed that overexpression of PCAT1 in MG-63 cells enhanced cell proliferation, cell invasion and migration and epithelial-to-mesenchymal transition (EMT); decreased cell apoptotic rate; and also caused an increase in cell population at S phase with a decrease in cell population at G0/G1 phase. Knockdown of PCAT1 in U2OS cells suppressed cell proliferation, cell invasion and migration, and EMT; increased cell apoptotic rate; and caused an increase in the cell population at G0/G1 phase with a decrease in cell population at S phase.
Conclusion
Taken together, our results suggest the oncogenic role of PCAT1 in osteosarcoma progression.
Introduction
Osteosarcoma is a malignant primary bone cancer, and it occurs mainly in children and adolescents.Citation1 The incidence of osteosarcoma is approximately 30 new cases per million worldwide annually.Citation2,Citation3 Because osteosarcoma is highly aggressive and rapidly metastasizes, the patients with osteosarcoma have a poor survival with a 5-year survival rate of <20%.Citation4 The treatments for osteosarcoma were mainly surgery, chemotherapy and palliative radiotherapy.Citation5 However, the efficacy of these treatments is quite limited, and the diagnosis of osteosarcoma is also restricted due to the poor understanding of the molecular mechanisms underlying osteosarcoma progression. Therefore, more investigation should be carried out to identify novel biomarkers and therapeutic targets for the treatment of osteosarcoma.
Recently, the roles of long noncoding RNAs (lncRNAs) in cancer progression have been intensively investigated due to the diverse cellular functions (cell growth, metastasis, apoptosis, differentiation) of lncRNAs.Citation6,Citation7 The lncRNAs are a class of endogeneous RNA with more than 200 nucleotides in length and cannot code proteins.Citation8 The dysregulation of lncRNAs has been implicated in various types of cancers. The lncRNA HOTAIR is very important in cancer progression and is found to reprogram chromatin state to promote cancer metastasis such as colorectal cancer, liver cancer and breast cancer.Citation9–Citation11 Studies also found that the lncRNA HULC cooperates with MALAT1 to aggravate liver cancer stem cells growth through telomere repeat-binding factor 2.Citation12 The lncRNA TUG1 overexpression promotes cervical cancer cell proliferation and migration.Citation13 The newly discovered lncRNA prostate cancer-associated transcript 1 (PCAT1) was identified in prostate cancer and was associated with prostate cancer progression.Citation14 Later on, the role of PCAT1 was identified in other types of cancers including colorectal cancer, esophageal squamous carcinoma, bladder cancer, liver cancer and lung cancer, and PCAT1 was upregulated in these cancer tissues and overexpression of PCAT1 promoted cancer progression,Citation15–Citation18 suggesting the oncogenic roles of PCAT1 in the cancer progression. As far as we know, the role of PCAT1 in osteosarcoma progression remains unknown. In this regard, it is important for us to characterize the role of PCAT1 in the osteosarcoma development.
In this study, we explored the potential role of PCAT1 in osteosarcoma progression by using clinical samples and osteosarcoma cell lines. The expression levels of PCAT1 in osteosarcoma tissues and normal bone tissues were examined by quantitative real-time polymerase chain reaction (qRT-PCR), and the relationship between PCAT1 expression levels and clinicopathological features was also explored. In addition, the effects of PCAT1 on cell proliferation, cell invasion, cell migration, epithelial-to-mesenchymal transition (EMT), cell apoptosis and cell cycle in osteosarcoma cell lines were also explored by the gain/loss-of-functional assays.
Materials and methods
Clinical sample collection and patient follow-up study
All the clinical samples were collected from 30 patients with osteosarcoma in Tianjin Medical University General Hospital between 2012 and 2016. The osteosarcoma tissues or adjacent normal bone tissues were collected from patients who underwent surgical intervention. All the procedures were approved by the Ethics Committee of Beijing Luhe Hospital Capital Medical University, and written informed consent was also obtained from the all 30 enrolled patients. None of the patients had chemotherapy or radiotherapy prior to surgical intervention. The clinicopathological features including sex, age, tumor size, tumor location, clinical stage and tumor metastasis are shown in . After the surgical intervention, the patients were further followed up every 2–4 months for 5 years. Physical examination, imageological diagnosis and laboratory tests were carried out at every visit. Overall survival of these patients was calculated from diagnosis to death. The date of the patient’s last completed follow-up examination should be used as the date of dropout.
Table 1 The clinicopathological parameters of 30 patients with osteosarcoma and the relationship between PCAT1 expression level and clinicopathological characteristics
Cell lines and cell culture
The normal bone cell line NHost and osteosarcoma cell lines, including LM7, KHOS, MG-63 and U2OS, were all purchased from the ATCC company (Manassas, VA, USA). All the cell lines were kept in the Dulbecco’s Modified Eagle’s Medium (DMEM; Thermo Fisher Scientific, Waltham, MA, USA) supplemented with 10% fetal bovine serum (FBS; Thermo Fisher Scientific) at 37°C with 95% CO2.
Plasmids, siRNAs and transfection
The pcDNA3.1 plasmids and PCAT1-overexpressing plasmids, pcDNA3.1-PCAT1, were commercially synthesized by GenePharma (Shanghai, People’s Republic of China). The siRNA for knocking down PCAT1 and its corresponding scrambled siRNA were purchased from RiboBio (Guangzhou, People’s Republic of China). All the in vitro transfections were performed with Lipofectamine 2000 Reagent (Invitrogen, Carlsbad, CA, USA) based on the protocols provided by the manufacturer. At 48 h post-transfection, cells were processed for further experimentation.
Quantitative real-time PCR
Total RNA was extracted from osteosarcoma tissues or cell lines (at 48 h after transfection) by using TRIzol reagent (Invitrogen). The RNA was reversely transcribed by using the cDNA Synthesis Kit (Takara, Dalian, People’s Republic of China). Then, the expression levels of PCAT1 were examined using the SYBR-Green PCR Master Mix kit (Takara) and the ABI7500 real-time PCR system (Applied Biosystems, Foster City, CA, USA). GAPDH was used as an internal control. The primers used were as follows: PCAT1, forward, 5′-TTGTGGAAGCCCCGCAAGGCCTG AA-3′, reverse, 5′-TGTGGGGCCTGCACTGGCACTT-3′; N-cadherin, forward, 5′-CGAGCCGCCTGCGCTGCC AC-3′, reverse, 5′-CGCTGCTCTCCGCTCCCCGC-3′; vimentin, forward, 5′-TACAGGAAGCTGCTGGAA GG-3′, reverse, 5′-ACCAGAGGGAGTGAATCCAG-3′; E-cadherin, forward, 5′-TACGCCTGGGACTCCACCTA-3′, reverse, 5′-CCAGAAACGGAGGCCTGAT-3′; GAPDH, forward, 5′-CGGAGTCAACGGATTTGGTCGTAT-3′, reverse, 5′-AGCCTTCTCCATGGTGGTGAAGAC-3′. The expression levels of relevant genes were calculated using the comparative Ct method.
Cell proliferation assay
After transfection (pcDNA3.1, pcDNA3.1-PCAT1, scrambled siRNA or PCAT1 siRNA), cells were seeded in 96-well plates, and at 0, 24, 48, 72 and 96 h post-transfection, cell proliferation was measured with a Cell Counting Kit-8 kit (Dojindo Laboratories, Kamimashiki-gun, Japan) according to the manufacturer’s instructions. The OD values were measured at a wavelength of 450 nm with a Gen5 microplate reader (BioTek, Winooski, VT, USA).
Cell invasion and migration assay
At 48 h after transfection (pcDNA3.1, pcDNA3.1-PCAT1, scrambled siRNA or PCAT1 siRNA), cells were seeded in the upper chamber of an insert (8 μm pore size; Corning Costar, Corning, NY, USA) containing DMEM medium without FBS (for invasion assay, the insert was coated with Matrigel; for the migration assay, the insert had no Matrigel coating), and the lower chamber contained the DMEM medium supplemented with 10% FBS. After incubation for 24 h, the cells remaining on the upper membrane were removed with a cotton swab, and the cells that invaded through the membrane were fixed with methanol and 0.1% crystal violet, and examined under a light microscope.
Cell apoptosis and cell cycle assay
At 48 h after transfection (pcDNA3.1, pcDNA3.1-PCAT1, scrambled siRNA or PCAT1 siRNA), the transfected cells were trypsinized and cell apoptosis was detected using the Annexin V-FITC Apoptosis Detection Kit (BD Biosciences, San Jose, CA, USA). Cells were pelleted and washed with cold PBS suspended with cold PB, and the cells were then treated with Annexin V-propidium iodide (PI) in the dark at room temperature according to the manufacturer’s instructions. The cells were subjected to flow cytometry analysis (FACSCalibur, BD Biosciences). For cell cycle analysis, the transfected cells were fixed with 70% ethanol overnight and stained with PI in the presence of Ribonuclease A (Takara) for 30 min at room temperature. The cell cycle distribution was analyzed by flow cytometry (FACSCalibur).
Western blot assay
At 48 h after transfection (pcDNA3.1, pcDNA3.1-PCAT1, scrambled siRNA or PCAT1 siRNA), proteins from cells were extracted by using RIPA protein extraction reagent supplemented with a protease inhibitor cocktail (Roche, Basel, Switzerland). The concentration of proteins was measured by a Bio-Rad protein assay kit (Bio-Rad, Hercules, CA, USA). In total, 50 μg of protein was separated by 10% sodium dodecyl sulfate-polyacrylamide gel electrophoresis, and then transferred to nitrocellulose membranes (Sigma-Aldrich Co., St Louis, MO, USA). The membranes were blocked with 5% skim milk for 1 h at room temperature, and the membranes were incubated with 1:1,000 rabbit anti-N-cadherin antibody, 1:1,000 rabbit anti-vimentin antibody, 1:1,000 rabbit anti-E-cadherin antibody and 1:2,000 rabbit anti-β-actin antibody (Abcam, Cambridge, UK) overnight at 4°C. After washing with TBST buffer, the membranes were incubated with horseradish peroxidase link-coupled secondary antibody at room temperature for 1 h. The ECL kit was used to visualize the bands, and the intensity of the bands was quantified by densitometry (Quantity One software, Bio-Rad).
Statistical analysis
All the statistical analyses were performed by using the SPSS software. All the data were expressed as mean ± SEM. The categorical data (clinicopathological data) were examined by chi-square test, and the continuous data were examined by Student’s t-test or one-way analysis of variance. Survival curve was analyzed by the Kaplan–Meier method, and the statistical significance was tested by long-rank test. The predictors of overall survival determined in univariate analysis were further confirmed by multivariate analysis using the Cox’s proportional hazards model. The statistical analysis was considered to be significant when P-values were <0.05.
Results
PCAT1 was upregulated in osteosarcoma tissues and was correlated with several clinical features in patients with osteosarcoma
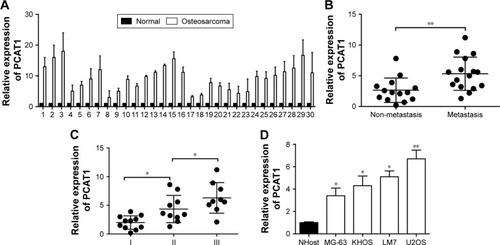
As far as we know, the role of PCAT1 was not examined in the osteosarcoma; thus, we first performed qRT-PCR experiments to look at the expression levels of PCAT1 in osteosarcoma tissues and also made a comparison to the expression levels of PCAT1 in normal adjacent bone tissues in 30 patients with osteosarcoma. In , the qRT-PCR results showed that the expression levels of PCAT1 in osteosarcoma tissues were significantly higher than those in their respective normal adjacent bone tissues. Further, the expression levels of PCAT1 in osteosarcoma tissues were divided into “low expression level of PCAT1” and “high expression level of PCAT1” according to the mean values of PCAT1 expression in osteosarcoma tissues, and the association between PCAT1 expression level and the clinicopathological features in these patients was explored. In , the results showed that the expression level of PCAT1 was not significantly correlated with sex, age, tumor size or the location of osteosarcoma, while high expression of PCAT1 was positively correlated with advanced clinical stage and tumor metastasis. In addition, the expression levels of PCAT1 were also significantly higher in patients with metastatic osteosarcoma when compared to those in patients with non-metastatic osteosarcoma (), and the expression levels of PCAT1 were significantly higher in patients with advanced clinical stage (). After the upregulation of PCAT1 was confirmed in osteosarcoma tissues, the expression levels of PCAT1 in osteosarcoma cell lines were also examined by qRT-PCR. In , the results showed that PCAT1 was highly upregulated in the osteosarcoma cell lines including KHOS, MG-63, LM7 and U2OS when compared to the normal bone cell line NHost.
Figure 1 The expression levels of PCAT1 in osteosarcoma tissues and cell lines. (A) The comparison of PCAT1 expression levels between normal adjacent bone tissues and osteosarcoma tissues from 30 patients with osteosarcoma. The PCAT1 expression levels were measured by qRT-PCR. (B) qRT-PCR analysis of PCAT1 expression levels in osteosarcoma tissues from patients with non-metastasis (n=13) or metastasis (n=17) osteosarcoma. (C) qRT-PCR analysis of PCAT1 expression levels in osteosarcoma tissues from patients with different clinical stages (I=11, II=10, III=9). (D) The expression levels of PCAT1 in normal bone cell lines and osteosarcoma cell lines as determined by qRT-PCR, N=3. Significant differences among groups were determined by Student’s t-test or one-way analysis of variance followed by Tukey’s multiple comparison test. *P<0.05, **P<0.01.
High expression level of PCAT1 in osteosarcoma tissues predicted poor prognosis in patients with osteosarcoma
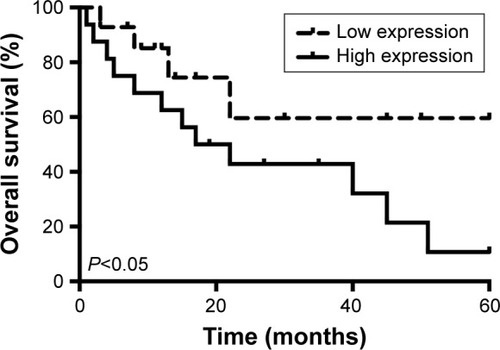
The overall survival in these recruited 30 patients was also followed. We compared the overall survival rates of patients with high expression level of PCAT1 to those of patients with low expression level of PCAT1 by using the Kaplan–Meier survival curves, and shows that patients with high expression level of PCAT1 in osteosarcoma tissues had shorter survival rates when compared to patients with low expression level of PCAT1 in osteosarcoma tissues (). In addition, we also performed the Cox regression analysis to evaluate the significance of PCAT1 as a prognostic factor in osteosarcoma progression. In the univariate analysis, sex, age, tumor size and tumor location were not correlated with the overall survival rate in patients with osteosarcoma, whereas clinical stage, tumor metastasis and PCAT1 were significantly associated with overall survival rate in patients with osteosarcoma (). Multivariate analysis demonstrated that only metastasis and high expression level of PCAT1 were correlated with the overall survival rate of patients with osteosarcoma, and clinical stage was not significantly correlated with the overall survival rate (). Taken together, PCAT1 may be an important prognostic factor for the clinical outcomes in patients with osteosarcoma.
Table 2 Univariate and multivariate analyses of factors related with overall survival in patients with osteosarcoma patients
Figure 2 Kaplan–Meier’s survival analysis in patients with osteosarcoma. The high expression of PCAT1 was positively correlated with shorter overall survival rate in patients with osteosarcoma.
Effects of PCAT1 on cell proliferation, invasion and migration in osteosarcoma cells
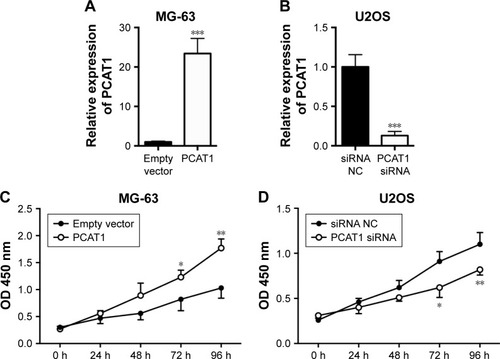
To further understand the molecular mechanisms of PCAT1 underlying osteosarcoma development, we performed a series of gain/loss-of-function assays including CCK-8 assay, transwell invasion assay and Transwell migration assay. As shown in , the results showed that the expression level of PCAT1 in MG-63 cells transfected with pcDNA3.1-PCAT1 plasmid was significantly higher than that in MG-63 cells transfected with pcDNA3.1 plasmid, suggesting the PCAT1-overexpressing MG-63 cells were successfully achieved by pcDNA3.1-PCAT1 plasmid transfection. As shown in , the results showed that the expression level of PCAT1 in U2OS cells transfected with PCAT1 siRNA was significantly lower than that in U2OS cells transfected with scrambled siRNA, suggesting that the downregulation of PCAT1 in osteosarcoma cells was achieved by PCAT1 siRNA transfection. For the CCK-8 assay, at 72 and 96 h post-transfection, the cell growth index was significantly higher in MG-63 cells transfected with pcDNA3.1-PCAT1 plasmids compared to cells transfected with pcDNA3.1 (), while the cell growth index was significantly lower in U2OS cells transfected with PCAT1 siRNA than that in U2OS cells transfected with scrambled siRNA ().
Figure 3 Effects of PCAT1 on cell proliferation in osteosarcoma cells. qRT-PCR analysis of PCAT1 expression levels in (A) MG-63 cells transfected with pcDNA3.1 plasmid or pcDNA3.1-PCAT1 plasmid, and in (B) U2OS cells transected with scrambled siRNA or PCAT1 siRNA. CCK-8 assay analysis of cell proliferation in (C) MG-63 cells transfected with pcDNA3.1 plasmid or pcDNA3.1-PCAT1 plasmid, and in (D) U2OS cells transfected with scrambled siRNA or PCAT1 siRNA. N=3. Significant differences among groups were determined by Student’s t-test. *P<0.05, **P<0.01, ***P<0.001.
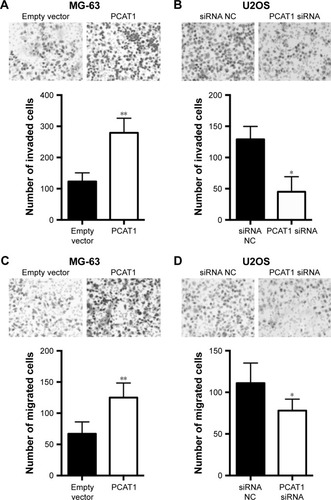
The Transwell invasion assay showed that the number of invaded cells in PCAT1-overexpressing MG-63 cells was significantly increased when compared to negative control group (transfected with pcDNA3.1 plasmid, ), while the number of invaded cells in PCAT1-knockdown U2OS cells was significantly decreased when compared to control group (transfected with scrambled siRNA, ). Further, Transwell migration assay showed that overexpression of PCAT1 in MG-63 cells significantly increased the number of migrated cells when compared to control group (), and downregulation of PCAT1 in U2OS cells significantly decreased the number of migrated cells when compared to control group ().
Figure 4 Effects of PCAT1 on cell invasion and migration in osteosarcoma cells. Transwell invasion assay analysis of cell invasion in (A) MG-63 cells transfected with pcDNA3.1 plasmid or pcDNA3.1-PCAT1 plasmid and in (B) U2OS cells transfected with scrambled siRNA or PCAT1 siRNA. Transwell migration assay analysis of cell migration in (C) MG-63 cells transfected with pcDNA3.1 plasmid or pcDNA3.1-PCAT1 plasmid and in (D) U2OS cells transfected with scrambled siRNA or PCAT1 siRNA. N=3. Significant differences among groups were determined by Student’s t-test. *P<0.05, **P<0.01.
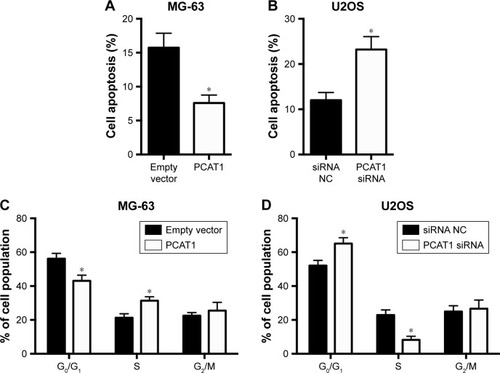
Effects of PCAT1 on cell apoptosis and cell cycle in osteosarcoma cells
The effects of PCAT1 on cell apoptosis and cell cycle in osteosarcoma cells were analyzed by flow cytometry assay. As shown in , PCAT1 overexpression in MG-63 cells significantly reduced the percentage of apoptotic cells when compared to control group, while as shown in , the results showed that downregulation of PCAT1 in U2OS cells significantly increased the percentage of apoptotic cells when compared to control group. Cell cycle analysis showed that overexpression of PCAT1 in MG-63 cells decreased the cell population at G0/G1 phase and increased the cell population at S phase (), and downregulation of PCAT1 in U2OS cells increased the cell population at G0/G1 phase and decreased the cell population at S phase ().
Figure 5 Effects of PCAT1 on cell apoptosis and cell cycle in osteosarcoma cells. Flow cytometry assay analysis of cell apoptosis in (A) MG-63 cells transfected with pcDNA3.1 plasmid or pcDNA3.1-PCAT1 plasmid and in (B) U2OS cells transfected with scrambled siRNA or PCAT1 siRNA. Flow cytometry analysis of cell cycle in (C) MG-63 cells transfected with scrambled pcDNA3.1 plasmid or pcDNA3.1-PCAT1 plasmid and in (D) U2OS cells transfected with scrambled siRNA or PCAT1 siRNA. N=3. Significant differences among groups were determined by Student’s t-test. *P<0.05.
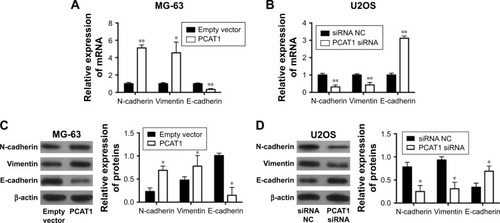
Effects of PCAT1 on EMT in osteosarcoma cells
The effects of PCAT1 on the expression of EMT-related markers were determined by qRT-PCR and Western blot. The qRT-PCR results showed that MG-63 cells transfected with pcDNA3.1-PCAT1 had higher mRNA expression levels of N-cadherin and vimentin, and lower mRNA expression level of E-cadherin when compared to control group (), and U2OS cells transfected with PCAT1 siRNA had lower mRNA expression levels of N-cadherin and vimentin, and higher mRNA expression level of E-cadherin (). Western blot results showed that overexpression of PCAT1 in MG-63 cells increased the protein levels of N-cadherin and vimentin, and decreased the protein level of E-cadherin (), while downregulation of PCAT1 in U2OS cells decreased the protein levels of N-cadherin and vimentin, and increased the protein level of E-cadherin ().
Figure 6 Effects of PCAT1 on EMT in osteosarcoma cells. qRT-PCR analysis of the mRNA expression levels of N-cadherin, vimentin and E-cadherin in (A) MG-63 cells transfected with pcDNA3.1 plasmid or pcDNA3.1-PCAT1 plasmids and in (B) U2OS cells transected with scrambled siRNA or PCAT1 siRNA. Western blot analysis of protein levels of N-cadherin, vimentin and E-cadherin in (C) MG-63 cells transfected with pcDNA3.1 plasmid or pcDNA3.1-PCAT1 plasmid and in (D) U2OS cells transected with scrambled siRNA or PCAT1 siRNA. N=3. Significant differences among groups were determined by Student’s t-test. *P<0.05, **P<0.01.
Discussion
In the present study, we for the first time identified the potential role of PCAT1 in osteosarcoma progression. Our results found that PCAT1 was upregulated in osteosarcoma tissues when compared to normal bone tissues. The upregulation of PCAT1 was significantly associated with advanced clinical stage and tumor metastasis. The Kaplan–Meier analysis further showed that high expression of PCAT1 predicts shorter overall survival of patients with osteosarcoma. The univariate and multivariate analyses demonstrated that tumor metastasis and high expression of PCAT1 were predictors of shorter overall survival of patients with osteosarcoma. In vitro studies showed that overexpression of PCAT1 in MG-63 cell enhanced cell proliferation, cell invasion and cell migration; increased cell apoptosis; altered cell cycle; and also promoted EMT, while knockdown of PCAT1 in U2OS cell exerted the opposite effects. Taken together, our results suggest the oncogenic role of PCAT1 in osteosarcoma progression.
The expression levels of PCAT1 in clinical samples have been revealed in various types of cancers. In the colorectal cancer, the PCAT1 transcripts were expressed at higher levels in most tumor tissues compared with the non-tumor tissues, and overexpression of PCAT1 is a novel biomarker of poor prognosis in patients with colorectal cancer.Citation19 In esophageal squamous carcinoma, PCAT1 was upregulated in esophageal squamous carcinoma tissues as compared to the paired normal tissues, and upregulation of PCAT1 correlates with advanced clinical stage and poor prognosis in esophageal squamous carcinoma.Citation15 In human hepatocellular carcinoma (HCC), PCAT1 expression in HCC tissues was significantly increased compared with adjacent non-tumor tissues, and PCAT1 upregulation may serve as a novel biomarker of poor prognosis in HCC patients.Citation20 In gastric cancer, PCAT1 expression was elevated in gastric cancer tissues and cell lines, and PCAT1 levels were highly positively correlated with invasion depth, TNM stages and lymphatic metastasis.Citation21 In agreement with previous studies, our data showed that PCAT1 was upregulated in osteosarcoma tissues and upregulation of PCAT1 was correlated with advanced clinical stage, tumor metastasis and shorter overall survival in patients with osteosarcoma. However, the limitation of the clinical data was small sample size, and more samples from patients with osteosarcoma may be collected and analyzed in the future studies.
In in vitro studies, PCAT1 was found to be upregu-lated in a series of cancer cell lines, including HCC cell lines, gastric cell lines, colorectal cancer cell lines and lung cancer cell lines. In HCC, PCAT1 suppression using PCAT1 small hairpin RNA in HepG2 and Bel-7402 cells inhibited cell proliferation and migration.Citation22 In the gastric cell lines, PCAT1 knockdown through shRNA in AGS and MGC-803 cells inhibited cell proliferation, migration and invasion by regulating CDKN1A.Citation23 In lung cancer, PCAT1 overexpression promotes proliferation and metastasis in non-small-cell lung cancer cells.Citation17 Consistently, our results showed that overexpression of PCAT1 increased cell proliferation, invasion and migration, while knockdown of PCAT1 inhibited cell proliferation, invasion and migration, suggesting the oncogenic role of PCAT1 in osteosarcoma cells. To gain further knowledge on underlying molecular mechanisms, flow cytometry experiments were also performed, and overexpression of PCAT1 decreased the cell apoptotic rate and also caused a decrease in the cell population at G0/G1 phase with an increase in cell population at S phase, while downregulation of PCAT1 played the opposite role. Consistently, downregulation of PCAT1 was found to induce cell apoptosis and alter cell cycle in colorectal cancer cells and bladder cancer cells,Citation16,Citation24 while upregulation of PCAT1 inhibited cell apoptosis in liver cancer cells.Citation22
EMT is a conserved cellular process, which is characterized by loss of cell polarity in epithelial cells and developing characteristics of interstitial cells, which can invade and migrate through the body, and EMT has been regarded as an important mechanism of tumor metastasis. The EMT-related metastasis has been demonstrated in the various studies for osteosarcoma.Citation25–Citation28 EMT can be observed by detecting the epithelial markers, such as E-cadherin, and mesenchymal markers, such as vimentin and N-cadherin. In the present study, qRT-PCR and Western blot were used to detect the expression of EMT markers in experimental cells, and our results confirmed that overexpression of PCAT1 promoted EMT and downregulation of PCAT1 suppressed EMT in osteosarcoma cells. Though the effects of PCAT1 were not examined in previous studies, other lncRNAs were found to exert their regulatory role in osteosarcoma via EMT. Overexpression of GAS5 was found to suppress EMT in osteosarcoma,Citation29 and downregulation of HNF1A-AS1 was found to suppress EMT in osteosarcoma,Citation30 and inhibitory effects of SPRY4-IT1 on cell migration and invasion were partly associated with EMT process in osteosarcoma cells.Citation31 Collectively, these results suggested that the effects of PCAT1 on cell invasion and migration may be associated with ETM in the osteosarcoma.
In summary, the present study demonstrated high upregulation of PCAT1 in osteosarcoma tissues was associated with poor prognosis. In addition, PCAT1 promoted cell proliferation, invasion, migration and EMT in osteosarcoma. The results of present studies suggest the oncogenic role of PCAT1 in osteosarcoma progression.
Acknowledgments
The authors would like to thank Dr Zhou for his help with the data analysis with SPSS software.
Disclosure
The authors report no conflicts of interest in this work.
References
- SiegelRLMillerKDJemalACancer statistics, 2016CA Cancer J Clin201666173026742998
- BielackSSHecker-NoltingSBlattmannCKagerLAdvances in the management of osteosarcomaF1000Res20165276727990273
- HeXGaoZXuHZhangZFuPA meta-analysis of randomized control trials of surgical methods with osteosarcoma outcomesJ Orthop Surg Res2017121528086937
- LindseyBAMarkelJEKleinermanESOsteosarcoma overviewRheumatol Ther201741254327933467
- DurfeeRAMohammedMLuuHHReview of osteosarcoma and current managementRheumatol Ther20163222124327761754
- BeckZTXingZTranEJLncRNAs: bridging environmental sensing and gene expressionRNA Biol201613121189119627700226
- ChuCQuKZhongFLArtandiSEChangHYGenomic maps of long noncoding RNA occupancy reveal principles of RNA-chromatin interactionsMol Cell201144466767821963238
- ChenRWangGZhengYHuaYCaiZLong non-coding RNAs in osteosarcomaOncotarget2017812204622047528103585
- DouJNiYHeXDecreasing lncRNA HOTAIR expression inhibits human colorectal cancer stem cellsAm J Transl Res2016819810827069543
- GaoJZLiJDuJLLiXLLong non-coding RNA HOTAIR is a marker for hepatocellular carcinoma progression and tumor recurrenceOncol Lett20161131791179826998078
- MilevskiyMJAl-EjehFSaunusJMLong-range regulators of the lncRNA HOTAIR enhance its prognostic potential in breast cancerHum Mol Genet201625153269328327378691
- WuMLinZLiXHULC cooperates with MALAT1 to aggravate liver cancer stem cells growth through telomere repeat-binding factor 2Sci Rep201663604527782152
- HuYSunXMaoCUpregulation of long noncoding RNA TUG1 promotes cervical cancer cell proliferation and migrationCancer Med20176247148228088836
- PrensnerJRIyerMKBalbinOATranscriptome sequencing across a prostate cancer cohort identifies PCAT-1, an unannotated lincRNA implicated in disease progressionNat Biotechnol201129874274921804560
- ShiWHWuQQLiSQUpregulation of the long noncoding RNA PCAT-1 correlates with advanced clinical stage and poor prognosis in esophageal squamous carcinomaTumour Biol20153642501250725731728
- LiuLLiuYZhuangCInducing cell growth arrest and apoptosis by silencing long non-coding RNA PCAT-1 in human bladder cancerTumour Biol201536107685768925934337
- ZhaoBHouXZhanHLong non-coding RNA PCAT-1 overexpression promotes proliferation and metastasis in non-small cell lung cancer cellsInt J Clin Exp Med2015810184821848726770456
- RenYShangJLiJThe long noncoding RNA PCAT-1 links the microRNA miR-215 to oncogene CRKL-mediated signaling in hepatocellular carcinomaJ Biol Chem201729243179391794928887306
- GeXChenYLiaoXOverexpression of long noncoding RNA PCAT-1 is a novel biomarker of poor prognosis in patients with colorectal cancerMed Oncol201330258823640607
- YanTHYangHJiangJHPrognostic significance of long non-coding RNA PCAT-1 expression in human hepatocellular carcinomaInt J Clin Exp Pathol2015844126413126097602
- CuiWCWuYFQuHMUp-regulation of long non-coding RNA PCAT-1 correlates with tumor progression and poor prognosis in gastric cancerEur Rev Med Pharmacol Sci201721133021302728742205
- WenJXuJSunQXingCYinWUpregulation of long non coding RNA PCAT-1 contributes to cell proliferation, migration and apoptosis in hepatocellular carcinomaMol Med Rep20161354481448627035680
- BiMYuHHuangBTangCLong non-coding RNA PCAT-1 over-expression promotes proliferation and metastasis in gastric cancer cells through regulating CDKN1AGene201762633734328571676
- QiaoLLiuXTangYZhaoZZhangJFengYDown regulation of the long non-coding RNA PCAT-1 induced growth arrest and apoptosis of colorectal cancer cellsLife Sci2017188374428855110
- YangGYuanJLiKEMT transcription factors: implication in osteosarcomaMed Oncol201330469723975634
- WangYWangHZhouRBaicalin inhibits human osteosarcoma cells invasion, metastasis, and anoikis resistance by suppressing the transforming growth factor-beta1-induced epithelial-to-mesenchymal transitionAnticancer Drugs201728658158728379900
- JiangRZhangCLiuGGuRWuHMicroRNA-126 inhibits proliferation, migration, invasion, and EMT in osteosarcoma by targeting ZEB1J Cell Biochem2017118113765377428379605
- ShenSHuangKWuYA miR-135b-TAZ positive feedback loop promotes epithelial-mesenchymal transition (EMT) and tumorigenesis in osteosarcomaCancer Lett2017407324428823959
- YeKWangSZhangHHanHMaBNanWLong noncoding RNA GAS5 suppresses cell growth and epithelial-mesenchymal transition in osteosarcoma by regulating the miR-221/ARHI pathwayJ Cell Biochem2017118124772478128519068
- CaiLLvJZhangYLiJWangYYangHThe lncRNA HNF1A-AS1 is a negative prognostic factor and promotes tumorigenesis in osteosarcomaJ Cell Mol Med201721112654266228866868
- XuJDingRXuYEffects of long non-coding RNA SPRY4-IT1 on osteosarcoma cell biological behaviorAm J Transl Res20168125330533728078006