
Abstract
Background
Leucine-rich α-2-glycoprotein-1 (LRG1) is differentially expressed in many kinds of diseases including cancer, however, it has not been thoroughly studied yet.
Purpose
The objective of this study was to detect the expression and potential mechanism of LRG1 in colorectal cancer (CRC). In our study, we examined LRG1 levels in CRC tissue and plasma with quantitative real-time polymerase chain reaction and enzyme-linked immunosorbent assay, respectively. The effect of LRG1 on cancer cells was detected with transwell and MTT assays.
Results
The average plasma LRG1 level in CRC was significantly higher than in polyp group (P=0.002) and healthy controls (P<0.001). Second, plasma LRG1 was positively associated with CA19-9 (r=0.133, P=0.039) and neutrophil ratio (r=0.403, P<0.001). Third, plasma LRG1 of stage IV patients was dramatically different from that of stage I, stage II or stage III patients (P<0.001). LRG1 mRNA expression levels were about 2-fold higher in CRCs compared to normal tissues (P<0.001). And levels of plasma LRG1 were found to be a risk factor in CRC in univariate survival analysis of colorectal prognosis (P=0.013, hazard ratio [HR]=1.803, 95% CI: 1.521–2.137), and multivariate analysis showed that LRG1 was an independent risk factor (P<0.001, HR=1.492, 95% CI: 1.223–1.820). The patients with higher plasma LRG1 value presented with poorer outcome (P=0.013). Functional experiments showed that LRG1 could promote the invasion and growth ability of cells. LRG1 was increased in plasma and tissue compared with that of controls and LRG1 may predict prognosis of CRC patients and LRG1 maybe a tumor promoter.
Conclusion
LRG1 is increased in CRC patients and might serve as a tumor promoter.
Introduction
Colorectal cancer (CRC) is the third most common cancer in males and females, with an estimated 135,430 new cases and 50,260 deaths in the USA in 2017.Citation1 The overall incidence of CRC is 5% in the general population, and the 5-year survival rate ranges from 40% to 60%. In recent years, the morbidity and mortality of CRC have risen in the Chinese population. CRC is a complicated process, beginning as a benign adenomatous polyp that develops into an advanced adenoma with high-grade dysplasia and finally progresses to malignant cancer.Citation2 While advancement in diagnostic techniques and treatment strategies, including surgery, radio-, and chemotherapy, have led to earlier detection and increased survival, treatment decisions are still made almost exclusively based on the cancer’s clinicopathological stage at diagnosis. Therefore, the search for new bio-markers to facilitate early diagnosis and individualized treatment is particularly warranted. It is urgent to search for specific, sensitive biomarkers to prevent the development of colorectal adenomas that are the precursors of invasive CRCs and to predict prognosis.
Human leucine-rich α-2-glycoprotein-1 (LRG1) is a plasma glycoprotein of 312 amino acids in length and having a predicted unmodified molecular weight of 34–36 kD.Citation3 The normal plasma concentration of LRG1 is about 21–50 μg/mL.Citation4 Although many research have indicated its role in cell adhesion,Citation5 granulocytic differentiation,Citation6 and cell migration,Citation7 the function of LRG1 is awaiting to be elucidated. Besides, LRG1 is involved in transforming growth factor beta receptor (TGF-βR) II pathway signalingCitation8 and is proposed to play a role in cell survival and apoptosis.Citation4 Recently, Choi et al performed comparative proteomic analysis of adenomatous polyps and CRC plasma proteins using a combination of two-dimensional gel electrophoresis (2DE) and mass spectrometry (MS).Citation9 But the number of included patients was relatively small and no healthy controls were studied. In this study, to further detect the role of LRG1 in CRC, we investigated the expression of LRG1 in a larger number of patients with CRC, adenomatous polyps and in healthy controls, and we studied the role of LRG1 in prognosis of CRC. Besides, the effect of LRG1 on CRC cells is studied.
Materials and methods
Plasma and tissue samples
Data of 240 patients with pathology-proven CRC, diagnosed between January 2008 and September 2013 in the 2nd Affiliated Hospital of Harbin Medical University, were collected upon presentation and during follow-up. Related data of 108 colorectal pathology-proven adenomatous polyp patients and 110 healthy controls were also collected.
Plasma of patients with CRC or benign adenomatous polyps were obtained from peripheral blood on the day of surgery or colonoscopy. Plasma from 110 healthy subjects, matched for gender and age, were used as normal controls. All plasma were stored at −70°C until use. Two hundred and forty primary tumor samples and their corresponding, non-tumorous tissues were obtained from colon cancer patients immediately after resection during surgery. All tissues were snap frozen in liquid nitrogen within 30 min of resection and stored in the vapor phase of liquid nitrogen. Written informed consent was obtained for blood and tissue sampling from each patient. The research was in compliance with the Declaration of Helsinki. The design of this work was approved by the ethical committees of the 2nd Affiliated Hospital of Harbin Medical University.
Cell culture
The human HCT116 or SW620 colon cancer cells were obtained from the American Type Culture Collection bank and maintained in Roswell Park Memorial Institute 1640 or L15 medium (GIBCO Laboratories, Grand Island, NY, USA) that was supplemented with 10% fetal bovine serum, 100 U/mL penicillin G, and 100 μg/mL streptomycin (GIBCO Laboratories) at 37°C in a humidified incubator containing 5% CO2. In our experiments, the Olympus microscope (Olympus, Shanghai, China) was used.
Clinical evaluation and laboratory assessment
The following clinical data were collected and analyzed: gender, age, plasma carcinoembryonic antigen (CEA), CA19-9 and neutrophil ratio. Data of tumor, node, metastasis (TNM) staging, tumor size, and tumor pathological types were from the department of pathology in the 2nd Affiliated Hospital of Harbin Medical University. The patients were followed up in our outpatient clinic specified for CRC and the primary end point was defined as death.
Enzyme-linked immunosorbent assay (ELISA)
The abundances of plasma LRG1 proteins were confirmed by ELISA. Commercial kits purchased from Uscn Life Science Inc. (Wuhan, China) were used for determination of LRG1 measurements and analysis was performed according to the manufacturer’s instructions.Citation9 The quality control information is shown in http://www.cloud-clone.com/manual/ELISA-Kit-for-Leucine-Rich-Alpha-2-Glycoprotein-1-(LRG1)-SEB934Hu.pdf.
Quantitative real-time polymerase chain reaction (qRT-PCR)
Total RNA was extracted from tissues with TRIzol reagents (Invitrogen, Carlsbad, CA, USA) according to the manufacturer’s protocol.Citation10 Thereafter, 1 μg of RNA from each sample was reverse transcribed into complementary DNA (cDNA) using random primers with PCR machine (Thermo Fisher Scientific, Waltham, USA), and the cDNA was subjected to qRT-PCR for LRG1. RT-PCR was performed with the SYBR green Premix Ex TaqII (Takara, Dalian, China) with Applied Bio-systems Step One Plus RT-PCR system (Applied Bio-systems, Carlsbad, CA, USA). Actin was used as the endogenous control for detection of LRG1 mRNA expression. Relative quantification analysis was performed using the comparative CT (2^ΔΔCT) method. Primer information used in the study are as follows: LRG1: forward: 5′-ACCCCGTTTCATCCATCCAT-3′; reverse: 5′-CTCAGCTGGAAGGAAGGACA-3′ (Sangon Biotech, Shanghai, China). Actin: forward: 5′TACCTCATGAAGATCCTCACC3′; reverse: 5′TTTCGTGGATGCCACAGGAC-3′ (Sangon Biotech).
Oligonucleotide synthesis and transfection
The LRG1 siRNA was synthesized by the Gene Pharma Company (Shanghai, China). siRNA sequence: 5′-GCCCAGGGGGCAUUCAACCTT-3′. SW620 or HCT116 cells were transfected with LRG1 siRNA using X-tremeGENE siRNA Transfection Reagent (Roche, Shanghai, China). LRG1 cDNA without its 3′-UTR (1,044 bp) was ligated to pcDNA3.1(+) (Invitrogen) to construct the recombinant vector pcDNA3.1(+)-LRG1. LRG1 was amplified using forward: 5′-GAGGATCCATGTCCTCTTGGAGCAG-3′; reverse: 5′-CCGAATTCCCTGGTCTCACTGGGAC-3′ (Gene Pharma Company) as primers. The final product was ligated BamHI/EcoRI into pcDNA3.1(+). HCT116 cells were transfected with pcDNA3.1(+)-LRG1 or empty vector using Lipofectamine 2000 transfection reagent (Invitrogen) according to the manufacturer’s instructions.
Stable transfection of pcDNA3.1(+)-LRG1
HCT116 cells were seeded at a density of 3×10⁵ cells in a 60 mm plate and grown to 60% confluency in growth media. The cells were transfected with pcDNA3.1(+)-LRG1 using the Lipofectamine 2000 transfection reagent (Invitrogen). Stable cell lines were selected with 900 μg/mL G418 (Sigma, Shanghai, China), and positive clones were identified by western blot.
Transwell assay
To examine the migratory ability of cells in vitro, transwell chamber assay was used. A total of 2×10⁵ HCT116 cells were placed in the upper compartment of a 24-well transwell unit with 8 μm polycarbonate nucleopore filters (Corning Costar, Cambridge, MA, USA). For the invasion assay, 2×10⁵ cells were plated in the top chamber with a Matrigel-coated membrane (24-well insert, 8 μm pore size; BD Biosciences, Franklin Lakes, NJ, USA). Cells were plated in the medium without serum, and the medium supplemented with 10% serum was used as a chemoattractant in the lower chamber. The cells were incubated for 24–36 h. Cells that did not invade through the pores, were removed by a cotton swab. Filters were fixed with 90% ethanol, stained with 0.1% crystal violet (Beyotime Institute of Biotechnology, Shanghai, China), and photographed. Cell numbers were counted.
MTT assay
Cell viability was determined using a MTT (Beyotime Institute of Biotechnology) assay. One thousand HCT116 cells or stable transfection cell lines were seeded in 96-well culture plates in culture medium. After 24 h, the cells were transfected with LRG1 siRNA. MTT assays were performed 24, 48, and 72 h after treatment. At the time of the assay, the cells were stained with 20 μL MTT (5 mg/mL) (Sigma) at 37°C for 4 h and subsequently were solved in 150 μL dimethyl sulfoxide (Beyotime Institute of Biotechnology). Absorbance was measured at 490 nm using a microtiter plate reader (TECAN, Männedorf, Switzerland).
Western blot analysis
After rinsing with PBS, the cells were lysed in ice for 30 min in lysis buffer (Beyotime Institute of Biotechnology) containing a cocktail protease inhibitor (Roche). After centrifuging at 12,000 g for 15 min, the supernatant was extracted and saved at −80°C. Protein samples were electrophoresed on a 10% sodium dodecyl sulfate gel and transferred to polyvinylidene difluoride membrane at 300 mA for 2 h. The blots were blocked in blocking buffer (0.1% Tween-20 in PBS containing 5% non-fat dry milk, pH 7.4) for 2 h. Afterward, the membrane was incubated overnight with the corresponding antibodies in blocking buffer at 4°C: LRG1 antibody (HPA001888, rabbit polyclonal; Sigma, St Louis, MO, USA) or Actin antibody (sc-1616, goat polyclonal; Santa Cruz Biotechnology, Dallas, TX, USA). After washing with PBST thrice, the blots were incubated with secondary antibody (1:40,000) (Santa Cruz Biotechnology) in PBST for 2 h at room temperature. The blots were washed again thrice in PBST buffer and transferred proteins were detected with an enhanced chemiluminescence detection kit (Applygen, Beijing, China).
Statistical analysis
Statistical software SPSS 20.0 (SPSS, Chicago, IL, USA) was used for statistical analysis. Quantitative data were expressed as mean ± SD, or median with range (minimum, maximum). For comparison of clinical and pathological features of patients, the Student’s t-test, one-way analysis of variance, and non-parametric test were used. Kaplan–Meier curves were used to analyze the patients’ prognosis. Survival analysis was performed using the log-rank test. Results were expressed as hazard ratio (HR) with 95% confidence intervals. Statistical significance was considered as P<0.05.
Results
General data of patients and controls
The general data of patients with CRC are shown in . Gender and age were comparable among patients with CRC, patients with colorectal polyps and healthy controls (138/102 vs 66/42 vs 65/45, P=0.815; 60.0±10.4 vs 58.9±10.7 vs 58.4±10.7, P=0.409).
Table 1 Summary of the clinicopathologic features of CRC, adenoma, and healthy controls
Plasma LRG1 levels in patients and controls, and associations between plasma LRG1 levels and clinical, laboratory, and colorectal histopathological parameters in patients with colorectal cancer
The average plasma LRG1 level in CRC group was significantly higher than the polyp group (47.6±11.7 μg/mL vs 43.8±6.01 μg/mL, P=0.002) and healthy controls (47.6±11.7 μg/mL vs 39.3±12.1 μg/mL, P<0.001). The average plasma LRG1 level in polyp group was also higher than that in healthy controls (43.8±6.01 μg/mL vs 39.3±12.1 μg/mL, P<0.001; ).
Figure 1 (A) Plasma LRG1 concentrations were detected in 240 colorectal cancer patients, 108 adenomatous polyp patients, and 110 control patients.
Abbreviations: CRC, colorectal cancer; ELISA, enzyme-linked immunosorbent assay; LRG1, leucine-rich α-2-glycoprotein-1.
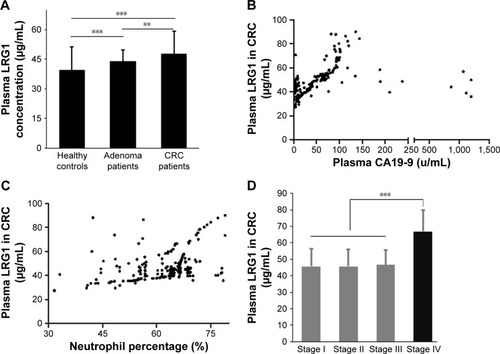
There was no significant difference of plasma LRG1 between male and female CRC patients (47.6±11.2 μg/mL vs 47.66±12.3 μg/mL, P=0.708). No significant association existed between plasma LRG1 level and age (r=−0.055, P=0.396). Plasma LRG1 was positively associated with CA19-9 (r=0.133, P=0.039; ) and neutrophil ratio (r=0.403, P<0.001; ). There was no obvious association between plasma LRG1 and CEA (r=−0.046, P=0.482).
In colorectal pathological data, plasma LRG1 in different TNM stages of CRC was as follows: 45.7±10.8 μg/mL in stage I, 45.7±10.3 μg/mL in stage II, 46.5±9.0 μg/mL in stage III, and 67.0±12.9 μg/mL in stage IV. Plasma LRG1 of stage IV patients was dramatically different from that of stage I, stage II or stage III patients (P<0.001; ). The colonic and rectal groups had almost the same plasma LRG1 (46.8±11.9 μg/mL vs 48.4±11.5 μg/mL, P=0.281). Moreover, there was no significant difference of plasma LRG1 among well-differentiated tumors, moderately differentiated tumors, and poorly differentiated tumors (47.8±10.6 μg/mL vs 47.3±11.5 μg/mL vs. 47.1±12.1 μg/mL, P=0.747). No obvious correlation between plasma LRG1 and tumor size was found either (r=−0.106, P=0.103).
Tissue LRG1 mRNA expression in CRC tissues
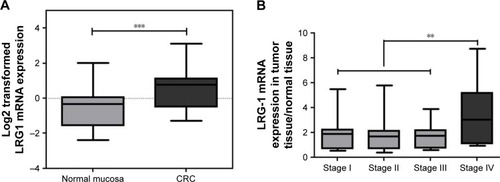
LRG1 mRNA expression levels were about 2-fold higher in CRC compared with normal tissues (P<0.001; ). The expression of LRG1 mRNA in stage IV was dramatically higher than in stage I, II, and III (P=0.002), while there was no significant difference of LRG1 levels among stage I, II and III (P=0.696; ). There was no significant difference of the average levels of the tissue LRG1 between colon cancer and rectal cancer (r=−0.006, P=0.921). Additionally, there was no significant difference of the tissue LRG1 mRNA expression among tumors having well differentiation level (2.0±0.7), moderate differentiation level (1.7±1.1), and poor differentiation level (2.0±1.8; P=0.412). LRG1 mRNA expression was not correlated with tumor size (r=−0.053, P=0.416).
Figure 2 (A) LRG1 mRNA expression was examined by qRT-PCR in 240 human colorectal cancer tissues and their adjacent normal mucosa tissues.
Abbreviations: CRC, colorectal cancer; LRG1, leucine-rich α-2-glycoprotein-1; qRT-PCR, quantitative real-time polymerase chain reaction.
Association of plasma LRG1 levels and outcome in patients with colorectal cancer
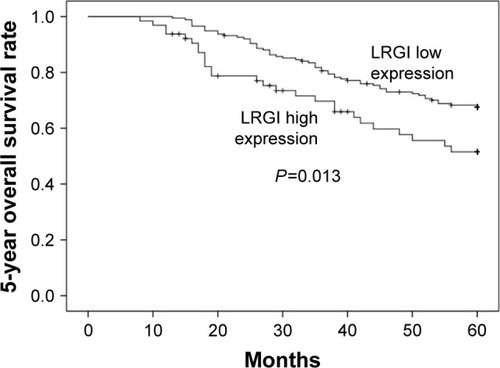
In our cohort study, patients with CRC were followed up for an average duration of 49 months (1–68 months). Level of plasma LRG1 was found to be a risk factor in CRC for univariate survival analysis of colorectal prognosis (P=0.013, HR=1.803, 95% CI: 1.521–2.137), and multivariate analysis showed that LRG1 was an independent risk factor (P<0.001, HR=1.492, 95% CI: 1.223–1.820). Other univariate risk factors included age, gender, and TNM stage.
Patients were divided into 2 groups according to their plasma LRG1 level based on less or higher than average value of normal controls (mean + SD, eg, 51.4 μg/mL). The patients with higher plasma LRG1 value presented with poorer outcome (P=0.013, ).
Figure 3 Survival analysis showed patients with higher LRG1 expression had shorter survival time compared with patients having lower LRG1 expression.
Abbreviation: LRG1, leucine-rich α-2-glycoprotein-1.
LRG1 promotes the migratory and growth ability of cells
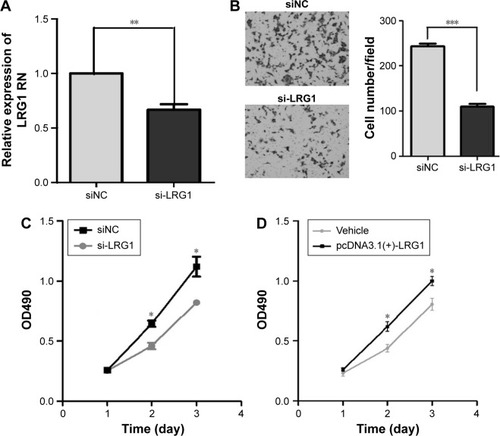
To uncover the functions of LRG1 in human colon cancer, we observed the effect of LRG1 on the migratory ability of colon cancer cells. We altered the expression of LRG1 through transient transfection of HCT116 cells with a LRG1 siRNA () or stable transfection with pcDNA3.1(+)-LRG1 plasmid. A transwell invasion assay showed that silencing LRG1 could significantly suppress the migratory ability of HCT116 cells (). MTT assays indicated silencing of LRG1 could inhibit and overexpression of LRG1 could promote the growth ability of HCT116 or SW620 cells (). These results suggest that LRG1 could promote the migratory and growth ability of cells.
Figure 4 LRG1 promotes the migratory and growth abilities in HCT116 cells.
Abbreviations: LRG1, leucine-rich α-2-glycoprotein-1; NC, negative control.
Discussion
LRG1 was found to be expressed at the lowest level in healthy controls, and at a higher level in CRC patients, as measured by ELISA. qRT-PCR results consistently showed that LRG1 mRNA was higher in CRC tissues compared with corresponding normal tissue, and stage IV CRC tissues have the highest LRG1 mRNA expression among all stages. Therefore, tissue LRG1 may contribute to the upregulation of LRG1 in plasma.
Although LRG1 is deregulated in many diseases, the biological functions and the site of origin of LRG are still obscure. Our results have shown here LRG1 may promote the migratory, invasive, and proliferative ability of colon cancer, and thus act as an oncogene. LRG1 maybe promoting invasion ability through TGFβ-1.Citation11 Also, LRG1 has an effect on cell growth as indicated by MTT assay. Part of this phenomenon is likely due to LRG1 playing a role in anti-apoptosis. Jemmerson et al found that MCF-7 breast cancer cells transfected with LRG1 are more resistant to apoptosis induction than non-transfected cells due to cytoplasmic LRG1 binding cytochrome c and inhibition of Apaf-1 activation.Citation12
Recently, Choi et al performed a comparative proteomic analysis of adenomatous polyps and CRC plasma proteins using a combination of 2DE and MS.Citation9 They discovered that LRG1 was about 1.5-fold higher in CRC group than adenoma group. In addition, a panel consisting of CEA, MAPRE1, IGFBP2, and LRG1 is increased in prediagnostic CRC plasmas.Citation13 We get consistent results with them. Additionally, serum LRG1 concentrations are significantly elevated in active ulcerative colitis patients compared with patients in remission and healthy controls.Citation14 Considering that inflammatory bowel disease (ulcerative colitis and Crohn’s disease) accounts for roughly two-thirds of the incidence of CRC,Citation15,Citation16 LRG1 may promote the transformation of ulcerative colitis to CRC.
LRG1 was initially defined as an “acute-phase protein” involved in systemic response to bacterial and viral infection,Citation17 but has since been found elevated in a variety of diseases, both malignant and benign.Citation4 LRG1 is also up-regulated in serum of patients with biliary tract cancer compared with benign disease and healthy controls.Citation18 The expression of LRG1 in ovarian cancer tissues and cell lines, examined by gene microarray, RT-PCR, western blot, immunocytochemistry, MS and ELISA assay, is upregulated.Citation12 Differential expression techniques employing affinity depletion of high abundance proteins and 2D electrophoresis have found serum LRG1 to be upregulated in lung cancer, pancreatic cancer, and bladder cancer.Citation19–Citation22 LRG1 is also dysregulated in some immune disorders. It is reported that iTRAQ (isobaric tags for relative and absolute quantitation) quantitative proteomic analysis and ELISA found that LRG1 is elevated in rheumatoid arthritis patients.Citation23 Our results demonstrate that there is a significant difference of LRG1 expression between healthy and stage I/II/and III CRCs, indicating a progressive increase of LRG1 in tissues as normal tissue changes to CRC tissue.
The hallmarks of cancer are self-sufficiency in growth signals, evading apoptosis, insensitivity to anti-growth signals, sustained angiogenesis, tissue invasion and metastasis, and limitless replicative potential.Citation24 The formation of new blood vessels by angiogenesis is a key feature of cancer. In one of the latest studies about LRG1, researchers found that in the presence of TGF-β, LRG1 is mitogenic to endothelial cells and promotes angiogenesis.Citation11 In our results, plasma LRG1 positively correlated with neutrophils. LRG1 is released from neutrophils and polymorphonuclear leukocytes, majority of which promote carcinogenesis during chronic inflammatory bowel diseases like colitis.Citation25 Neutrophil infiltration is a key event in chronic intestinal inflammation and associated CRC. Using a mouse model of colitis-associated cancer (CAC), Wang et al have demonstrated that infiltrated neutrophils produce large amounts of interleukin 1b that is critical for the development of CAC.Citation26 Together, LRG1 may play an important role during the development of colitis to CRC. Previous studies indicate that LRG1 may be an anti-apoptotic factor, allowing survival of cells in response to stress signals.Citation27 Thus LRG1 can promote the growth of tumors by inhibiting cell apoptosis. In addition, transformed granulocytic cells transfected with LRG1 were reported by Ai et al to be more viable than non-transfected cells when transferred between different media.Citation28 In our study, stage IV CRC had higher levels of LRG1 compared with stage I, II, and III CRC, which indicates that LRG1 can promote the migration of CRC. However, besides migration, there are other equally plausible, cell-intrinsic and/or extrinsic biological pathways to support tumor growth-angiogenesis, suppression of apoptosis, paracrine regulation, suppression of immunity, etc. We need further studies to evaluate the role of LRG1 in CRC.
As the mortality of CRC is high, it is very important to detect CRC early. However, distinguishing malignant disease from benign disease prior to surgery, and determining which patients would benefit from surgery will have a greater impact. As an adenomatous polyposis coli-interacting protein, increased plasma levels of LRG1 along with MAPRE1 and IGFBP2 preceded a diagnosis of CRC in females.Citation13 In our study, LRG1 has different expression among healthy controls, colorectal adenomatous polyps, and CRC. Moreover, LRG1 is positively correlated with CA19-9, indicating its role as a biomarker for detecting CRC.
Recent study shows that the expression of LRG1, along with serum amyloid A and C4-binding protein, could refine the prognosis of resected squamous cell lung cancer. In the present study, we evaluated the relationship of plasma LRG1 with prognosis in CRC and found that patients with higher LRG1 expression had shorter survival time compared with patients with lower LRG1 expression. Multivariate factors analysis showed that LRG1 is an independent risk factor of prognosis.
Acknowledgments
The study was supported by the National Natural Science Fund of China for Young (81702867), Heilongjiang Natural Science Fund of China for Young (QC2017095), and the Fundamental Research Funds for the Provincial Universities (2017LCZX66).
Disclosure
The authors report no conflicts of interest in this work.
References
- SiegelRLMillerKDJemalACancer statistics, 2017CA Cancer J Clin20176773028055103
- MarkowitzSDBertagnolliMMMolecular origins of cancer: molecular basis of colorectal cancerN Eng J Med200936124492460
- SchwickHGHauptHPurified human plasma proteins of unknown functionJpn J Med Sci Biol1981342993276173505
- WeivodaSAndersenJDSkogenAElisa for human serum leucine-rich alpha-2-glycoprotein-1 employing cytochrome c as the capturing ligandJ Immunol Methods2008336222918436231
- KobeBKajavaAVThe leucine-rich repeat as a protein recognition motifCurr Opin Struct Biol20011172573211751054
- O’DonnellLCDruhanLJAvalosBRMolecular characterization and expression analysis of leucine-rich alpha2-glycoprotein, a novel marker of granulocytic differentiationJ Leukoc Biol20027247848512223515
- SaitoKTanakaTKandaHGene expression profiling of mucosal addressin cell adhesion molecule-1+ high endothelial venule cells (hev) and identification of a leucine-rich hev glycoprotein as a hev markerJ Immunol20021681050105911801638
- SunDKarSCarrBIDifferentially expressed genes in tgf-beta 1 sensitive and resistant human hepatoma cellsCancer Lett19958973797882305
- ChoiJWLiuHShinDHProteomic and cytokine plasma biomarkers for predicting progression from colorectal adenoma to carcinoma in human patientsProteomics2013132361237423606366
- LiQZouCZouCMicrorna-25 functions as a potential tumor suppressor in colon cancer by targeting smad7Cancer Lett201333516817423435373
- WangXAbrahamSMcKenzieJALrg1 promotes angiogenesis by modulating endothelial tgf-beta signallingNature201349930631123868260
- AndersenJDBoylanKLJemmersonRLeucine-rich alpha-2-glycoprotein-1 is upregulated in sera and tumors of ovarian cancer patientsJ Ovarian Res201032120831812
- LaddJJBusaldTJohnsonMMIncreased plasma levels of the apc-interacting protein mapre1, lrg1, and igfbp2 preceding a diagnosis of colorectal cancer in womenCancer Prev Res20125655664
- SeradaSFujimotoMTerabeFSerum leucine-rich alpha-2 glycoprotein is a disease activity biomarker in ulcerative colitisInflamm Bowel Dis2012182169217922374925
- von RoonACReeseGTeareJConstantinidesVDarziAWTekkisPPThe risk of cancer in patients with crohn’s diseaseDis Colon Rectum20075083985517308939
- EadenJAAbramsKRMayberryJFThe risk of colorectal cancer in ulcerative colitis: a meta-analysisGut20014852653511247898
- BiniLMagiBMarzocchiBTwo-dimensional electrophoretic patterns of acute-phase human serum proteins in the course of bacterial and viral diseasesElectrophoresis1996176126168740187
- SandanayakeNSSinclairJAndreolaFA combination of serum leucine-rich alpha-2-glycoprotein 1, ca19-9 and interleukin-6 differentiate biliary tract cancer from benign biliary stricturesBr J Cancer20111051370137821970875
- OkanoTKondoTKakisakaTPlasma proteomics of lung cancer by a linkage of multi-dimensional liquid chromatography and two-dimensional difference gel electrophoresisProteomics200663938394816767791
- KakisakaTKondoTOkanoTPlasma proteomics of pancreatic cancer patients by multi-dimensional liquid chromatography and two-dimensional difference gel electrophoresis (2d-dige): up-regulation of leucine-rich alpha-2-glycoprotein in pancreatic cancerJ Chromatogr B Analyt Technol Biomed Life Sci2007852257267
- YuKHRustgiAKBlairIACharacterization of proteins in human pancreatic cancer serum using differential gel electrophoresis and tandem mass spectrometryJ Proteome Res200541742175116212428
- LindenMLindSBMayrhoferCProteomic analysis of urinary biomarker candidates for nonmuscle invasive bladder cancerProteomics20121213514422065568
- SeradaSFujimotoMOgataAItraq-based proteomic identification of leucine-rich alpha-2 glycoprotein as a novel inflammatory bio-marker in autoimmune diseasesAnn Rheum Dis20106977077419854709
- HanahanDWeinbergRAThe hallmarks of cancerCell2000100577010647931
- HofmanPMPathobiology of the neutrophil-intestinal epithelial cell interaction: role in carcinogenesisWorld J Gastroenterol2010165790580021154999
- WangYWangKHanGCNeutrophil infiltration favors colitis-associated tumorigenesis by activating the interleukin-1 (il-1)/il-6 axisMucosal Immunol2014751106111524424523
- ShiraiRGotouRHiranoFIkedaKInoueSAutologous extracellular cytochrome c is an endogenous ligand for leucine-rich alpha2-glycoprotein and beta-type phospholipase a2 inhibitorJ Biol Chem2010285216072161420442399
- AiJDruhanLJHunterMGLovelandMJAvalosBRLrg-accelerated differentiation defines unique g-csfr signaling pathways downstream of pu.1 and c/ebpepsilon that modulate neutrophil activationJ Leukoc Biol2008831277128518272588