
Abstract
Background/purpose
Long non-coding RNAs (lncRNAs) have emerged as key molecules in initiation and progression of prostate cancer (PCa). In this study, we aimed to explore the role of lncRNA NAP1L6 in the development and progression of PCa.
Materials and methods
We identified that lncRNA NAP1L6 was over-expressed both in PCa tissues and cell lines by gene expression array profiling. The expression level of NAP1L6 in 75 PCa tissues and adjacent tissues was detected by RT-PCR. Next, the correlations between NAP1L6 expression and clinical features of patients with PCa were analyzed by paired t-test or chi-squared test, and its association with patient prognosis was assessed by the Kaplan–Meier method. The effects of NAP1L6 on PC-3 and 22RV1 cells were evaluated by Cell Counting Kit-8 (CCK-8), migration, invasion, and colony formation assays. Further analysis of the results of the microarray was performed to find downstream gene of NAP1L6. Cell function experiments were performed in order to explore the relationship between NAP1L6 and Inhibin-β A (INHBA) and the specific mechanism by which INHBA affects the development of PCa.
Results
Using microarray analysis, we identified 412 lncRNAs and 1245 mRNAs to be significantly differentially expressed in three PCa samples when compared with adjacent non-tumor tissues (ANTT) (fold-change ≥2.0 or ≤0.5, P<0.05, false discovery rate (FDR) <0.05). NAP1L6 expression was upregulated in PCa tissues and cell lines (both P<0.05) compared with ANTT. Besides, high expression level of NAP1L6 promotes PCa cell proliferation, migration, and invasion (all P<0.05), and is significantly associated with larger tumor diameter, distant metastasis, and shorter survival time (all P<0.05). We found that NAP1L6 promoted the expression of INHBA (P<0.05), and knockdown of NAP1L6 led to the reduction of PCa cell migration, invasion, and proliferation by regulating the expression of INHBA (all P<0.05).
Conclusion
lncRNA NR6A1 might play an oncogenic role in PCa initiation and progression by regulating the expression of INHBA, and might act as a novel prognostic biomarker for PCa treatment.
Introduction
Prostate cancer (PCa) was reported to be the most common disease that threatened the health of the male genitourinary system.Citation1 In the United States, the incidence of PCa was estimated to exceed that of lung cancer, becoming the first malignancy specific for males.Citation2 In China, the incidence of PCa and PCa-specific death has been increasing rapidly in the recent decades.Citation3 In order to reveal novel potential target for clinical treatment, numerous studies have explored the molecular mechanism of PCa development and progression.
Long non-coding RNA (lncRNA), which was identified as non-coding transcripts containing >200 nucleotides,Citation4–Citation6 participated in tumorigenesis and progression by affecting tumor cell proliferation, growth suppression, motility, immortality, angiogenesis, and viability.Citation7,Citation8 Similar to other malignancies, the regulating effect of lncRNA emerging in PCa gained increasing attention from oncologists and urologists.Citation9–Citation11
Nucleosome assembly protein 1 like 6 (NAP1L6), which contained 33.5 kb nucleotides and was located in Xq13.2, have not been reported in any tumor-related studies until now. In our study, we characterized the expression profile in PCa tissues and paired histologically normal tissues and PCa cells. Next, we demonstrated that NAP1L6 could influence the proliferation, migration, and invasion of PCa cells by regulating the expression of downstream gene Inhibin-β A (INHBA). From experimental results, NAP1L6 might be a potential novel molecular biomarker for the treatment of PCa.
Materials and methods
Microarray and computation analysis
Sample preparation and microarray hybridization were performed by Kangchen Bio-tech (Shanghai, China). Expression profiling of lncRNAs and protein-coding genes was performed using the Agilent human lncRNA+mRNA array V.2.0 platform (Agilent Technologies, Santa Clara, CA, USA). Three PCa tissues and corresponding adjacent non-tumor tissues (ANTT) were used for microarray analysis. The results of microarray analysis were used for exploring the candidate significant molecular target gene. We built lncRNA-protein-coding genes network to identify the interactions between protein-coding genes and lncRNA. For each gene–lncRNA, gene–gene, or lncRNA–lncRNA pair, we calculated the Pearson correlation coefficient and selected the significantly correlated pairs to construct the network.
Tissue collection
Seventy-five paired PCa and ANTT were obtained from patients who underwent radical prostatectomy at the Urology Department of the First Affiliated Hospital of Nanjing Medical University, China. All cases were confirmed as PCa based on histopathological evaluation. All collected specimens were immediately frozen in liquid nitrogen after surgery and stored at −80° C until further analysis. The clinical pathological characteristics of the PCa patients are summarized in . The use of human tissues was approved by the Medical Ethics Committee of the First Affiliated Hospital of Nanjing Medical University, China. Written informed consent was obtained from all of the subjects.
Table 1 Prostate cancer patients’ clinical features with regard to the relative expression of NAP1L6
Cells and culture conditions
Two human PC cell lines (PC3, 22RV1) and a normal myofibroblast stromal cell line (WPMY-1) were obtained from the Institute of Biochemistry and Cell Biology of the Chinese Academy of Sciences (Shanghai, China). 22RV1 cells were cultured in Roswell Park Memorial Institute (RPMI) 1640 medium (Gib-coBRL); WPMY-1 cells were cultured in DMEM (GibcoBRL) medium; PC3 cells were cultured in F12K (GibcoBRL) medium supplemented with 10% FBS, 100 U/mL penicillin, and 100 mg/mL streptomycin (Thermo Fisher Scientific, Waltham, MA, USA) in humidified air at 37°C with 5% CO2.
RNA extraction and quantitative RT-PCR (qRT-PCR) assays
Total RNA was extracted from tissues and cultured cell lines using Trizol reagent (Thermo Fisher Scientific) according to the manufacturer’s instructions. RNA was reverse transcribed to cDNA by using a Reverse Transcription Kit (Takara, Tokyo, Japan). According to the manufacturer’s instructions, reverse transcription was performed at 37°C for 15 min, and then at 85°C for 5 s and 4°C to the end of the experiment. Real-time PCR (RT-PCR) analyses were performed using a standard protocol from Power SYBR Green (Takara). The qRT-PCR reaction included an initial denaturation step of 10 min at 95°C, and 95°C (30 s), 95°C (5 s), and 61°C (30 s) for a total of 50 cycles with a final extension step at 72°C for 5 min. Results were normalized to the expression of β-actin. In NAP1L6, the forward and reverse primers used were 5′-CATGGCAGCTAGTGGGGAAA-3′-and 5′-TCACCGAACTGTAGGCGATG-3′, respectively. The forward and reverse primers for INHBA cDNA were 5′-CATTGCTCCCTCTGGCTATCAT-3′ and 5′-GCACACAGCACGATTTGAGGTT-3′, respectively. Our qRT-PCR results were analyzed and expressed relative to threshold cycle values, and then converted to fold-changes. Each sample was analyzed in triplicate.
Small interfering RNA transfection
Small interfering RNA (siRNA) that targeted NAP1L6 RNA and scrambled negative control was purchased from GenePharma (Shanghai, China). Synthetic sequence-scrambled siRNA was used as a negative control siRNA. Cells were plated and cultured in growth media until cell density reached 70% prior to siRNA transfection using Lipofectamine 2000 (Thermo Fisher Scientific) according to the manufacturer’s instructions. Cells were harvested after 48 h for qRT-PCR and Western blot analyses.
Plasmid constructs
The sequence of NAP1L6 was synthesized and subcloned into pCDNA3.1 (BioEasy, Shanghai, China) vector. Ectopic expression of NAP1L6 was achieved by using the pCDNA NAP1L6 transfection, and empty pCDNA vector (empty) was used as a control. The expression level of NAP1L6 was detected by qPCR. The gene sequence of plasmids used to stabilize/over-express NAP1L6 in PC3 cells is given in the supplementary material.
Cell proliferation assay
The proliferation assays were performed in E-Plate 96 using a real-time cell analyzer (ACEA Biosciences, San Diego, CA, USA). Cell counting kit-8 (CCK-8; Sigma-Aldrich Co., St Louis, MO, USA) was used to perform a cell proliferation assay. Transient transfected and negative control prostate cells were harvested 48 h after transfection, and then, 2,000 cells were cultured per well overnight. After the cells were adherent and after 24, 48, 72, and 96 h, 10 μL of CCK-8 was added to each well and cells were incubated at 37°C for another 4 h. Finally, the absorbance was measured at 490 nm. For each treatment group, experiments were repeated in triplicate.
Colony formation assay
For colony formation assay, a certain number of transfected cells were plated into each well of 6-well plates and maintained in proper media containing 10% FBS for 2 weeks, during which the medium was replaced every 4 days. Then, the cells were washed twice with phosphate buffer solution, fixed with methanol for 10 min, and stained with 0.1% crystal violet (Sigma-Aldrich Co.) for 30 min at room temperature. Visible colonies were then counted. Results were expressed as mean values from three independent experiments.
Cell migration and invasion assays
At 48 h after transfection, 2.5×10⁴ cells with 200 uL of serum-free medium were cultured in the upper chamber of the transwell (pore size, 8.0 μm; EMD Millpore) for migration and invasion assays with 10% Matrigel (BD Biosciences). Five hundred microliters of media containing 10% FBS was added to the lower chamber. The cells were incubated for 48 h at 37°C, and the cells that did not migrate through the pores of the transwell inserts were manually removed with a cotton swab. Subsequently, the cells that had migrated or invaded through the membrane were fixed in 4% paraformaldehyde and stained with 0.1% crystal violet (Sigma-Aldrich Co.). Five random high-power microscopic fields (200× magnification) per filter were photographed, and the number of cells was counted. All of the experiments were performed in triplicate.
Western blot analysis and antibodies
A lysis buffer containing the mammalian protein extraction reagent radioimmunoprecipitation Assay (RIPA) (Beyotime, Shanghai, China), a protease inhibitor cocktail (Hoffman-La Roche Ltd., Basel, Switzerland), and Phenylmethanesulfonyl fluoride (PMSF) (Hoffman-La Roche Ltd.) was used to lyse the cells after treatment. Proteins were separated by using 10% sodium dodecyl sulfate-polyacrylamide gel electrophoresis and transferred to 0.22 mm polyvinylidene difluoride membranes (Sigma-Aldrich Co.). The membranes were washed, blocked, and incubated with specific primary antihuman antibodies. The secondary antibody was horseradish peroxidase-conjugated goat anti-rabbit IgG. An electrochemiluminescence (ECL) chromogenic substrate was used to visualize the bands, and the intensity of the bands was quantified by densitometry (Quantity One software; Bio-Rad). Glyceraldehyde-3-phosphate dehydrogenase (GAPDH) antibody was used as a control, and p-PI3k, AKT, p-AKT, mTOR, p-mTOR, vimentin, β-catenin, E-cadherin (all 1:1,000) rabbit monoclonal antibodies were purchased from Cell Signaling Technology, Inc. and anti-INHBA antibody and anti-NAP1L6 antibody were purchased from Abcam (Cambridge, UK). The mean ± SD values were calculated from three individual experiments.
Statistical analysis
Results were expressed as mean ± SD. Statistical significance was tested by a Student’s t-test or a chi-squared test as appropriate. Patient survival was evaluated using the Kaplan–Meier method and compared using log-rank test. Univariate and multivariate Cox regression analyses were performed for survival data. Values of P<0.05 were considered statistically significant. All statistical calculations were performed using SPSS version 17.0 software (IBM).
Results
Expression profiles of lncRNAs and protein-coding genes among PCa patients
We performed microarray analysis to demonstrate the expression profiles of lncRNAs and protein-coding genes in PCa patients. From expression profiles, differentially expressed lncRNAs can be found between PCa and para-carcinoma tissue samples. Fold-change (tumor vs normal) and P-value were calculated from the normalized expression. The hierarchical clustering was performed based on the lncRNA expression values in the microarray. Using microarray analysis, we indentified 412 lncRNAs and 1245 mRNAs to be significantly differentially expressed in three PCa samples compared with ANTT samples (fold-change ≥2.0 or ≤0.5, P<0.05, FDR <0.05). Among these, 317 lncRNAs and 710 mRNAs were identified to be consistently upregulated in all the three PCa groups, and 95 lncRNAs and 535 mRNAs were consistently downregulated.
The novel lncRNA NAP1L6 expression in PCa
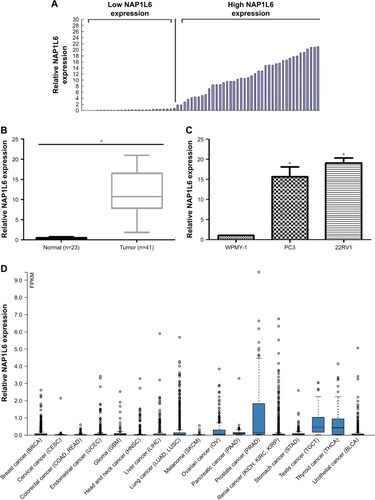
Based on the features of the differentially expressed lncRNAs from microarray data, we characterized a novel lncRNA, NAP1L6. qRT-PCR was utilized to profile NAP1L6 expression in PCa samples and cell lines. The result supported a strong consistency between the qRT-PCR result and microarray data (). NAP1L6 was significantly over-expressed in PCa tissues compared with ANTT (P<0.05, ). NAP1L6 was remarkably over-expressed in PC3 and 22RV1 cell lines (both P<0.05, ). To further validate our findings, data from the Cancer Genome Atlas (TCGA) databaseCitation12 were used to analyze the differential expression of NAP1L6 in different cancers. The results showed that NAP1L6 was upregulated in PCa ().
Figure 1 Relative NAP1L6 expression in PCa and its clinical significance. (A) According to the cut-off value of the relative NAP1L6 expression, relative low-NAP1L6 and high-NAP1L6 patients were 27 and 48, respectively. (B) Relative expression of NAP1L6 in PCa tissues. (C) Relative expression of NAP1L6 in PCa cell lines PC3 and 22RV1 compared with WPMY-1. (D) NAP1L6 was upregulated in PCa according to the TCGA data. Data represent the mean ± SD from three independent experiments. *P<0.05.
NAP1L6 expression and clinicopathological parameters in PCa
To assess the correlation of NAP1L6 expression with clinicopathological data, the expression levels of NAP1L6 in tumor tissues were categorized as low or high in relation to the cut-off value (). The clinical pathology findings of 75 prostate carcinoma patients are shown in . The high NAP1L6 expression group (n=48) showed larger tumor size and more distant metasatsis than the low NAP1L6 expression group (n=27; P<0.05). However, there was no significant correlation between NAP1L6 expression and other clinicopathological features, such as age, Gleason score, tumor stage, lymphatic metastasis, capsule invasion, or multiple lesions (all P>0.05; ).
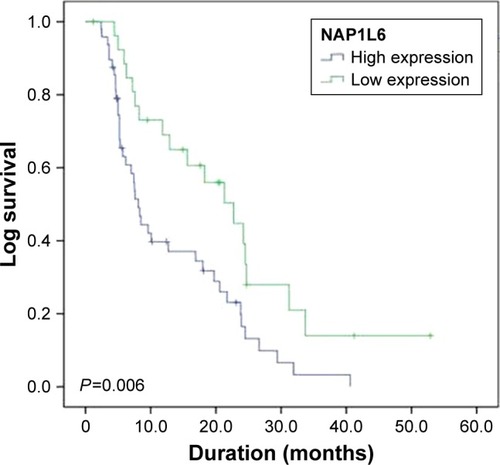
Figure 2 Kaplan–Meier survival curves of patients with prostate cancer based on NAP1L6 expression conditions. Patients in the high expression group exhibited significantly poorer prognosis (P=0.006, log-rank test).
Correlation between NAP1L6 expression and prognosis of PCa patients
We further explored whether NAP1L6 expression level was related to the outcome of PCa patients after radical prostatectomy. Biochemical recurrence-free survival time curves were plotted according to NAP1L6 expression level by the Kaplan–Meier method. As presented in , patients with high NAP1L6 expression level had poorer biochemical recurrence-free survival (log-rank test, P=0.006). Univariate analysis of biochemical recurrence-free survival revealed that the relative level of NAP1L6 expression (P=0.009) and tumor stage (P=0.012) were prognostic indicators (). Variables with a value of P<0.05 were selected for multivariate analysis. Multivariate analysis also demonstrated that NAP1L6 expression and tumor stage were independent prognostic indicators for biochemical recurrence-free survival in patients with PCa ().
Table 2 Univariate and multivariate Cox regression analyses were performed to analyze the survival data
siRNA-mediated knockdown and over-expression of NAP1L6 regulates cell proliferation
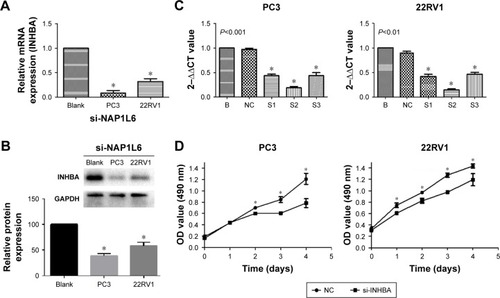
Since NAP1L6 was over-expressed in PCa tissues, we hypothesized that the biological functions of NAP1L6 might be involved in the control of cell proliferation. Therefore, CCK-8 assays were performed. The relative NAP1L6 expression level was significantly reduced by si-NAP1L6 and the s3 showed the highest inhibition efficiency of ~85.8% and ~84.3%, respectively, in PC3 and 22RV1 cell lines (P<0.05; ). Hence, we applied s3 to subsequent experiments. The results revealed that si-NAP1L6 transfection significantly decreased cell growth at 96 h (). To further verified the results above, we over-expressed NAP1L6 in PC3 cells with plasmid GV129 and the upregulation effect is shown in . The results of CCK-8 assays showed that high expression of NAP1L6 could promote the proliferation of PC3 cells (P<0.05; ). Moreover, colony formation assay demonstrated that downregulated NAP1L6 decreased the clonogenic ability of PC3 cells (P<0.05; ).
Figure 3 siRNA-mediated knockdown and over-expression of NAP1L6-regulated PCa cell proliferation. (A, B) Relative expression level of NAP1L6 in PC3 and 22RV1 cells was significantly decreased by si-NAP1L6. (C, D) CCK-8 assay determined the proliferation of si-NAP1L6-transfected PC3 and 22RV1 cells. (E) NAP1L6 expression in PC3 cells was significantly increased by GV219. (F) CCK-8 assay determined the proliferation of pcDNA-NAP1L6-transfected PC3 cells. Data represent the mean ± SD from three independent experiments. *P<0.05.
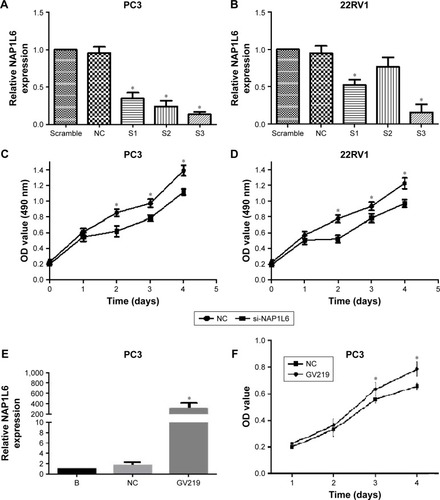
Figure 4 Colony-forming growth assay and invasion/migration assay using transwell chambers for PC3 and 22RV1. (A, B) Colony-forming growth determined the proliferation of si-NAP1L6-transfected PC3 and 22RV1 cells. (C, D) si-NAP1L6 could decrease the migration capacity of PCa cells. (E, F) si-NAP1L6 could decrease the invasion capacity of PCa cells. (G–K) Western blot protein expression levels in PC3 and 22RV1 cells after si-NAP1L6 transfection. GAPDH protein was internal control. Data represent the mean ± SD from three independent experiments. *P<0.05.
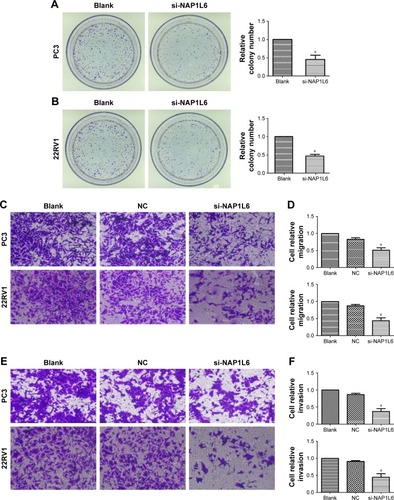
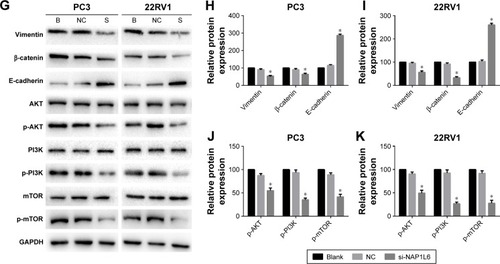
Knockdown of NAP1L6 inhibited cell migration and invasion
We explored the effect of NAP1L6 knockdown on PCa cell migration/invasion. Transwell invasion assay was performed and the results demonstrated that knockdown of NAP1L6 inhibited PC3 and 22RV1 cell migration (P<0.05, ) and invasiveness (P<0.05, ). Considering that the invasion and migration of malignancy were related to the epithelial–mesenchymal transition (EMT) and PI3K/AKT/mTOR signaling pathway, Western blot assay was performed to investigate the effects of NAP1L6 knockdown on EMT pathway and PI3K/AKT/mTOR pathway. The results showed that the expressions of p-PI3K, p-AKT, p-mTOR, vimentin, and β-catenin were significantly decreased, whereas E-cadherin was increased in PC3 and 22RV1 cells transfected with siRNA compared to scrambled siRNA (P<0.05, ). These findings suggest that the involvement of NAP1L6 in the progression of PCa seems to be mediated by modulation of PI3K-AKT-mTOR and EMT pathways.
PCa cell proliferation, migration, and invasion were inhibited by low expression of INHBA regulated by si-NAP1L6
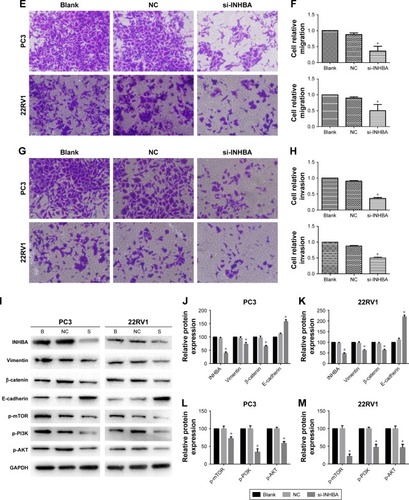
Further analysis of the microarray chip results revealed that INHBA could be a downstream gene of NAP1L6. The results revealed that expression of NAP1L6 could positively regulate INHBA at both mRNA levels () and protein levels (). To further verify whether NAP1L6 could promote the progression of PCa by upregulating INHBA, we knocked down INHBA in PC3 and 22RV1 cells using siRNA (). CCK-8 assays were performed and the results demonstrated that INHBA knockdown could decrease proliferation of PC3 and 22RV1 cells (). Next, we explored the effect of INHBA knockdown on PCa cell migration/invasion. Knockdown of INHBA inhibited PC3 and 22RV1 cell migration capacity (P<0.05, ). Transwell invasion assay was undertaken to assess the effect of NAP1L6 on the invasiveness of PCa cells. Our studies indicated that the invasive ability of si-NAP1L6-transfected PCa cells was reduced compared with the control group (P<0.05, ). Next, we investigated the effects of INHBA knockdown on EMT pathway and PI3K/AKT/mTOR pathway. The results of Western blot analysis showed that the expressions of vimentin, β-catenin, P-PI3K, P-AKT, and P-mTOR were significantly decreased, whereas E-cadherin was increased in PC3 and 22RV1 cells transfected with si-INHBA (P<0.05, ). These findings suggested that NAP1L6 might be involved in the progression of PCa by regulating INHBA through PI3K-AKT-mTOR and EMT pathways.
Figure 5 INHBA promoted the capabilities of proliferation, invasion, and migration through EMT and PI3K-AKT-mTOR signaling pathway regulated by NAP1L6. (A, B) Low-expression of NAP1L6 decreased the expression of INHBA at both mRNA levels and protein levels. (C) INHBA expression level in PC3 and 22RV1 cells was significantly decreased by si-INHBA. (D) CCK-8 assay determined the proliferation of si-INHBA-transfected PC3 and 22RV1 cells. (E, F) si-INHBA could decrease the migration capacity of PCa cells. (G, H) si-INHBA could decrease the invasion capacity of PCa cells. (I–M) Western blot protein expression levels in PC3 and 22RV1 cells after si-INHBA transfection. GAPDH protein was internal control. Data represent the mean ± SD from three independent experiments. *P<0.05.
Discussion
LncRNA dysregulation might affect epigenetic information, resulting in progressive and uncontrolled tumor growth.Citation13,Citation14 It was essential to explore novel lncRNA that participate in PCa genesis and development. To date, an increasing number of studies had explored the capacity of lncRNAs as biomarkers and prognostic factors. Recently, studies reported that lncRNAs might affect PCa cell proliferation, metastasis, and apoptosis by either transcriptional or post-transcriptional regulation.Citation15–Citation18 For example, PCAT-1 was determined to participate in tumorigenesis by regulating Fascin-1 via miR-145-5p in PCa.Citation19 In addition, PCGEM1 and PRNCR1 were reported to bound successively to the androgen receptor and strongly enhanced both ligand-dependent and ligand-independent androgen-receptor-mediated gene activation programs and proliferation in PCa cells.Citation20 Besides, the over-expression of SChLAP1 was demonstrated to be associated with high Gleason score, rapid disease progression, and poor clinical outcome in patients with localized PCa following radical prostatectomy.Citation21,Citation22
After analysis of microarray results, we identified differentially expressed lncRNA NAP1L6 in PCa. NAP1L6 contained 33.5 kb nucleotides and was located in Xq13.2. In 2014, Gazzellone et al reported that copy number variation of NAP1L6 might be related with autism spectrum disorder in Han Chinese individuals.Citation23 However, it has not been reported in any of the tumor-related studies till now. In our study, NAP1L6 promoted the proliferation, migration, and invasion of PCa cells by regulating the expression of INHBA. Recently, regulative function of INHBA in cancer had attracted researchers’ attention. Si et al indicated that high expression of INHBA was an adverse prognostic factor for de novo acute myeloid leukemia.Citation24 In terms of solid tumors, INHBA expression levels were found to be significantly higher in cancer tissue than in adjacent normal mucosa in patients with stage II/III gastric cancer who received adjuvant chemotherapy with S-1. Moreover, results of clinicopathological data analysis demonstrated that high INHBA expression was associated with significantly poorer 5-year survival.Citation25 In PCa, INHBA was found to be over-expressed in high-grade disease.Citation26 Furthermore, Tandefelt et al reported that INHBA participated in PCa progression in in vitro biologic assays.Citation27 However, the specific mechanism of regulation remains to be explored.
In our study, we hypothesized that EMT and PI3K/AKT/mTOR signaling pathways contributed in INHBA PCa regulation based on the results of in vitro biologic assays. It is well known that the PI3K/AKT/mTOR signaling and EMT pathways are involved in many human malignancies, including PCa.Citation28–Citation31 On the one hand, AKT had been proven to be a critical effector serine/threonine kinase in the receptor tyrosine kinase/phosphatase and tensin homolog/PI3K pathways. What’s more, AKT could be phosphorylated by a number of extracellular stimuli and regulate multiple cellular processes including cell growth, progression, anti-apoptosis, proliferation, migration, and regulation of the cell cycle.Citation32 On the other hand, epithelial cancer cells convert to motile, mesenchymal cells by undergoing an EMT process that enhances cancer metastasis and invasion capacity.Citation33–Citation36 In PCa, EMT had been implicated, particularly, in the context of disease progression and metastasis.Citation37–Citation40
Our study included certain limitations. Firstly, apart from proliferation, colony formation, migration, and invasion of PCa cell lines, we did not investigate the association between NAP1L6 and cell cycle or xenograft carcinogenesis. Secondly, retrospective rather than prospective approach was performed to collect the clinical data, which increased bias in the analysis of data. Finally, further studies that focus on NAP1L6 and the possible targets of INHBA should be performed in future to elucidate the precise mechanisms of PCa development.
Conclusion
Our study revealed the role of NAP1L6 in PCa progression and showed the underlying molecular mechanism preliminarily. Combining the results of the microarray analysis and cytology and molecular biology experimental and clinical data analysis, NAP1L6 might be a potential prognostic bio-marker for future treatment of PCa.
Acknowledgments
This work was supported by funding from the Jiangsu Province Natural Science Foundation of China (BK20141495), Priority Academic Program Development of Jiangsu Higher Education Institutions (PAPD) (JX10231801), and Jiangsu Provincial Special Program of Medical Science (BL2012027).
Supplementary material
The gene sequence of plasmids used to stabilize/over-express NAP1L6 in PC3 cells is as follows
5′CTCGAGCTCCTTTTGCCATGGCAGCTAGTGGGGAAAGCCCTTTAGCCCGCTACTCTTGCCTTCCACGGCTTCCGCCACCCCAGGCCAGCTTCCACAGCAGCTGTAGCTGCTTCGTTCCGCCTCCGTCTTAGCACCCCCAGGTGCCGGCGGCCCGGGCCAAGCCATCGCCTACAGTTCGGTGAGTGTTTCCCTGCCAAAAAGCTAATGATGGAAGGGCTCGGAGAACACAGCACAGCCGGTGAAATGGGCCCATTACTCGGCGCTGTGGCAGCCACAGCCTCTCCGCAGTCTTTGATGGAGTACTCCTCAGACGCAGATTTTATTGAGAGCCTGCCTCTGGTGGTTAAGTACCGAGTGTACACTCTCAAAAAGCTTCAGGCCAAATGTGCCGTGCTAGAGGCCAAGTACCTGAGGGAATTTCATTCTGTCGAGAGGAAGTTTGCCACCATCTATGGACCCTTATTGGAAAAGAGACGGCAGATCACCAATGCACTGTATGAGCCCACGAAAGAGGAGTGTGAGAGGTGAAGTCCAAGGTTGAGGACTATGAGTATAATGAGGTGGCCGGTGATTCTAATGCTCAGATGTATGGTGCAGAGGAGAATCCGGAGTATGAGGACTTGGTGGAGGATCGTGAGGAGGATTTCGAGGATGTCGGGGAGGTGTTTGGGGAGTATGAAGGAATCGAGGGACATAATGTGGACGGAGAAAAAGATAATCCTACAGGGATCCCCGATTTCTGGCTCACGGCTTTATAGAATGCCCAGGAGGTTGCCCCGCTGATTAAGAAATATGACGAGGCCAGGCGCAGTGGCTCACGCCTGTAATCCCAGCACTTTGGGAGGCCGAGGCAGGTGGATCACAAGTTCAGGAAATCGAGACCATCCTGGCTAACACAGTGAAACCCCGTCTCTACTAAAAATACAAAAAAAAAAAAAAAAAAAATTAGCCGGGGGTGGTGGCACACACCTATAGTCCCAGCTGCCCAGGAGGCTGAGGCAGGAGAATCGCTTGAACCCAAGAGGCAGAGGTTGCAGTGAACTGAGATCGCACCACTGCACTCCAGCCTGGGCGACAGAGCGATATTCCGAAAAAACGAAACAACAACAACAAAAATATGACGAGCCCATTCTGAAGCTCTTGCAAGACGTGAAAGTCAAGTTTTCAAAATCAAACTAGCCACTCACTTTTACGCTGGAATTTCACTCTGAACCCAACGACTACTTCACAAATGAGGTGCTGACCGAAAGAAACATACATCCTCAAGTCTAAGCTCGATTAGTCTGACCCCCACCCCTTCAGGGGATCTGCGGTAGAGCGTTGCTTTGGCAGCATGATAGAATGGAAGAAGGGAAAGAACGTCACTGTGCAAACGGTCCTGAAGAGAGACACAGTTTTTGGGGGCTGATGTGTACCGCCACTCAGGAATTTCCCCAAGAGTCCCTTCTTCAATGCTCTCCAGTGGGGCCTAGATGCTAATGAGGATGAGGAAGACTTCTTCATCGCTCACACCTTGCACACTTTTGTCATCCCAAGAGCTGTGTTACACTTTACAGGAGAAGCCCTTGAGGCAGAGCAAGATACGATGATCAGGGAATGTAATAATCCGGTTTATGACAGAATGACTCAGGAGAATTGGGTGACTGCAGTTTATGGTGCTAAAGGCCAAAACCGAAACTCCCAGGCAGAAGTCAATGATTGTTGAAGCAGAATGGTTGGAGTATGTGGGCCTCCAGGTTAACAACTGGCTTTTACAATAACCAAAACTTAATCATTCGTTACTTACAGTCTTAACGTGTCTCTTCTTGGTAGTCTCAGTTTAAAATTATGTCCAAATATATTTAACAATGCATTTCATCTAGCACTCCAGTGGTGTAAACTTTGTCAACAATTTTATTAGGCAGTGAATTCTCAACGTATGTGAAGACCTTACTATTGTGAATCCATGGCTTTTGTCAGGTTGCTACTAGTCTGCATCTATGGAAAATTACCAGAACTTGTAACTAAGATCTATGTTTGGGTTTGTAAAATAAAGTGAGATAGCATCCTTGGTACC3′. where 5′ end (underlined) contains an XhoI digestion site, 3′ end (underlined) contains a KpnI restriction site, and in the middle is the target sequence.
Disclosure
The authors report no conflicts of interest in this work.
References
- CenterMMJemalALortet-TieulentJInternational variation in prostate cancer incidence and mortality ratesEur Urol2012611079109222424666
- SiegelRLMillerKDJemalACancer Statistics, 2017CA Cancer J Clin20176773028055103
- ChenWZhengRBaadePDCancer statistics in China, 2015CA Cancer J Clin20166611513226808342
- HuXSoodAKDangCVZhangLThe role of long noncoding RNAs in cancer: the dark matter mattersCurr Opin Genet Dev20174881529054012
- MorrisKVMattickJSThe rise of regulatory RNANat Rev Genet20141542343724776770
- IyerMKNiknafsYSMalikRThe landscape of long noncoding RNAs in the human transcriptomeNat Genet20154719920825599403
- SchmittAMChangHYLong nncoding RNAs in cancer pathwaysCancer Cell20162945246327070700
- HanahanDWeinbergRAHallmarks of cancer: the next generationCell201114464667421376230
- BottcherRHooglandAMDitsNNovel long non-coding RNAs are specific diagnostic and prognostic markers for prostate cancerOncotarget201564036405025686826
- ZhangAZhangJKaipainenALucasJMYangHLong non-coding RNA: a newly deciphered “code” in prostate cancerCancer Lett201637532333026965999
- Martens-UzunovaESBottcherRCroceCMJensterGVisakorpiTCalinGALong noncoding RNA in prostate, bladder, and kidney cancerEur Urol2014651140115124373479
- https://cancergenome.nih.gov/1092017
- GuptaRAShahNWangKCLong non-coding RNA HOTAIR repro-grams chromatin state to promote cancer metastasisNature20104641071107620393566
- NieYLiuXQuSSongEZouHGongCLong non-coding RNA HOTAIR is an independent prognostic marker for nasopharyngeal carcinoma progression and survivalCancer Sci201310445846423281836
- St LaurentGShtokaloDTackettMRIntronic RNAs constitute the major fraction of the non-coding RNA in mammalian cellsBMC Genomics20121350423006825
- MouravievVLeeBPatelVClinical prospects of long noncoding RNAs as novel biomarkers and therapeutic targets in prostate cancerProstate Cancer Prostatic Dis201619142026503110
- FlynnRAChangHYLong noncoding RNAs in cell-fate programming and reprogrammingCell Stem Cell20141475276124905165
- SuYJYuJHuangYQYangJCirculating long noncoding RNA as a potential target for prostate cancerInt J Mol Sci201516133221333826110379
- XuWChangJDuXHouJLong non-coding RNA PCAT-1 contributes to tumorigenesis by regulating FSCN1 via miR-145-5p in prostate cancerBiomed Pharmacother2017951112111828922730
- YangLLinCJinClncRNA-dependent mechanisms of androgen-receptor-regulated gene activation programsNature201350059860223945587
- PrensnerJRZhaoSErhoNRNA biomarkers associated with metastatic progression in prostate cancer: a multi-institutional high-throughput analysis of SChLAP1Lancet Oncol2014151469148025456366
- MehraRUdagerAMAhearnTUOverexpression of the long non-coding RNA SChLAP1 independently predicts lethal prostate cancerEur Urol20167054955226724257
- GazzelloneMJZhouXLionelACCopy number variation in Han Chinese individuals with autism spectrum disorderJ Neurodev Disord201463425170348
- SiTLuYLiFJiangLPeiRZhouJXHigh expression of INHBA is an adverse prognostic factor for de novo acute myeloid leukemiaLeuk Lymphoma20185911412028836868
- KatayamaYOshimaTSakamakiKClinical significance of INHBA gene expression in patients with gastric cancer who receive curative resection followed by adjuvant S-1 chemotherapy in vivo20173156557128652421
- LapointeJLiCHigginsJPGene expression profiling identifies clinically relevant subtypes of prostate cancerProc Natl Acad Sci U S A200410181181614711987
- Gasi TandefeltDBoormansJLvan der KorputHAJensterGWTrapmanJA 36-gene signature predicts clinical progression in a subgroup of ERG-positive prostate cancersEur Urol20136494195023490727
- SarkerDReidAHYapTAde BonoJSTargeting the PI3K/AKT pathway for the treatment of prostate cancerClin Cancer Res2009154799480519638457
- LiLIttmannMMAyalaGThe emerging role of the PI3-K-Akt pathway in prostate cancer progressionProstate Cancer Prostatic Dis2005810811815724144
- NicholsonKMAndersonNGThe protein kinase B/Akt signalling pathway in human malignancyCell Signal20021438139511882383
- SekhonKBucayNMajidSDahiyaRSainiSMicroRNAs and epithelial-mesenchymal transition in prostate cancerOncotarget20167675976761127588490
- LiuQTurnerKMAlfred YungWKChenKZhangWRole of AKT signaling in DNA repair and clinical response to cancer therapyNeuro Oncol2014161313132324811392
- KalluriRWeinbergRAThe basics of epithelial-mesenchymal transitionJ Clin Invest20091191420142819487818
- ThieryJPEpithelial-mesenchymal transitions in tumour progressionNat Rev Cancer2002244245412189386
- ZhangJMaLMicroRNA control of epithelial-mesenchymal transition and metastasisCancer Metastasis Rev20123165366222684369
- YilmazMChristoforiGEMT, the cytoskeleton, and cancer cell invasionCancer Metastasis Rev200928153319169796
- NauseefJTHenryMDEpithelial-to-mesenchymal transition in prostate cancer: paradigm or puzzle?Nat Rev Urol2011842843921691304
- ChengLNagabhushanMPretlowTPAminiSBPretlowTGExpression of E-cadherin in primary and metastatic prostate cancerAm J Pathol1996148137513808623909
- SethiSMacoskaJChenWSarkarFHMolecular signature of epithelial-mesenchymal transition (EMT) in human prostate cancer bone metastasisAm J Transl Res20103909921139809
- WallerandHRobertGPasticierGThe epithelial-mesenchymal transition-inducing factor TWIST is an attractive target in advanced and/or metastatic bladder and prostate cancersUrol Oncol20102847347919272800