
 ?Mathematical formulae have been encoded as MathML and are displayed in this HTML version using MathJax in order to improve their display. Uncheck the box to turn MathJax off. This feature requires Javascript. Click on a formula to zoom.
Abstract
Background
Colorectal cancer is a malignant tumor with high death rate. Chemotherapy, radiotherapy and surgery are the three common treatments of colorectal cancer. For early colorectal cancer patients, postoperative adjuvant chemotherapy can reduce the risk of recurrence. For advanced colorectal cancer patients, palliative chemotherapy can significantly improve the life quality of patients and prolong survival. FOLFOX is one of the mainstream chemotherapies in colorectal cancer, however, its response rate is only about 50%.
Methods
To systematically investigate why some of the colorectal cancer patients have response to FOLFOX therapy while others do not, we searched all publicly available database and combined three gene expression datasets of colorectal cancer patients with FOLFOX therapy. With advanced minimal redundancy maximal relevance and incremental feature selection method, we identified the biomarker genes.
Results
A Support Vector Machine-based classifier was constructed to predict the response of colorectal cancer patients to FOLFOX therapy. Its accuracy, sensitivity and specificity were 0.854, 0.845 and 0.863, respectively.
Conclusion
The biological analysis of representative biomarker genes suggested that apoptosis and inflammation signaling pathways were essential for the response of colorectal cancer patients to FOLFOX chemotherapy.
Introduction
Colorectal cancer is a malignant tumor that seriously endangers people’s health. In recent years, the incidence of colorectal cancer has significantly increased and has become the third most common type of cancer. In the past few decades, due to the early detection and treatment, many countries have improved the survival rate of colorectal cancer. Especially in some developed countries, the 5-year survival rate has reached more than 65%.Citation1
Treatment options for colorectal cancer include chemotherapy, radiotherapy and surgery.Citation2 In general, surgical removal of the affected tumor and any adjacent intestines can effectively eliminate cancer cells and reduce the risk of cancer spreading. Chemotherapy also occupies an important role in the treatment of colorectal cancer. Postoperative adjuvant chemotherapy in early colorectal cancer can reduce the risk of recurrence. For patients with advanced colorectal cancer who are inoperable, palliative chemotherapy can significantly improve the life quality of patients and prolong survival.
Generally, the combination of chemotherapeutic agent results in significantly increased response rates and improved survival.Citation3 Current combination chemotherapy includes 5-fluorouracil (5-FU)/leucovorin with oxaliplatin (FOLFOX), 5-FU/leucovorin and irinotecan (FOLFIRI), capecitabine and oxaliplatin (CAPEOX/XELOX) and 5-FU/leucovorin/oxaliplatin and irinotecan (FOLFOXIRI).
FOLFOX chemotherapy has proven to be effective in the treatment of unresectable metastatic colorectal cancer.Citation4 Studies have suggested that patients with stage III colorectal cancer, who receive adjuvant FOLFOX chemotherapy, experience an improved disease-free and overall survival.Citation5 However, about half of the patients were unable to benefit from the treatment and even suffered from neurotoxicity.Citation6
There have been several studies that are trying to predict the FOLFOX chemotherapy response.Citation7,Citation8 It has been reported that MTHFR germinal polymorphism is a potential strong predictor of response to FOLFOX therapy, and the response rate to FOLFOX increases continuously with the number of favorable MTHFR alleles.Citation7 Another reported biomarker is SMURF2. It was highly expressed in non-responders for FOLFOX therapy.Citation8
To systematically investigate the response mechanisms of FOLFOX chemotherapy in colorectal cancer patients, we collected three gene expression datasets of colorectal cancer patients with FOLFOX therapy and identified the genes that can predict responders to FOLFOX therapy for colorectal cancer using advanced machine learning methods. The biological analysis of several representative signature genes, such as MLKL, CC2D1A, LPL, PAGE4 and SLC26A9, suggested that apoptosis and inflammation signaling pathways were the essential pathways that controlled the response of colorectal cancer patients to FOLFOX chemotherapy.
Methods
The gene expression profiles of colorectal cancer patients with FOLFOX therapy
We searched Gene Expression Omnibus (GEO) database and found three datasets of colorectal cancer patients with FOLFOX therapy.
The gene expression profiles of colorectal cancer patients with FOLFOX therapy were combined from three datasets downloaded from GEO with accession number of GSE19860, GSE28702 and GSE72970. The platform of these three datasets was the same. They all used Affymetrix Human Genome U133 Plus 2.0 Array.
These three datasets were generated by different researchers from different labs. To minimize the systemic bias, the raw CEL files were downloaded and processed together using R package affyPLM and affy.Citation9 The gene expression levels of probes were quantified with MAS5 methodCitation10 and normalized with quantile method. The probe expression levels were transformed into gene expression levels using R package gahgu133plus2cdf and gahgu133plus2.db. There were 18,733 genes with expression levels that were used as features to predict whether a colorectal cancer patient will respond to FOLFOX therapy.
In GSE72970 dataset, there were 20 colorectal cancer patients with FOLFOX response and 12 colorectal cancer patients without FOLFOX response. In GSE28702, there were 42 colorectal cancer patients with FOLFOX response and 41 colorectal cancer patients without FOLFOX response. In GSE19860, there were nine colorectal cancer patients with FOLFOX response and 20 colorectal cancer patients without FOLFOX response. Together, there were 42 colorectal cancer patients with FOLFOX response who were considered as positive samples and 41 colorectal cancer patients without FOLFOX response who were considered as negative samples. The sizes of positive and negative samples are shown in . The clinical information of the 144 colorectal cancer patients from GEO is given in .
Table 1 The sizes of positive and negative samples
Rank the discriminative genes using mRMR method
The minimal redundancy maximal relevance (mRMR) methodCitation11 is widely used to select discriminative features.Citation12–Citation17 The mRMR software downloaded from http://home.penglab.com/proj/mRMR/ was used to perform the feature ranking.
It works as follows: first, let us represent all the 18,733 genes, the selected m genes and the to-be-selected n genes using Ω, ΩS and Ωt, respectively. The relevance I of gene g from Ωt with FOLFOX response r can be measured with mutual information (I):Citation18,Citation19
The redundancy R of the gene g from Ω with the selected genes in ΩS are
The algorithm tries to find the best gene gj from Ωt that has maximum relevance with FOLFOX response r and minimum redundancy with the selected genes in ΩS by maximizing the function below
After N rounds of evaluation procedure, all the genes from Ωt will be ranked
The mRMR rank represents the discriminating power of the gene.
To reduce the computational time, only the top 500 mRMR genes were analyzed in the following steps.
Identify the predictive genes using incremental feature selection (IFS) method
To evaluate the prediction performance of mRMR genes, IFS methodCitation20–Citation26 was applied to select the genes with greatest prediction power. The IFS method is a wrapped feature selection method that combines the feature selection with classifier construction. We used Support Vector Machine (SVM) as the classifier. To be specific, the SVM function in R package e1071 was used to construct the classifier.
IFS is a process of iteration that adds genes one by one based on the mRMR ranking and then evaluates the classification performance of the selected genes. Each time, the top k genes from the mRMR table were selected and used to build the classifier that predicts whether a colorectal cancer patient will respond to FOLFOX therapy. The performance of each classifier was evaluated with leave-one-out cross validation (LOOCV).
The three major measurements for a classifier, sensitivity (Sn), specificity (Sp) and accuracy (ACC), were calculated.
In these equations, TP, TN, FP and FN stand for true positive samples, true negative samples, false positive samples and false negative samples, respectively.
In this study, the colorectal cancer patients with FOLFOX response and the colorectal cancer patients without FOLFOX response were considered as positive and negative samples, respectively.
After 500 rounds of IFS evaluation, an IFS curve can be plotted. The x-axis was the number of used genes, and the y-axis was the LOOCV accuracy. Based on the IFS, we can easily see how many genes should be used to classify the colorectal cancer patients with FOLFOX response and the colorectal cancer patients without FOLFOX response.
The visualization of how predictive the genes are for FOLFOX response
After we identified the predictive genes using mRMR and IFS methods, we tried to visually investigate how good they can classify the colorectal cancer patients with FOLFOX response and the colorectal cancer patients without FOLFOX response.
Principal component analysis (PCA)Citation27 was performed to extract the first and second principal component (PC) of the selected genes. PCA is a widely used multivariate statistical method and can capture most of the gene expression variability.Citation27 With the dimensionality reduction via PCA, the high dimension gene expression profiles can be mapped onto two dimensions of PC1 and PC2, which can explain the most variance observed in the data. Since it is unsupervised, the 2D-PCA plot will give an intuitive view of how close each sample is to each other.
Another method that we applied was two-way hierarchical clustering of both colorectal cancer patients and selected genes. From the heatmap, we can not only explore whether the colorectal cancer patients with FOLFOX response and the colorectal cancer patients without FOLFOX response were clustered into different groups but also know which genes were highly expressed or lowly expressed in the colorectal cancer patients with FOLFOX response.
Results and discussion
The top discriminative genes ranked with mRMR method
The mRMR can rank the genes based on not only their relevance with the FOLFOX responses of colorectal cancer patients but also the redundancy with each other. Therefore, the discriminative genes identified by mRMR methods will be compact, which means the highly co-expressed genes will not all be selected, only the best representative gene will be chosen. We obtained the top 500 most discriminative genes using the mRMR method. These 500 genes will be further optimized using IFS method.
The predictive genes selected based on IFS method
We used different number of top mRMR genes to construct the SVM classifier. Based on how accurate the model can classify the colorectal cancer patients into the right FOLFOX response groups, we plotted the IFS curve in which the x-axis was the number of genes and the y-axis was the LOOCV accuracy. The IFS curve is shown in .
Figure 1 The IFS curve of how the classifiers were based on different number of gene performance.
Abbreviations: IFS, incremental feature selection; LOOCV, leave-one-out cross validation.
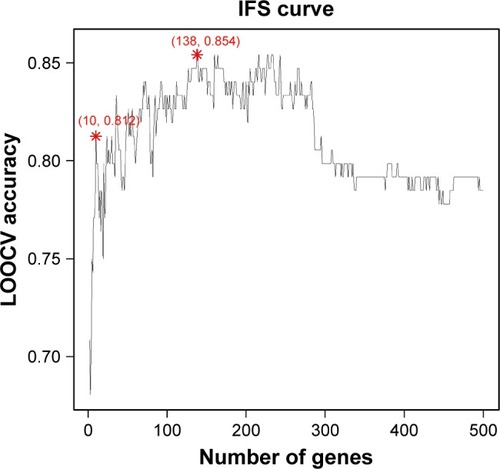
As shown in , the peak located at the position of using top 138 genes. Its accuracy was 0.854, which was the highest. We also calculated its sensitivity and specificity, which were 0.845 and 0.863, respectively. The top 138 genes are given in . The confusion matrix of actual responses and predicted responses is given in . We calculated the CIs of prediction performance using function sensSpec from R package epibasixCitation28 and the 95% CIs for sensitivity and specificity were (76.1, 92.9) and (78.4, 94.2), respectively.
Table 2 The confusion matrix of actual responses and predicted responses based on 138 genes
Although the performance of 138 genes was best, the accuracy of the top ten genes had already been over 0.8. The sensitivity and specificity for the ten gene classifier were 0.732 and 0.890, respectively. The top ten genes are given in .
Table 3 The top ten mRMR genes
The first gene was LOC100009676, which was understudied and did not have too much known functions.
The second gene was Lnc-ZNF461, which has been reported to be associated with non-small-cell lung cancer (NSCLC).Citation29 It was involved in immune response and can promote NSCLC progression by interacting with SLA2, DEFB4A, LAT and LIME1.Citation29
The third gene was MLKL, a necroptosis kinase. It was reported that MLKL was involved in immune activation in cancer cells.Citation30 Chemotherapy kills MLKL−/− cancer cells, and due to MLKL deficiency, the dying cancer cells will not cause immune response. MLKL may function through ICD signaling pathway. A recent publication by Sun et alCitation31 found that small-molecule analogs of SMAC mimetic in association with MLKL-pDNA and z-VAD-fmk showed antitumor effects in colorectal cancer cells in vitro via induction of RIP3-dependent necroptosis. All these findings have confirmed MLKL as a good chemotherapy response biomarker.
Another interesting gene was CC2D1A, a remarkable member of various signaling pathways, such as nuclear factor kB, PDK1/Akt, cAMP/PKA and Notch. Notch pathway is a well-studied colorectal cancer pathway.Citation32,Citation33 It has also been reported to be involved in the antiviral pathway by interacting with TBK-1 and IKKε and acts as a transcriptional repressor of serotonin and dopamine receptor genes.Citation34 CC2D1A silencing can induce apoptosis and increase chemotherapy sensitivity by decreasing Akt kinase activity.Citation35
The responders and non-responders were different on the first PC
To intuitively explore the difference of responders and non-responders, we calculated the first and second PCs of the 138 genes and plotted the PCA of responders (blue dots) and non-responders (red dots) in . PC1 represented 8.7% variance, while PC2 represented 4.7% variance.
Figure 2 The PCA plot of responders and non-responders.
Abbreviations: PCA, principal component analysis; PC, principal component; NR, non-responders; R, responders.
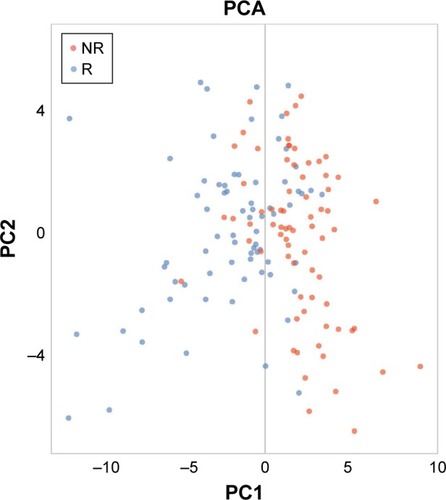
It can be seen that most responders were in area of PC1<0, while most non-responders were in the area of PC1>0. The responders and non-responders were different on the first PC.
The highly expressed genes in FOLFOX responders and non-responders
Although the PCA plot clearly demonstrated the difference of responders and non-responders, we were interested in identifying the highly expressed genes in FOLFOX responders and non-responders, which may reveal the biological mechanisms of FOLFOX response in colorectal cancer. Therefore, we plotted the heatmap of the 138 genes in the responder and non-responder colorectal cancer patients ().
Figure 3 The heatmap of the 138 genes in the responder and non-responder colorectal cancer patients.
Abbreviations: NR, non-responders; R, responders.
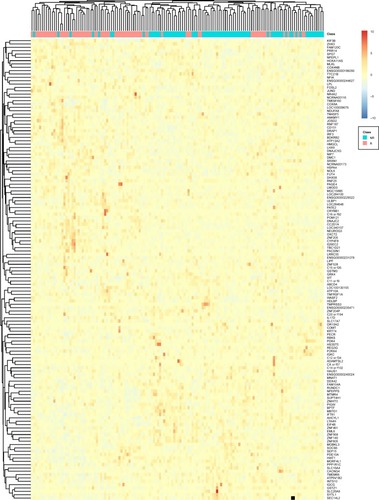
It can be seen that the responders and non-responders were clearly clustered into two groups and correspondingly, the 138 genes were also clustered into two groups. The top cluster of genes was highly expressed in responders, and the bottom cluster of genes was highly expressed in non-responders.
We have listed the highly expressed genes in FOLFOX responders whose fold change was greater than 1.5 and the lowly expressed genes in FOLFOX responders whose fold change was smaller than 0.67 in and , respectively.
For the highly expressed genes in FOLFOX responders, CRYBB1 was one of the highly mutated genes in micro-satellite instability colorectal cancers.Citation36
Table 4 The highly expressed genes in FOLFOX responders
Table 5 The lowly expressed genes in FOLFOX responders
NEUROG3 played important roles in intestinal enteroendocrine cells and was repressed by the growth factor-independent one transcription factor (GFI1) that was normally expressed in Paneth and goblet cells of colon.Citation37
LPL is a crucial enzyme for intravascular catabolism of triglyceride-rich lipoproteins. The alteration of LPL may let the cell acquire growth advantage and develop malignancy.Citation38 The LPL gene deficiency increases cancer risk. The tumor suppressive effects of LPL have been verified in animal models; due to its roles in inflammation, it is a great general target for chemotherapy.Citation39
CYP4F is a member of the CYP/CYP450 superfamily of enzymes. It was highly expressed in prostate cancer and RNAi experiments, which suggested that CYP4F was important for cell growth and survival.Citation40
PAGE4 is a member of GAGE family, which is highly expressed in various tumors.Citation41–Citation43 It has been reported that PAGE4 expression can predict liver metastasis of colorectal cancer.Citation44
For the lowly expressed genes in FOLFOX responders, SLC26A9 has colon-specific functions, such as transport of glucose, organic acids, metal ions and mineral absorption.Citation45 Its low expression may affect the growth of tumor cells.
The limitations and potential improvements of this study
Although this study identified candidate genes for chemotherapy response for colorectal cancer and revealed highly possible mechanism, there were several limitations:
Since this was a bioinformatics study, we did not validate our results with biological experiments. This limited the discovery of novel mechanisms. To reduce the effects of lacking experimental validation, we did thoroughgoing literature survey and proposed the possible mechanisms based on confirmed biological functions of candidate genes from published papers.
The sample size of this study was small, even though we collected all publicly available gene expression profiles from the largest gene expression database, GEO. In the next step, we will collect colorectal cancer patients with chemotherapy from our hospital and build a large independent test dataset.
The number of genes was still too large. We will try more advanced feature selection methods to further reduce the number of selected genes. The exhaust search strategies can be applied within the 138 genes to find the optimal 3–5 genes.
The clinical information should be documented carefully. Since the data we analyzed were from GEO, much clinical information of the patients was unknown. Analyzing the clinical information may provide novel insight. For example, within the 141 colorectal cancer patients, 117 samples were from primary sites and 27 samples were from metastatic lesions. But, we found that all 27 metastatic samples were predicted with the correct responses, as shown in in which the third and sixth columns are actual responses and predicted responses, respectively. There may be two reasons of why the metastatic lesions can predict chemotherapy response: 1) the gene expressions between primary tumors and metastatic lesions have strong correlation.Citation46,Citation47 Staub et al reported that the primary site of metastatic cancer can be predicted based on the similarity between metastatic cancer and primary tissue.Citation46 2) Some of the candidate genes were general tumor genes, such as PAGE4, a member of the GAGE family that is expressed in a variety of tumors.Citation41–Citation43
Genetic variations, such as single-nucleotide polymorphisms (SNPs) and copy number variations, have been proven to be a causal factor for tumorgenesis.Citation48–Citation52 They can be used for cancer subtyping and drug response prediction.Citation22,Citation48 Unfortunately, our dataset did not include genetic data. But based on central dogma and previous studies, most SNPs function through expression quantitative trait loci (eQTL).Citation17,Citation18,Citation53 The gene expression data can partially represent the effects of SNPs. If possible, we will preform DNA-Seq and RNA-Seq for the same patients and investigate the eQTL regulatory network of colorectal cancer patients with chemotherapy in the future.
Conclusion
Chemotherapy is a widely used treatment for cancers but not all cancer patients have expected responses to this treatment. In this study, we analyzed the gene expression profiles of FOLFOX responders and FOLFOX non-responders of colorectal cancer patients by combing several datasets. With advanced feature selection methods, we identified the biomarkers that can accurately predict the response of colorectal cancer patient to FOLFOX treatment. The biological analysis of selected genes revealed the possible mechanism of chemotherapy in colorectal cancer.
Supplementary materials
Table S1 The clinical information of the 144 colorectal cancer patients
Table S2 The top 138 mRMR genes
Disclosure
The authors report no conflicts of interest in this work.
References
- BrennerHKloorMPoxCPColorectal cancerLancet201438399271490150224225001
- AbdolahiHMAsiabarASAzami-AghdashSPournaghi-AzarFRezapourACost-effectiveness of Colorectal Cancer Screening and Treatment Methods: Mapping of Systematic ReviewsAsia Pac J Oncol Nurs201851576729379836
- Mohelnikova-DuchonovaBMelicharBSoucekPFOLFOX/FOLFIRI pharmacogenetics: the call for a personalized approach in colorectal cancer therapyWorld J Gastroenterol20142030103161033025132748
- SuhKWKimJHKimDYKimYBLeeCChoiSWhich gene is a dominant predictor of response during FOLFOX chemotherapy for the treatment of metastatic colorectal cancer, the MTHFR or XRCC1 gene?Ann Surg Oncol200613111379138517009149
- KumarAPeixotoRDKenneckeHFEffect of Adjuvant FOLFOX Chemotherapy Duration on Outcomes of Patients With Stage III Colon CancerClin Colorectal Cancer2015144262.e1268.e126123496
- WatanabeTKobunaiTYamamotoYGene expression signature and response to the use of leucovorin, fluorouracil and oxaliplatin in colorectal cancer patientsClin Transl Oncol201113641942521680303
- Etienne-GrimaldiMCMilanoGMaindrault-GoebelFMethylenetetrahydrofolate reductase (MTHFR) gene polymorphisms and FOLFOX response in colorectal cancer patientsBr J Clin Pharmacol2010691586620078613
- TsujiSMidorikawaYTakahashiTPotential responders to FOLFOX therapy for colorectal cancer by Random Forests analysisBr J Cancer2012106112613222095227
- GautierLCopeLBolstadBMIrizarryRAAffy – analysis of Affymetrix GeneChip data at the probe levelBioinformatics200420330731514960456
- HubbellELiuWMMeiRRobust estimators for expression analysisBioinformatics200218121585159212490442
- PengHLongFDingCFeature selection based on mutual information: criteria of max-dependency, max-relevance, and min-redundancyIEEE Trans Pattern Anal Mach Intell20052781226123816119262
- ZhouYZhangNLiBQHuangTCaiYDKongXYA method to distinguish between lysine acetylation and lysine ubiquitination with feature selection and analysisJ Biomol Struct Dyn201533112479249025616595
- ZhaoTHJiangMHuangTA novel method of predicting protein disordered regions based on sequence featuresBiomed Res Int2013201341432723710446
- NiuBHuangGZhengLPrediction of substrate-enzyme-product interaction based on molecular descriptors and physicochemical propertiesBiomed Res Int2013201367421524455714
- ZhangNWangMZhangPHuangTClassification of cancers based on copy number variation landscapesBiochimica et Biophysica Acta (BBA) – General Subjects20161860112750275527266344
- LiuLChenLZhangY-HAnalysis and prediction of drug–drug interaction by minimum redundancy maximum relevance and incremental feature selectionJ Biomol Struct Dyn201735231232926750516
- LiJHuangTPredicting and analyzing early wake-up associated gene expressions by integrating GWAS and eQTL studiesBiochim Biophys Acta201818646 Pt B22412246
- HuangTCaiY-DAn Information-Theoretic Machine Learning Approach to Expression QTL AnalysisPLoS One201386e6789923825689
- SunLYuYHuangTAssociations between Ionomic Profile and Metabolic Abnormalities in Human PopulationPLoS One201276e3884522719963
- ZhangNHuangTCaiYDDiscriminating between deleterious and neutral non-frameshifting indels based on protein interaction networks and hybrid propertiesMol Genet Genomics2015290134335225248637
- ShuYZhangNKongXHuangTCaiY-DPredicting A-to-I RNA Editing by Feature Selection and Random ForestPLoS One2014910e11060725338210
- LiBQYouJHuangTCaiYDClassification of non-small cell lung cancer based on copy number alterationsPLoS One201492e8830024505469
- JiangYHuangTChenLGaoY-FCaiYChouK-CSignal Propagation in Protein Interaction Network during Colorectal Cancer ProgressionBiomed Res Int20132013128701923586028
- ZhangP-WChenLHuangTZhangNKongX-YCaiY-DClassifying Ten Types of Major Cancers Based on Reverse Phase Protein Array ProfilesPLoS One2015103e012314725822500
- HuangTShuYCaiY-DGenetic differences among ethnic groupsBMC Genomics2015161109326690364
- ChenLLiJZhangYHIdentification of gene expression signatures across different types of neural stem cells with the Monte-Carlo feature selection methodJ Cell Biochem201811943394340329130544
- TodorovHFournierDGerberSPrincipal components analysis: theory and application to gene expression data analysisGenom Comput Biol201842e100041
- SzkloMNietoFJEpidemiology Beyond the BasicsBoston, MAJones and Bartlett2007
- LiJBiLShiZRNA-Seq analysis of non-small cell lung cancer in female never-smokers reveals candidate cancer-associated long non-coding RNAsPathol Res Pract2016212654955427067812
- YangHMaYChenGContribution of RIP3 and MLKL to immunogenic cell death signaling in cancer chemotherapyOncoimmunology201656e114967327471616
- SunDZhaoLLinJZhaoYZhengYCationic liposome co-encapsulation of SMAC mimetic and zVAD using a novel lipid bilayer fusion loaded with MLKL-pDNA for tumour inhibition in vivoJ Drug Target2018261455428649853
- FenderAWNutterJMFitzgeraldTLBertrandFESigounasGNotch-1 Promotes Stemness and Epithelial to Mesenchymal Transition in Colorectal CancerJ Cell Biochem2015116112517252725914224
- VinsonKEGeorgeDCFenderAWBertrandFESigounasGThe Notch pathway in colorectal cancerInt J Cancer201613881835184226264352
- DesharRChoE-BYoonSKYoonJ-BCC2D1A and CC2D1B regulate degradation and signaling of EGFR and TLR4Biochem Biophys Res Commun2016480228028727769858
- NakamuraANaitoMTsuruoTFujitaNFreud-1/Aki1, a Novel PDK1-Interacting Protein, Functions as a Scaffold To Activate the PDK1/Akt Pathway in Epidermal Growth Factor SignalingMol Cell Biol200828195996600918662999
- TuupanenSHänninenUAKondelinJIdentification of 33 candidate oncogenes by screening for base-specific mutationsBr J Cancer201411181657166225117815
- GerbeFvan EsJHMakriniLDistinct ATOH1 and Neurog3 requirements define tuft cells as a new secretory cell type in the intestinal epitheliumJ Cell Biol2011192576778021383077
- NotarnicolaMMessaCCarusoMGA significant role of lipogenic enzymes in colorectal cancerAnticancer Res20123272585259022753716
- TakasuSMutohMTakahashiMNakagamaHLipoprotein Lipase as a Candidate Target for Cancer Prevention/TherapyBiochem Res Int20122012239869722028972
- VainioPGuptaSKetolaKArachidonic Acid Pathway Members PLA2G7, HPGD, EPHX2, and CYP4F8 Identified as Putative Novel Therapeutic Targets in Prostate CancerAm J Pathol2011178252553621281786
- BrinkmannUVasmatzisGLeeBYerushalmiNEssandMPastanIPAGE-1, an X chromosome-linked GAGE-like gene that is expressed in normal and neoplastic prostate, testis, and uterusProc Natl Acad Sci U S A1998951810757107629724777
- IavaroneCWolfgangCKumarVPAGE4 is a cytoplasmic protein that is expressed in normal prostate and in prostate cancersMol Cancer Ther20021532933512489849
- KongUKooJChoiKParkJChangHThe expression of GAGE gene can predict aggressive biologic behavior of intestinal type of stomach cancerHepatogastroenterology200451591519152315362791
- ChenZLiMYuanYWangQYanLGuJCancer/Testis Antigens and Clinical Risk Factors for Liver Metastasis of Colorectal Cancer: A Predictive PanelDis Colon Rectum2010531313820010347
- ChenA-PChangM-HRomeroMFFunctional analysis of non-synonymous single nucleotide polymorphisms in human SLC26A9Hum Mutat20123381275128422544634
- StaubEBuhrH-JGröneJPredicting the site of origin of tumors by a gene expression signature derived from normal tissuesOncogene201029314485449220514016
- GrecoFACancer of unknown primary site: still an entity, a biological mystery and a metastatic modelNat Rev Cancer20141413424505613
- HuangTCopy Number Variations in TumorsElsevier: Reference Module in Biomedical Sciences2018 Available from:10.1016/B978-0-12-801238-3.65047-XAccessed September 07, 2018
- HuangTLiB-QCaiY-DThe integrative network of gene expression, microRNA, methylation and copy number variation in colon and rectal cancerCurr Bioinform20161115965
- ChenLHuangTZhangY-HJiangYZhengMCaiY-DIdentification of novel candidate drivers connecting different dysfunctional levels for lung adenocarcinoma using protein-protein interactions and a shortest path approachSci Rep2016612984927412431
- HuangTYangJCaiY-DNovel Candidate Key Drivers in the Integrative Network of Genes, MicroRNAs, Methylations, and Copy Number Variations in Squamous Cell Lung CarcinomaBiomed Res Int20152015235812525802847
- ZhangTMHuangTWangRFCross talk of chromosome instability, CpG island methylator phenotype and mismatch repair in colorectal cancerOncol Lett20181621736174630008861
- The GTEx ConsortiumThe Genotype-Tissue Expression (GTEx) pilot analysis: Multitissue gene regulation in humansScience2015348623564866025954001