
Zhu X, Xu A, Zhang Y, et al. Onco Targets Ther. 2020;13:10515–10523.
The authors have advised on page 10520 is incorrect. The correct is as follows.
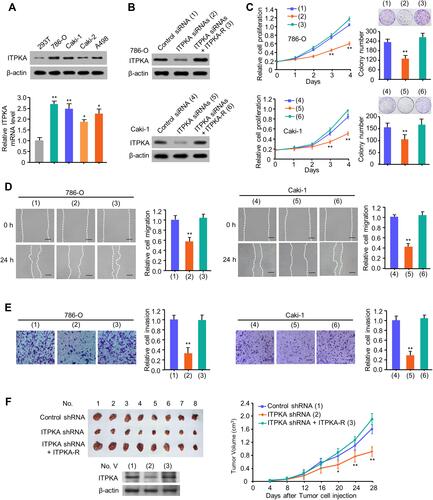
Figure 2 ITPKA promotes RCC proliferation, migration and invasion both in vitro and in vivo. (A) Total proteins extracted from the indicated RCC cell lines were analyzed by Western-blot with anti-ITPKA. β-actin was used as a loading control. (B) 786-O and Caki-1 cells were transfected with Control siRNA or ITPKA siRNAs or ITPKA siRNAs plus ITPKA. The immunoblot shows ITPKA expression. (C) Cell proliferation and colony formation, wound healing (D) and transwell (E) assays of 786-O and Caki-1 cells transfected as in (B). (1), (2), (3) represent 786-O cells transfected with Control siRNA, ITPKA siRNAs, ITPKA siRNAs plus ITPKA, respectively. (4), (5), (6) represent Caki-1 cells transfected with Control siRNA, ITPKA siRNAs, ITPKA siRNAs plus ITPKA, respectively (B–D). Illustrative images show colonies in plates, cell migration and invasion. Histograms show colony number, comparative cell migration and invasion. All values displayed are mean ± SD and have been duplicated 3 times with similar results (A–D). *p < 0.05 and **p < 0.01 versus corresponding Control siRNA. (F) 786-O cells stably infected with lentivirus carrying the indicated constructs were injected into nude mice as indicated. After 28 days, mice were sacrificed to harvest tumors. At the indicated times, the tumors were measured (mean ± SD, n = 8), and the growth curve was plotted. **p < 0.01 vs. Control shRNA group.
The authors wish to apologise for this error.