
 ?Mathematical formulae have been encoded as MathML and are displayed in this HTML version using MathJax in order to improve their display. Uncheck the box to turn MathJax off. This feature requires Javascript. Click on a formula to zoom.
Abstract
Purpose
To investigate the correlations in target volumes based on 18F-FDG PET/CT and four-dimensional CT (4DCT) to detect the feasibility of implementing PET in determining gross target volumes (GTV) for tumor motion for primary thoracic esophageal cancer (EC).
Methods
Thirty-three patients with EC sequentially underwent contrast-enhanced 3DCT, 4DCT, and 18F-FDG PET-CT thoracic simulation. The internal gross target volume (IGTV)10 was obtained by combining the GTV from ten phases of 4DCT. The GTVs based on PET/CT images were defined by setting of different standardized uptake value thresholds and visual contouring. The difference in volume ratio, conformity index (CI), and degree of inclusion (DI) between IGTV10 and GTVPET was compared.
Results
The images from 20 patients were suitable for further analysis. The optimal volume ratio of 0.95±0.32, 1.06±0.50, 1.07±0.49 was at standardized uptake value (SUV)2.5, SUV20%, or manual contouring. The mean CIs were from 0.33 to 0.54. The best CIs were at SUV2.0 (0.51±0.11), SUV2.5 (0.53±0.13), SUV20% (0.53±0.12), and manual contouring (0.54±0.14). The mean DIs of GTVPET in IGTV10 were from 0.60 to 0.90, and the mean DIs of IGTV10 in GTVPET ranged from 0.35 to 0.78. A negative correlation was found between the mean CI and different SUV (P=0.000).
Conclusion
None of the PET-based contours had both close spatial and volumetric approximation to the 4DCT IGTV10. Further evaluation and optimization of PET as a tool for target identification are required.
Introduction
Currently, radiotherapy is one of the most important treatment modalities for patients with esophageal cancer (EC), but it is associated with poor therapeutic effect. The overall 5-year survival rate for patients treated with conventional doses of radiotherapy alone is below 10%.Citation1,Citation2 Local recurrence is one of the main causes of treatment failure. The main reason for local failure after radiotherapy is the inability to precisely define accurate target volumes.
The majority of patients with EC are treated during free respiration. In this state, EC motion can be attributed to respiration, cardiac activity, and peristalsis.Citation3 Therefore, it is necessary to investigate the methods of tumor motion to improve the accuracy of target volume delineation in the image for radiation treatment planning.
Four-dimensional CT (4DCT) has been considered as an effective tool for assessing tumor and organ motion.Citation4–Citation6 One approach to define tumor motion is to contour gross target volumes (GTVs) on ten phases of 4DCT and obtain internal gross target volume (IGTV) by combining them; theoretically, this would give information about the entire tumor motion.Citation7,Citation8
A free-breathing PET (FB-PET) scan is performed in multiple bed steps for 2–5 minutes; it represents a time-averaged map of the tumor position. The blurred target outline on the FB PET scan could help to define the internal target volume (ITV).Citation9 Theoretically, for PET images, the high contrast between tumor and background indicates that even long acquisitions do not result in the tumor being lost in the background. Phantom studies have supported this theory,Citation10,Citation11 but there are no clinical data that validate it.
Considering that both FBPET and 4DCT could help to define an ITV, it seems logical to compare PET thresholds to 4DCT to determine an optimal segmentation method. Despite the fact that respiratory 4D PET-CT techniques are highly useful in target volume delineationCitation12 (accurately representative of organ and lesion motion), the feasibility of implementing it in determining the GTV for EC is still unknown. 3DPET-CT, integrated with 4DCT, might be selected as an alternative. It is necessary to study the relevance between the FB 3DPET-based GTVs and 4DCT-based targets in determining target motion in radiation treatment. Ten delineation methods were used to define the best volume fit between the two different modality-based target volumes for EC.
Materials and methods
Patient selection and characteristics
Patients with pathologically proven EC scheduled to accept radiotherapy were consecutively enrolled. None of them had been treated with radiotherapy or chemotherapy before. Thirty-one patients with EC were selected between November 2012 and November 2014. The patients with maximal standardized uptake value (SUV) on PET of less than 2.0 were excluded. Totally, the data from 20 patients were available for investigation. The patient characteristics are listed in .
Table 1 The characteristics of the patients enrolled in the study
CT acquisition
During the simulation, all patients were fixed in a relatively stable position using a thermoplastic mask and by placing their arms on the side of the body. For each patient, an axial enhanced 3DCT scan of the thoracic region was performed, followed by an enhanced 4DCT scan under uncoached FB conditions on a 16-slice CT scanner (Philips Brilliance Bores CT, Philips, the Netherlands) with the administration of intravenous contrast agents. A total of 100 mL of ioversol was injected intravenously, 2 mL/s for 3DCT, and 1 mL/s for 4DCT. The 3DCT and 4DCT data sets were acquired from the 20 patients on a 16-slice CT scanner (Philips Brilliance Bores CT) during FB. Three laser alignment lines were marked on the patient before CT acquisition. The 3DCT scan, in which 12 contiguous slices with a thickness of 3 mm thickness were produced per gantry rotation (1 s) and interval (1.8 s) between rotations, was acquired in sequential mode, and the 4DCT scan was acquired in helical mode with the scanning pitch between 0.09 and 0.15. The respiratory signal was recorded with the Varian real-time position management system (Varian Medical Systems, Palo Alto, CA, USA), by measuring the displacement of the infrared markers placed on the epigastric region of the patient’s abdomen. GE Advantage 4D software (GE Healthcare, Waukesha, WI, USA) was used to sort the reconstructed 4DCT images into ten respiratory phases labeled as 0%–90% on the basis of triggered signal. Phase 0% denoted the maximum end inspiration and phase 50% denoted the maximum end expiration. The 4DCT images were reconstructed using a thickness of 3 mm.
PET-CT image acquisition
On the same day as the 4DCT scan, the 18F-FDG-PET/CT scans of the chest were performed with an integrated PET/CT scanner (Philips Gemini TF Big Bore). Using the same immobilization devices, the patient was positioned identical to that for the 4DCT scan. Two radiation therapists were present to ensure the accuracy of the setup, assessed using a laser localizer and skin marks. All patients fasted for at least 6 hours before the PET/CT examination. All patients were injected with 7.4 MBq/kg body weight of 18F-FDG and then rested for approximately 1 hour in a quiet room before imaging. The 16-slice CT component was operated with an X-ray tube voltage peak of 120 kV, 90 mA, a slice thickness of 5 mm, and an interval of 4 mm and was used both for attenuation correction of PET data and for localization of 18F-FDG uptake in PET images. No CT contrast agent was administered. PET scanning was performed covering the same axial range for 2 minutes per bed position (total of 3–5 bed positions). Both PET and CT acquisition was performed during FB. Data were reconstructed using an ordered subset expectation maximization algorithm and attenuation correction derived from CT data. Then, the PET/CT images were transferred to MIM software (Cleveland, OH, USA).
Image registration
All the image data were transferred into MIM. An initial automatic rigid registration was performed. Because the 3DCT and 4DCT images for the same person were produced during the same imaging session, MIM would consider the images as being registered with each other. After the image data sets were coregistered with the help of the transmission CT from PET/CT, the 4DCT images will be autoregistered with the CT component of PET/CT.
PET-CT and CT target volume delineation and data acquisition
The targets in our study were contoured by the same senior radiotherapist; the radiotherapist underwent a strict training and contoured the targets following the same standard: The GTVs of different phases were delineated using the same window width and window level following the standards of an esophageal wall thickness >5 mm or an esophageal wall diameter (without gas) >10 mm. We could not ignore the error in the intraobserver by manual contouring. Before the formal contouring, we did a test: The radiotherapist contoured the targets two times in 6 patients (2 in the upper, 2 in the middle, and 2 in the distal, randomly) 2 weeks apart; the results are listed in . No significant differences were observed between the two times.
Table 2 The variation of intraobserver for the comparison of the GTV volume between different times (cm3)
Therefore, our results would be less affected by the manual contouring intraobserver errors.
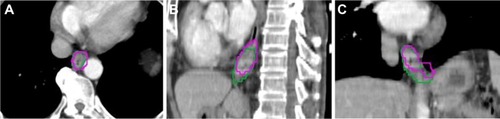
GTVs were manually contoured on the ten phases of the 4DCT images using mediastinal window setting (window width =400 HU, window level =40 HU). IGTV10 were obtained by combining GTVs contoured on ten phases of 4DCT. PET/CT-based GTVs of the primary tumor were automatically contoured by using nine different methods: SUV ≥2.0, ≥2.5, ≥3.0, ≥3.5; ≥20%, ≥25%, ≥30%, ≥35%, ≥40% of the maximum SUVmax, and visual contouring. The methods were determined by the results of other references.Citation10,Citation13–Citation16 All the noncancerous regions within the GTVPET, including the areas overlaid by the heart, bone, and great vessels, were corrected to exclude manually with the help of the CT component of PET/CT. The target volumetric size, the centroid coordinates for PET contours, and IGTV10 can be determined by MIM. shows an example of the GTV delineated in the text.
Figure 1 An example of the contours delineated in the image sessions in transversal (A), sagittal (B), and coronal section (C).
Abbreviations: GTV, gross target volume; SUV, standardized uptake value.
Target volume centroid distance
Then target centroid shift in the left–right (LR), anterior–posterior (AP), and cranial–caudal (CC) directions between GTVPET and IGTV10 was obtained as Δx, Δy, and Δz, respectively. The centroid distance was calculated as follows:
Volume ratio, conformity index, and degree of inclusion
To compare GTVPET based on PET-CT and IGTV10 based on 4DCT, three measures were used: volume ratio (VR), conformity index (CI), and degree of inclusion (DI). The VR is the ratio of two volumes. The conformity index of volume A and B [CI (A, B)] was defined as the ratio of the intersection of A with B to the union of A and B.Citation13 The maximum value of CI is 1 if the two volumes are identical, and the minimum value is 0 if the volumes are completely nonoverlapping. That is,
The definition of DI of volume A included in volume B, [DI (A in B)], is the intersection between volume A and volume B divided by volume A. The formula is as follows:Citation7
Statistical analysis
The SPSS software package (SPSS 17.0, Chicago, IL, USA) was performed for statistical analysis. Descriptive statistics were used as appropriate. The paired sample Student’s t-test and Wilcoxon text was used for comparison of tumor position, volumetric size, CI, and DI. Values of P<0.05 were regarded as significant.
Results
The variations of target centroid shift between IGTV10 and GTVPET
lists the target centroid shift in LR, AP, CC, and 3D directions. In CC direction, the centroid coordinates of all GTVPET showed statistical significance to that of IGTV10 (P>0.05), while the GTVPET in other directions differed no significantly to that of IGTV10 (P<0.05).
Table 3 The target centroid shift between GTVPET and IGTV10 in LR, AP, and CC directions, and 3D represents the centroid distance between GTVPET and IGTV10 (mean ± SD, and median, mm)
Variations in VR, CI, and DI
The VR, CI, and DI of GTVPET to IGTV10 are listed in . The best volume match for VR was observed at SUV2.5, SUV20%, or manual contouring, which achieved the optimal VR values of (0.95±0.32), (1.06±0.50), and (1.07±0.49), respectively. The best fit for CI was at (0.51±0.11), SUV2.5 (0.53±0.13), SUV20% (0.53±0.12), and manual contouring (0.54±0.14). The mean DIs of GTVPET in IGTV10 were from 0.60 to 0.90, and the mean DI of IGTV10 in GTVPET ranged from 0.35 to 0.78. A negative correlation was observed between nine different mean SUVmax (2.0, 2.5, 20% mean SUVmax=2.83, 3.0, 3.5, 25% mean SUVmax=3.53, 30% mean SUVmax=4.24, 35% mean SUVmax=4.95, 40% mean SUVmax=5.65) and the mean CI (0.51, 0.53, 0.53, 0.50, 0.46, 0.51, 0.45, 0.39, 0.33) (t=−0.931, P=0.000).
Table 4 The VR, DI, and CI of GTVPET and IGTV10 (mean ± SD and median)
The best VR and CI of the groups of low SUVmax, median SUVmax, and high SUVmax
The threshold may be different between low SUVmax, median SUVmax, and high SUVmax. Therefore, the 20 cases on average were divided into three groups: low SUVmax with the six lowest SUVmax (7.40, 9.13, 9.33, 9.36, 9.71, 10.41) among the cases, median SUVmax (11.82, 11.87, 11.96, 12.29, 13.67, 14.55, 15.32) with the seven median SUVmax, and high SUVmax with the seven highest SUVmax (15.57, 15.98, 17.20, 17.39, 19.39, 19.85, 30.40). Finally, the best VR and CI were recalculated, and these are listed in .
Table 5 The best VR and CI for low SUVmax, median SUVmax, and high SUVmax groups
The best VR and CI of the groups of different locations
The threshold may also be different between different locations. Therefore, the 20 cases on average were divided into three groups: the upper segment group (five cases), the middle segment group (eight cases), and the distal (seven cases). And the best VR and CI were recalculated, in which are listed in .
Table 6 The best VR and CI for upper, middle, and distal segment groups
Discussion
Chang et alCitation17 proved that a single static PET/CT scan had the potential to replace a 4DCT to determine the tumor ITV based on an experiment of phantom or peripheral non-small-cell lung cancer patients. In a phantom study, Okubo et alCitation10 showed that the PET-based ITV approximated to but did not accurately reproduce the maximum intensity projection (MIP) ITV derived from 4DCT. These previous documents focused on the comparison of the ITV based on 4DCT and PET session images by experiments of phantom and peripheral non-small-cell lung cancer patient.Citation10,Citation17,Citation18 This research mainly concentrated on the comparison of target volumes for primary EC delineated on PET-CT and ten phases of 4DCT.
In this study, our results suggested that the target volumes contoured at SUV2.5, SUV20%, or visual interpretation matched better with the IGTV that was combined from GTVs contoured on ten phases of 4DCT in VR, CI than other SUV threshold setting methods for all patients. A negative correlation was observed between different mean SUVmax and the mean CI (P=0.000). However, the poor CIs (0.55, 0.56, 0.57) and DIs (range: 0.65–0.77) suggested that great nonconformity between IGTV10 and GTVPET. One of the reasons is that shape and/or positional alterations between IGTV10 and GTVPET had occurred. In CC direction, the centroid coordinates of all GTVPET showed statistical significance to that of IGTV10 (P), while the GTVPET in other directions differed no significantly to that of IGTV10. Thus, these results indicated that geographic miss would come into being and that a large part of normal tissues would be irradiated whether GTVPET or IGTV10 was used as the treatment target volume.
Our results were consistent with some previous documents. Wang et alCitation16 compared GTV determined from average 4DPET and average 4DCT, and proved that GTVPET at SUV2.5, SUV20% correlated well with GTVCT in tumor length, VR, and CI, but the CIs (0.58, 0.57) were also not ideal. Callahan et alCitation19 used 4DPET to create “PET-MIP” image sets and segmented PET ITVs at thresholds ranging from 20% to 40% of maximum SUV. The investigators compared these volumes to ITVs drawn by radiation oncologists on the 4DCTMIP and found good overlap between PET-MIP volumes and CT-MIP volumes, but poor overlap between FBPET volumes and CT-MIP volumes.Citation19 Hanna et al’sCitation18 work compared ITV determined from FB-PET/CT with modified 4DCT-MIP for 16 patients with NSCLC receiving SABRT using the concordance index (equivalent to CI in our study). The mean concordance index of their study was 0.64 and 0.57 in GTVPET-CT and GTVCT. This indicated that the target volumes derived from FB-PET did not correspond well to those derived from 4DCT-MIP.
Limitations
It should be noted that, in our research, the two limitations that existed in the research by Hanna et al could be avoided. First, considering that the change of tumor geometry or size and a potential increase in the likelihood of a mismatch between IGTV10 and GTVPET because of the treatment or long time interval during PET-CT and 4DCT, all the patients enrolled in this study performed PET-CT and 4DCT simulation scans on the same day without any treatment. Furthermore, keeping the same body position during the two simulation in our research may reduce more setup errors and the incidence of misregistration between the two simulation scans than the study by Hanna et alCitation18 in which the PET simulation was performed on a curved table top while the 4DCT simulation on a flat table top. Different from this study, in our previous study, we compared the geometrical differences among planning target volumes (PTV) defined by PET combined with 4DCT, to 3DCT, and 4DCT, respectively, and discovered that PET combined with 4DCT could affect not only the volume of the PTV but also its shape.Citation20 As the esophagus does not strictly run straightly up and down, and the CTV should be constructed by GTV added additional margin of 30 mm in cranial–caudal direction and 5 mm in transversal direction, therefore, the additional margin in the cranial–caudal direction should be contoured along the wall of the esophagus. So the PTV that is formed by CTV is different from the GTV.
As we all know, it is the ratio or gradient between the background 18F-FDG uptake and tumor uptake that makes any method of PET-based contouring possible.Citation21 The size of PET delineation changes significantly depending on its threshold value. To encompass the whole tumor motion shape, the image threshold must be decreased. As mentioned earlier, it indicated that selection of an image threshold that is too low would overestimate the true volume, leading to a risk of increased normal tissue toxicity. Moreover, the method of contouring margins around the target lesion cannot be uniform, which could be verified from different results of the best VR and CI for the groups of low SUVmax, median SUVmax, and high SUVmax.
In another term, esophageal motion due to respiration is important especially for lower tumors. It would be important to note the difference in GTV on phase and the IGTV10 in the patients in relation to location. In this paper, the best threshold between different locations for EC tells us that the SUV might be affected significantly by tumor motion (). Thus, although a standardized method for optimal PET delineation for RTP has not yet been established, several investigators have reported that the use of single-threshold model for delineating the GTV with PET/CT is not sufficient because of the effects of the target size, motion, and image reconstruction parameters.Citation22
Other possible explanations for the geometrical mismatch between GTVPET and IGTV10 are as follows: 1) Despite the scans being done sequentially, with the patient in the same position throughout, the patient could have moved slightly between scans. A rigid registration might not be sufficient for lung tumors. Hence, registration error may inevitably affect the spatial position between GTVPET and IGTV10. 2) Some of this difference may be related to differences in the patient’s breathing pattern between acquiring the PET/CT and 4DCT. 3) The false-positive. Thus, at the present time, it is perhaps most appropriate to consider PET as one component of a multimodality approach to target delineation, and we agree with the previous studies that suggested that PET may help to define the presence of tumor for target volume definition purposes, but the edge of the PTV should be defined from 4DCT or conventional CT.Citation23 4) The different slice thickness for the 3D and 4D CTs (3 mm) and that of the PET-CT (5 mm) may be responsible for some of the geometrical mismatch. Further evaluation and optimization of PET as a tool for target identification are required.
Conclusion
Using the methods described, 18F-FDG PET-CT-based target volumes did not correspond well with 4DCT-based target volumes. None of the PET-based contours had both close spatial and volumetric approximation to the 4DCT IGTV10 for EC.
Ethical approval
All patients provided signed informed consent to participate in the study and before undergoing further imaging during radiotherapy. The study design was approved by the ethics committee of Shandong Cancer Hospital and Institute.
The ethics committee of Shandong Cancer Hospital and Institute conformed to the code of Ethics of the World Medical Association.
Acknowledgments
The authors acknowledge Dr Jinming Yu (Shandong Cancer Hospital and Institute).
Disclosure
The authors report no conflicts of interest in this work.
References
- SunDRTen year follow-up of esophageal cancer treated by radical radiation therapy: analysis of 869 patientsInt J Radiat Oncol Biol Phys19891623293342921133
- OkawaTKitaMTanakaMIkedaMResults of radiotherapy for inoperable locally advanced esophageal cancerInt J Radiat Oncol Biol Phys198917149542745207
- HashimotoTShiratoHKatoMReal-time monitoring of a digestive tract marker to reduce adverse effects of moving organs at risk (OAR) in radiotherapy for thoracic and abdominal tumorsInt J Radiat Oncol Biol Phys20056151559156415817362
- KeallPJStarkschallGShuklaHAcquiring 4D thoracic CT scans using a multislice helical methodPhys Med Biol200449102053206715214541
- DinkelJWelzelTBolteHFour-dimensional multislice helical CT of the lung: qualitative comparison of retrospectively gated and static images in an ex-vivo systemRadiother Oncol200785221522217923161
- PatelAAWolfgangJANiemierkoAHongTSYockTChoiNCImplications of respiratory motion as measured by four-dimensional computed tomography for radiation treatment planning of esophageal cancerInt J Radiat Oncol Biol Phys200974129029619362248
- LiFLiJZhangYGeometrical differences in gross target volumes between 3DCT and 4DCT imaging in radiotherapy for non-small-cell lung cancerJ Radiat Res201354595095623564841
- WangWLiJBZhangYJComparison of patient-specific internal gross tumor volume for radiation treatment of primary esophageal cancer based separately on three-dimensional and four-dimensional computed tomography imagesDis Esophagus20142734835423796234
- MacManusMNestleURosenzweigKEUse of PET and PET/CT for radiation therapy planning: IAEA expert report 2006–2007Radiother Oncol2009911859419100641
- OkuboMNishimuraYNakamatsuKStatic and moving phantom studies for radiation treatment planning in a positron emission tomography and computed tomography (PET/CT) systemAnn Nucl Med200822757958618756360
- RiegelACBucciMKMawlawiORJohnsonVAhmadMSunXTarget definition of moving lung tumors in positron emission tomography: correlation of optimal activity concentration thresholds with object size, motion extent, and source-to-background ratioMed Phys2010371742175220443495
- BettinardiVPicchioMDi MuzioNDetection and compensation of organ/lesion motion using 4D-PET/CT respiratory gated acquisition techniquesRadiother Oncol201096331131620708809
- ValiFSNagdaSHallWComparison of standardized uptake value-based positron emission tomography and computed tomography target volumes in esophageal cancer patients undergoing radiotherapyInt J Radiat Oncol Biol Phys20107841057106320199850
- ZhongXYuJZhangBUsing 18F-fluorodeoxyglucose positron emission tomography to estimate the length of gross tumor in patients with squamous cell carcinoma of the esophagusInt J Radiat Oncol Biol Phys200973113614118538492
- HanDYuJYuYComparison of (18) F-fluorothymidine and (18) F-fluorodeoxyglucose PET/CT in delineating gross tumor volume by optimal threshold in patients with squamous cell carcinoma of thoracic esophagusInt J Radiat Oncol Biol Phys20107641235124119910143
- WangYCHsiehTCYuCYThe clinical application of 4D 18F-FDG PET/CT on gross tumor volume delineation for radiotherapy planning in esophageal squamous cell cancerJ Radiat Res201253459460022843625
- ChangGChangTPanTClarkJWMawlawiORDetermination of internal target volume from a single positron emission tomography/computed tomography scan in lung cancerInt J Radiat Oncol Biol Phys201283145946622197228
- HannaGGvan Sörnsen de KosteJRDaheleMRDefining target volumes for stereotactic ablative radiotherapy of early-stage lung tumours: a comparison of three-dimensional 18F-fluorodeoxyglucose positron emission tomography and four-dimensional computed tomographyClin Oncol201224e71e80
- CallahanJKronTSchneider-KolskyMValidation of a 4D-PET maximum intensity projection for delineation of an internal target volumeInt J Radiat Oncol Biol Phys201386474975423601897
- GuoY-LLiJ-BShaoQLiY-KZhangPComparative evaluation of CT-based and PET/4DCT-based planning target volumes in the radiation of primary esophageal cancerInt J Clin Exp Med2015811215162152426885100
- DavisJBReinerBHuserMBurgerCSzékelyGCiernikIFAssessment of 18F PET signals for automatic target volume definition in radiotherapy treatment planningRadiother Oncol2006801435016876272
- BiehlKJKongFMDehdashtiF18F-FDG PET definition of gross tumor volume for radiotherapy of non-small cell lung cancer: is a single standardized uptake value threshold approach appropriate?J Nucl Med200647111808181217079814
- PanTMawlawiOPET/CT in radiation oncologyMed Phys200835114955496619070229