
Abstract
Background
Healthcare staff should be aware of the importance that patients may attach to the words that are used to convey information. This is relevant in terms of the patients’ understanding. Modeling how people understand the information conveyed in a medical context may help health practitioners to better appreciate the patients’ approach.
Purpose
1) Analyze the participants’ self-reported perception of the type of information provided in an oncological scenario in terms of three dimensions: impairment to their health, risks associated with the disease itself and commitment required to undergo the treatment; and 2) show the benefits of using Rasch scaling for the analysis of the data. Starting from a survey, Rasch scaling produces a unidimensional logit-interval scale relating to the extent to which each item conveys a latent dimension. These were related to structure, in particular concerning communication by means of opposite vs. unipolar language.
Subjects and methods
The participants rated 82 items of information in a questionnaire regarding their perception of impairment to their health (H) and the risks (R) and commitment relating to the treatment prescribed (T).
Results
The scaling produced an item bank for healthcare staff to consult in order to estimate the importance the recipient would be likely to attach to the vocabulary used and the likely impact of the information in terms of the patient’s condition. Furthermore, the use of opposites was generally associated with a clearer impression of whether the information given was generally only very negative or slightly negative, whereas ‘neutral’ information was often perceived as being very negative.
Actual findings
Is possible to estimate people’s understanding more precisely (in terms of H, R and T) which can help healthcare practitioners to modulate the way they convey information.
Limitations
The participants in the study were healthy volunteers and the context was simulated.
Introduction
The WHO has defined the term “health” as “a state of complete physical, mental, and social well-being and not merely the absence of disease or infirmity” (July 22, 1946). Over the years, modern medicine has increasingly abandoned the biomedical model of patient care (mainly centered on the study of symptoms and laboratory tests) in favor of a biopsychosocial model.Citation1,Citation2 Several studiesCitation3–Citation5 have shown that when patients are more involved in and “better informed” about the treatment of their condition, they are better able to manage their treatment plan. However, in a medical context, defining what “well informed” means is not easy at all as it involves assessing not only what a doctor says but what “the patient understands”. For example, it is known that 40%–80% of the information provided by the doctor is almost immediately forgotten by the patient or remembered incorrectly.Citation6 This is probably one of the reasons why the percentage of patients who adhere to medical instructions varies about from 40% to 90% and only half of all drugs are taken as per medical recommendation.Citation7,Citation8
The plethora of studies concerning doctor–patient communicationCitation9–Citation15 can be roughly divided into three categories: descriptive studies, aimed at analyzing the content and the interaction process; correlational studies, in which the interaction between knowledge, comprehension, satisfaction, and adherence to the treatment is evaluated; and intervention studies, which are centered on improving the skills of health care professionals. One aspect is, however, common to all these types of study, that is, the objective is to “appreciate and comprehend the patient’s perspective and his/her behavior”.Citation16 The objective of the present study (that can be ascribed to the first category) is also to provide evidence that in addition to content, certain specific characteristics of the structure itself of any communication can influence the degree of comprehension with the focus on the deliberate use of opposites. The results demonstrate the benefits of using a specific methodology (ie, Rash Models) in order to assess the relative weight (in terms of impact) that patients give to the terms used to communicate.
The impact of various types of information and the patient’s perception of the condition of their health
Various models have been put forward concerning the psychological factors which influence people’s decisions concerning their health.Citation17,Citation18 Perception of risk is one of the key factors.Citation19–Citation22 Some empirical assessments of individual beliefs and values regarding certain types of information and contexts have shown, for example, that the attitude of Italian citizens toward participating in clinical trials depends on whether a preventive intervention or the treatment of a disease is involved. Less than 30% of participants said they would agree to participate in a trial involving a “vaccination” (ie, in a situation in which the person was not suffering from a disease and their perception was of low risk) and only 5% would give their permission for a younger relative to participate. In contrast, almost 50% indicated that they would agree to take part in a therapeutic randomized clinical trial in a situation in which they had been diagnosed with a disease and a greater degree of risk was perceived.Citation23,Citation24 Several studies have found this bias toward omission.Citation25–Citation29 For instance, people prefer not to vaccinate their children against a potentially fatal case of influenza (ie, omission or inaction) even if this choice might represent a greater risk of death than the vaccination itself (ie, commission or action).Citation26,Citation30,Citation31 Conversely, in cases involving diagnoses of cancer, people manifest a preference for actionCitation26 since they feel a strong need to combat the disease. Information content (ie, influenza vs cancer and the presence/absence of disease or preventive intervention) is, therefore, a decisive factor from a psychological point of view, but another critical factor is the formatting of information.Citation32–Citation37 Studies aimed at finding ways to optimize people’s understanding in cases where informed consent is required have explored the impact of using multimedia (eg, graphics and visual aids, videos, bullet pointed texts, etc),Citation38–Citation40 as well as question and answer sessions or focus group discussions with nurses and/or doctors,Citation41 and the use of techniques including varying the length and complexity of sentencesCitation42 and using bipolar or unipolar structures.Citation43 The way in which information is structured in doctor–patient communication and how this impacts on the patient’s understanding has also been the subject of research which goes beyond the case of informed consent. For instance, Ong et alCitation44 used the Roter Interaction Analysis System classification systemCitation45 to assess the impact of various different categories of information on patient satisfaction in oncological consultations. This methodology was also used by Ishikawa et alCitation46 in a cancer study in Japan. In their study, Venetis et alCitation47 showed that increasing the use of nominalization, concrete nouns, and group nouns may be a good way to provide patients with more thorough information in a more accessible manner (the context in that case was patients with breast cancer). Robinson and HeritageCitation48 studied the association between the format of doctors’ opening questions which prompt patients to present concerns and the patients’ post-visit evaluations of the relative affective-relational dimension. Siminoff et alCitation49 found that in order to optimize the degree of comprehension in patients, doctors should structure their clinical encounters with a view to increasing the patient’s affective participation by means of encouraging them to ask questions and actively participate in the decision-making process.
In the present study, a simulated doctor–patient communication scenario was used to investigate both the psychological impact of various types of content in the context of oncological diagnosis and the effect of using a different communication format, namely, the inclusion of overt references to opposite poles (such as large vs small, common vs rare, or difficult vs easy to cure) as compared to unipolar communication in which opposite semantic anchors are not provided. The impact of these variations in content and structure was assessed in terms of the participants’ self-reported perception of 1) the condition of their health, 2) the risks pertaining to the disease and adhering to and completing the proposed treatment regimen, and 3) the commitment required to engage in and complete the treatment.
The impact of the information was assessed by means of self-reported perception rather than by observing its direct effect on psychological aspects such as decision making or the choice of treatment. Rasch modelsCitation50,Citation51 were used to analyze the response data. However, an evaluation of psychological aspects is also important, and the results of this study suggest a line of research and a type of methodology that can be easily extended to provide valuable information. For instance, Gavaruzzi et alCitation52 found that decision making in a cancer scenario depends on the “perceived severity of the disease”, which in turn depends on how the patient has been informed about his/her condition, that is, whether the tumor is malignant or benign or is a benign tumor that could become malignant in the future or increase in size. This may also include advice about the type of treatment (ie, watchful waiting or surgery). The present study investigates more deeply the extent to which the patient perceives the severity of his/her condition. This was done by focusing on a set of information which includes some of the topics considered in Gavaruzzi et al’s study, but further aspects were also investigated relating to the nature of the disease, and the duration and side effects of the treatment and their impact on the patient’s quality of life. In particular, the research focused on three dimensions: the participant’s perception of the condition of his/her health (H), the degree of risk (R), and the degree of commitment relating to the treatment prescribed (T). The relationship among these three ratings was studied, and the effects of modulating the information by means of varying the structure of the communication were explored.
Understanding the type of information that leads to a disease being perceived as more severe in terms of these three psychological dimensions might make it easier for doctors to comprehend what lies beneath a patient’s decision regarding treatment. It might also help doctors and health practitioners to narrow the gap between how they communicate the gravity of a disease and how patients understand and evaluate the situation accordingly. We feel that the results of this study may also be helpful in the context of clinical trials as they show a promising way to address the recurrent concern that communications concerning informed consent need to be improved.Citation36,Citation53–Citation57
The study
The study had three main aims. The first was to scale the information that was given to the participants in a simulated oncology scenario (conveyed by means of simple verbal statements constituting the “items” in the questionnaire). This referred to the nature of the disease or the characteristics of the treatment, from its duration to the incidence of adverse side effects and any changes in terms of quality of life during and after treatment. These items were rated by the participants with reference to their subsequent perception of impairment to health (H), the risk inherent to the disease and the proposed treatment (R), and the commitment relating to engaging in the treatment (T). The “weight” of each verbal statement was obtained by applying the Rasch measurement modelCitation50,Citation51 with the result expressed in logit scores along three different unidimensional scales (“Statistical analysis” section).
The second aim was to explore whether specific characteristics relating to the structure of the communication were associated with significantly different locations along the three dimensions. In particular, we included three different types of items in our initial set: 1) items expressed in terms of opposite properties (eg, small nodule–large nodule, minor side effects–severe side effects); 2) items expressed quantitatively without any reference to opposites (eg, referring to the size of the nodule in centimeters or to the incidence of side effects in percentages); or 3) items expressed in a “neutral” way (eg, referring to the existence of a nodule or the existence of side effects without qualifying or quantifying them). We assessed the relative impact of these various communication types by studying whether the use of opposites affected the participant’s perception in any way. The decision to use “opposite properties” was based on the results of a previous studyCitation43 which indicated that people’s understanding and satisfaction with how information is conveyed is greater when opposites are used. Henceforth, this variable will be referred to as Communication Type and the two relative levels as Bipolar communication (B) when opposites are used (eg, “The medical tests have revealed the presence of a small nodule”) and Unipolar communication (U) when opposites are not used (eg, “The medical tests have revealed the presence of a 0.5 inch nodule”). Secondly, we focused on Polarity in order to determine whether the items elicited significantly different responses depending on whether there was a reference to the very negative (VN) or slightly negative (SN) pole of the dimension concerned (eg, “The medical tests have revealed the presence of a large nodule”; “The medical tests have revealed the presence of a small nodule”) or whether there was no mention of either one pole or the other (neutral negative: NN, eg, “The medical tests have revealed the presence of a nodule”, with no reference to whether it is large or small). Thirdly, the effect of the presence or absence of quantified information was studied.Citation58–Citation60 Our initial set of items consisted of four different types of communication (ie, “numerically expressed” quantity (NM), eg, “1 in a 100”; “qualitatively expressed” quantity (QL), eg, the type of tumor is “common”; “vaguely expressed” quantity (VG), eg, “The duration of the adverse side effects varies over time”; and “no” quantity (NO), eg, “This treatment is administered on an inpatient basis”). The effect of this variable on the ratings given by the participants was evaluated.
The third main aim of the study was to obtain regression functions that would permit us to predict a participant’s responses for one dimension based on his/her responses for another dimension. For example, a doctor might start with a patient’s reaction to a specific item in one of the three dimensions (eg, risk, R) in order to predict his/her reaction to the same item in the other two dimensions (ie, perception of the condition of his/her health, H, and perception of the degree of commitment required, T).
From a methodological point of view, the application of Rasch models allowed us to reach these three main goals (“Statistical analysis” section).
Subjects and methods
Participants
Four hundred and seventy Italian undergraduate students (University of Verona, non-medical faculties) and their relatives participated voluntarily and anonymously in the study (297 F, 173 M; mean age 28.73, SD=9.11). Written informed consent was provided by each participant. We used this sample of subjects in order to maximize the impact of the type of information being given since it was made up of people who would not usually receive this sort of communication. The study complied with the Helsinki ethics protocol and was approved by the Ethics Committee of the University of Verona (where the data were collected).
Materials
A paper questionnaire consisting of 82 items (verbal statements) was used. A scenario was described as follows:
Imagine that your doctor has recommended that you have some medical tests at a center specialized in oncological diagnoses in order to ascertain whether or not you have a health problem. You have done the tests and now you are talking to the doctor who tells you what the situation is. During the interview, he/she gives you various pieces of information.
The 82 items which followed were each related to various pieces of information. The following are examples of the items presented: “Medical tests have shown the presence of a 0.5 inch long nodule”; “Medical tests have revealed the existence of a benign nodule”; “This type of tumor is common”; “This tumor is easy to treat”; “This treatment has a 70% efficacy rate”; “The standard treatment for this tumor has minor adverse side effects”; and “This treatment takes 15 days to complete”. The complete list of items is reported in .
Participants were asked to provide three ratings (on a scale ranging from 0 to 10) for each item, expressing their perception of the degree of impairment to Health (H), the Risks involved (R), and the degree of commitment required for the Treatment (T).
The items used in the questionnaire had been identified in a previous study,Citation43 based on two sources: the information exchanged between doctors and patients in a series of videos simulating typical dialogues in diagnostic and follow-up consultations (produced by the psychology department and the medical staff of the Italian National Cancer Institute [Centro di Riferimento Oncologico in Aviano, Italy]) and information concerning the nature and incidence of side effects as commonly presented in standard informed consent forms. From a communicative point of view, three different structures were used: one that made reference to opposite properties, one that used quantitative expressions, and one was “neutral” (ie, with no quantification or qualification in terms of opposites).
The order of the 82 items in the questionnaire and of the three response scales (H, R, T) was randomized among participants.
Procedure
The questionnaire was given to each participant, either during the University Open Day or during psychology lectures on topics unrelated to the subject of the study. The questionnaire was completed individually in a quiet room at the university. No fixed amount of time was established, but, on average, the participants took between 30 and 40 minutes to fill in the questionnaire.
Statistical analysis
The ratings on the three response scales (raw data) were transformed by means of a Rasch analysis. The Rasch unidimensional measurement model was used since it deals with responses as a function of the interaction between two quantitative latent dimensions, one concerning the characteristics of the “person” and another concerning the characteristics of the “items”.Citation51,Citation62–Citation65 Their specific meaning depends on what is being assessed. For example, in an educational context, the former measure usually indicates the ability of a person and the latter the difficulty of an item. In medical contexts, the former measure indicates the person’s perception of the condition of their health and the latter indicates the degree of severity conveyed by each item.Citation61,Citation65
Rasch models address the weaknesses of traditional approaches to measurement (the classic test theory) by yielding to measurements of latent dimensions which are objective and based on the principles of fundamental measurement.Citation66,Citation67 In other words, item calibrations that are independent of the characteristics of the individuals are produced and individuals are measured independently of the characteristics of the items. Fundamental measurement is taken for granted in the physical sciences, whereas in social sciences raw scores and the sum or means of these scores are typically considered as “measures” of a dimension independently of whether or not they conform to the principles of fundamental measurement.Citation68 The measures obtained by means of application of the Rasch model have the following measurement properties: 1) linearity – the combinations (ie, sum, mean, etc) relating to the raw scores given by the participants using a categorical or rating response scale do not constitute an interval measurement scale due to the nonlinear metric nature of this procedure;Citation62 on the contrary, the unit of measurement (logit) defined by means of application of Rasch models (logit) and derived from the logarithmic form of the model has the same constant value all along the continuum of the latent dimension; 2) specific objectivity – the relationship between stimulus parameters defined by the application of a Rasch model is not influenced by subject parameters and vice versa; and 3) stochastic independence – the probability associated with a pattern of responses given by a subject n to the stimulus i is the product of the response probabilities given to each of the i stimuli.
Technical notes
All the statistical analyses were performed using the R software.Citation69 The Rasch analysis was conducted using the Partial Credit Model by MastersCitation70 by means of the eRm package.Citation71 For Rasch Fit statistics (in order to flag items which did not fit), we used the infit-t statistics (namely, values out of the ±2 range, as suggested by Wright and Linacre,Citation72 Linacre,Citation73 Smith,Citation74 Linacre),Citation75 and the Chisq statistical probability (ie, P<0.05, as suggested by Bland and Altman).Citation76 As an index of the reliability of the instrument, we used the Person Separation Reliability Index (PSRI)Citation51 which is the Rasch equivalent of the Cronbach’s α. It ranges between 0 and 1; the closer its value is to 1, the greater is the probability that the differences among the participants’ measures express actual differences in the status of the participants along the three dimensions.
Results
Screening of the 82 items for each dimension (impairment to Health, Risks involved, degree of commitment to the Treatment)
The fit of our initial 82 items to the Rash model was assessed. Each item was evaluated separately for the three dimensions (H, R, T) using the two exclusion criteria described above (infit-t statistics: out of the range ±2; Chisq: P<0.05). This allowed us to eliminate the items with a bad fit, thus improving the measurement properties of the final questionnaire. Sixty-one of the initial 82 items (74%) turned out to have a good fit with the impairment to Health scale, 65 of the initial 82 items (79%) had a good fit with the Risk scale, and 69 (84%) had a good fit with the degree of commitment to the Treatment scale. The complete list of items and their scaling values (Location) is reported in , where the gray background indicates misfit items, that is, those that were then eliminated from the subsequent analyses. The scaling values (reported in the “Location” columns) express the position of the items on the three scales relating to the three dimensions (H, R, T). In order to make the interpretation of these values easier and to make it possible to compare the three dimensions, the scaling values were adjusted so that the minimum value for each dimension was zero. The PSRI also turned out to be good for all three dimensions (H=0.951, R=0.938, T=0.947). The significant number of items with a good fit (61–69) in addition to the high values of the PSRI proves that most of the items used in the initial questionnaire were valuable for the assessment of the three target dimensions in that they satisfied the properties of the fundamental measurement. This also means that the resulting subset of items (after exclusion) constitutes a valuable item bank.
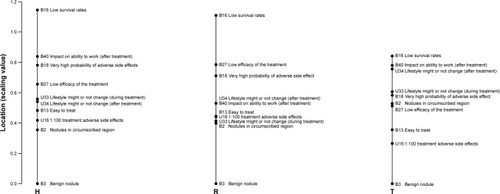
shows an example of the location of some of the information along the three dimensions (for the complete verbal formulation of the items indicated in by the alpha–numeric initials and for the complete list of items selected as having a good fit with each of the three dimensions, see ). The three scales in give an idea of how the items were associated with a varying perception of severity relating to state of health (scale on the left), the risks involved (central scale), and the degree of commitment required by the treatment (scale on the right) and how their relative position shifted between dimensions. This triple rating for the same item represents a further development of a well-known Rasch approach which has been used for a long time in health care studiesCitation65,Citation77–Citation81 and has been recently applied specifically in studies concerning a cancer scenario.Citation82–Citation86
Figure 1 The scales relating to ten of the items with a good fit for the three dimensions: impairment to Health (H), Risks involved (R), and the degree of commitment required by the Treatment (T). For the complete list of the items fitting in with each of the three dimensions, see Table S1.
Analysis of the scaling values based on the structure of the items
Independent of the content of the items, we analyzed whether their position along the three dimensions (ie, the scaling values) also depended on their structure. The three aspects that were considered (as described in the “Introduction” section) were: Communication Type (Bipolar, B vs Unipolar, U), Polarity (positive, P, negative, N, or no mention of either of the poles, NN), and Quantity (numerically expressed quantity, NM; qualitatively expressed quantity, QL; vaguely expressed quantity, VG; no quantity, NO).
An ANOVA was performed on each dimension to test the effect of the three variables: Communication Type (B, U), Polarity (SN, VN, NN), and Quantity (NM, QL, VG, NO). This was done after having verified the normality and homoscedasticity of the distributions (by means of Shapiro and Levene tests, respectively). Communication Type turned out to be significant in two out of the three dimensions, H (F(1, 56)=19.603, P<0.0001) and R (F(1, 60)=5.017, P=0.028) – see the top graphs in . In both cases, the use of opposites in communication (B) was associated with higher localizations on the scales, indicating the perception of a more severe state of health and greater risks.
Figure 2 Effect plots for Type of Communication (B or U) and Polarity (VN, SN, and NN) resulting from the ANOVA described in the text. Bars represent the 95% CI. Contrasts (Bonferroni) and Cohen’s effect size (d) values are reported within each plot.
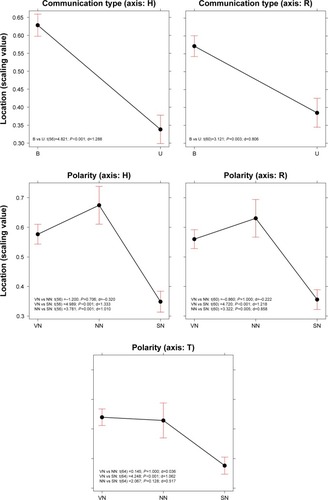
Polarity turned out to be significant for all three dimensions (H: F(1, 56)=14.708, P<0.0001; R: F(1, 60)=13.298, P<0.0001; T: F(1, 60)=9.567, P=0.0002). The non-polarized information (NN) resulted in similar estimations of the perceived severity of the condition of health, the risk, and commitment involved relating to the SN information, and both were significantly greater than the results for the VN communication type (). No significant effect emerged for the Quantity variable, either as a main effect or in interaction with other variables.
We also explored whether there was a significant association among these three variables – Communication Type (B, U), Polarity (VN, SN, NN), and Quantity (NM, QL, VG, NO) – and the Exclusion/Inclusion of an item from the selection described in the “Screening of the 82 items for each dimension (impairment to Health, Risks involved, degree of commitment to the Treatment)” section in the “Results” section.
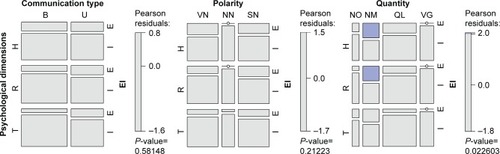
Mosaic plots were used to represent and study these associations (). A mosaic plot represents the frequencies of a contingency table by means of the size of the tiles; the interaction between variables is evaluated by means of the asymmetrical nonalignment of the tiles, and the significance of the difference between the observed and expected frequencies according to a specific model is determined by means of the color of the tiles. In our case, the model tested was a log-linear model of independence between variables. As shown in , no significant association emerged between the frequency of Excluded (E) or Included (I) items and the various levels of Communication Type or Polarity. The only significant association concerned Quantity: as the blue tiles indicate (, mosaic to the right), the items where quantity was expressed by means of numbers (NM) were particularly frequent in the case of Excluded items.
Figure 3 Mosaic plots showing the frequency of E and I items for the three axes (H, R, T) based on Communication Type (mosaic on the left), Polarity (central mosaic), and Quantity (mosaic on the right). The two levels for Communication Type are B and U. The three levels for Polarity are VN, SN, and NN. The four levels of Quantity are NM, QL, VG, and NO. The color of the tiles corresponds to Pearson residuals and the bars to the right of each mosaic show which color corresponds to residuals greater than the cut-off points |2| (corresponding to a P<0.05).
The relationship among the values for the H, R, and T dimensions and the relative conversion table
The subset of 53 items that had a good fit with all three dimensions was used to study the relationships among the three dimensions. In all cases, the linear function models turned out to have the best fit to our data (ie, a simpler function and higher R2). The fits of the logarithmic, power, and exponential functions were also tested. The significant relationships among H, R, and T are reported in .
Table 1 Linear models describing the relationships among the dimensions: Health (H), Risks (R), and commitment to the Treatment (T)
Six linear functions were obtained (H=f(R), R=f(H), H=f(T), T=f(H), R=f(T), T=f(R)). The average between the two functions referring to the same two dimensions (eg, H=f(R) and R=f(H)) was used to calculate the conversion table presented in . By means of the functions reported in the table, it was possible to study a person’s responses on one scale and make a likely estimate of his/her responses on another scale.
Table 2 Conversion functions that can be used to make estimates of participants’ responses on other scales
For example, let us imagine that a doctor is going to communicate a certain set of information during a medical consultation. For the sake of simplicity, let us assume that the information is the one represented in (ie, relating to the ten items reported below in , column 1: Item). The doctor might ask the patient to rate his/her perception of the degree of impairment to his/her health based on the ten items of information provided, and we may assume that the ten raw scores given by the patient are those reported in , column 2. We already know from the results reported in that each item has a certain “weight” (as defined by its location on the H dimension), so the doctor can use these location values to “correct” the raw score given by the person and then, based on these corrected values, come up with an evaluation of how the patient perceives the situation (, column 4). Furthermore, the doctor might use the functions reported in to make a good estimate from the above-mentioned weighted score for H regarding the patient’s perception of the risks involved (R) and the commitment required for the treatment (T), that is, estimate the values in , columns 5 and 6.
Table 3 Example showing how the locations of the items described in Table S1 can be used to weigh the raw scores provided by a participant on the H scale (thus obtaining the scores reported in the fourth column) and how it is possible to estimate the scores in the other two dimensions (R and T) based on the regression functions in (scores reported in the fifth and sixth columns)
shows the item bank. A doctor might select some elements (it is not necessary for the doctor to use all the items) out of the whole set of items listed and use them in the context of doctor–patient communications. In this way, the doctor will have a good idea a priori concerning the potential impact of any given item. The weightings reported in are based on the results of the present study, and thus reflect the characteristics relating to the participants who took part. The aim of the study was to find a procedure which would be useful in terms of assessing a patient’s understanding of any information given to him/her. If health practitioners have a better idea regarding the potential impact of any information given on a patient, this will help them to choose the best way of communicating, which will be beneficial to any therapy required.
Final discussion
Health care staff must ensure the quality of a patient’s understanding of any information provided in contexts where the patient is required to make decisions and be more effectively involved in the treatment process.Citation87 Modeling the importance which people attach to the various pieces of information they receive seems to be a promising way to help doctors and health practitioners have a better understanding of how the patient sees his/her situation, enabling them to provide more tailored assistance (for a review of the debate concerning the disclosure of information and the comprehension of disclosed information, see CoxCitation88). It may also help medical staff to understand why patients decide to choose omission vs commission.Citation17,Citation89 The study presented in this paper adds to previous studies showing the advantage of using Rasch analyses to model psychological constructs related to health status.Citation65,Citation77–Citation83 This model allows researchers to come up with robust (sample free) scalings of the items of information in terms of the psychological constructs of interest. These concern the condition of the patient’s health (H), the risks involved (R), and the degree of commitment to the treatment prescribed (T). The subset of items resulting from the scaling procedures performed as part of the study () provides an example item bank that health care staff might be interested in utilizing and building on. Information concerning, for instance, the size of a nodule “might not seem to a doctor” to adequately convey the situation, since the size of a tumor is not necessarily related to how serious it is. However, it is important to assess whether this is also the case “from the patient’s point of view”. If not, there is the risk of the situation seeming extremely serious to the patient, leading to a potential misinterpretation. Being aware of this is an important point of departure.
When looked at from the point of view of the specific content considered in this study, our findings both consolidate previous results and add new knowledge. For instance, in the study carried out by Gavaruzzi et al,Citation52 patients’ reactions to the information that a “benign tumor” had been found were not significantly different to their reactions in cases where no tumor was found. Our findings in a sense confirmed the very low perception of severity associated with communications of this type. The item in the questionnaire relating to the statement “The medical tests have revealed the presence of a small nodule” turned out to be at the extreme end of all of the three scales we referred to, since it elicited minimum values relating to impairment to health, the perception of risks, and the degree of commitment relating to the treatment prescribed ( and ). Regarding genetic predisposition, Gavaruzzi et alCitation52 also found that doctor–patient communications concerning a “genetic predisposition” for a non-tumorous illness had the same impact (in terms of decisions about active treatment) as communications concerning the presence of (and not only the predisposition for) a non-tumorous illness. In our study, the item stating “This tumor is always connected to a genetic predisposition” (B13) elicited significantly lower values for all three dimensions (H=0.483, R=0.445, T=0.356) than the opposite item, “This tumor is never connected to a genetic predisposition” (B14; H=0.724, R=0.723, T=0.543). This suggests that a genetic predisposition was associated in the participants’ minds with a less serious condition.
If we then consider the structure of the items, our findings contribute valuable information to the question of the role that opposites might play in doctor–patient communication. We know that opposites have a special status in human cognitive organization and that they are common to all natural languages and are intuitively and naturally understood and learnt.Citation90–Citation92 We also know that, when used in oncological consultations, they seem to improve the degree of understanding and satisfaction with how the information has been communicated and induce a greater degree of commitment and a more accurate perception of the severity of the disease and the risks involved.Citation43 The results presented in the present paper confirm that the items which referred to opposites (Communication Type B in ) were generally associated with a perception of greater severity in terms of H and R, and participants had a clearer idea regarding whether the information communicated was very negative (VN in ) or slightly negative (SN in ). Conversely, when information was provided qualitatively but without any mention of either of the poles (NN in ), the overall perception of the severity of the disease did not significantly differ from the information which referred to the negative pole. Paraphrasing previous findings concerning cancer patients’ understanding that “no news is not good news”,Citation93 our results suggest that “non-polarized news is not good news”. Lastly, the verbal statements including quantitative expressions were frequently among the items which were excluded from the scalings resulting from the application of the Rasch model due to lack of fit. This suggests that responses to those items did not presuppose the same cognitive dimension as those relating to the responses to the other type of items. This result adds to the literature on the specificity of using quantitative information.Citation94–Citation96
We are aware that any generalizations to real situations of the results discussed in this paper which were obtained with healthy volunteers in a simulated context have to be made with caution. Previous results have shown that people with life-threatening illnesses often interpret information concerning the risks of a particular course of treatment differently from healthy controls.Citation87,Citation97,Citation98 However, the suggestions regarding methodology put forward in this paper may stimulate future tests with real patients. The results indicate that it is possible to assess the impact of information conveyed by means of verbal statements (which may vary in terms of content and structure) in the context of doctor–patient communications. This would allow a better intentional modulation of any communication by health care staff (in terms of H, R, and T), enabling them to anticipate the impact on the patient. In addition to being useful in every context where doctors and patients interact, this type of knowledge may also be useful for the forms used for informed consent and for medical/pharmaceutical leaflets, especially with regard to side effects.
Supplementary material
Table S1 Complete list of the items used in the questionnaire and the corresponding classification of each item in terms of Polarity
Disclosure
The authors report no conflicts of interest in this work.
References
- InerneySJMIntroducing the biopsychosocial model for good medicine and good doctorsBMJ20183241533
- Borrell-CarrióFSuchmanALEpsteinRMThe biopsychosocial model 25 years later: principles, practice, and scientific inquiryAnn Fam Med20042657658215576544
- BergesonSCDeanJDA systems approach to patient-centered careJAMA2006296232848285117179462
- DoyleCLennoxLBellDA systematic review of evidence on the links between patient experience and clinical safety and effectivenessBMJ Open201331e00157018
- StewartMAEffective physician-patient communication and health outcomes: a reviewCMAJ19951529142314337728691
- McGuireLCRemembering what the doctor said: organization and adults’ memory for medical informationExp Aging Res19962244034288968711
- CantrellCRPriestJLCookCLFinchamJBurchSPAdherence to treatment guidelines and therapeutic regimens: a US claims-based benchmark of a commercial populationPopul Health Manag2011141334121142978
- BrownMTBussellJKMedication adherence: WHO cares?Mayo Clin Proc201186430431421389250
- StreetRLMakoulGAroraNKEpsteinRMHow does communication heal? Pathways linking clinician–patient communication to health outcomesPatient Educ Couns200974329530119150199
- MatusitzJSpearJEffective doctor–patient communication: an updated examinationSoc Work Public Health201429325226624802220
- ZolnierekKBDimatteoMRPhysician communication and patient adherence to treatment: a meta-analysisMed Care200947882683419584762
- RodinGMackayJAZimmermannCClinician–patient communication: a systematic reviewSupport Care Cancer200917662764419259706
- OngLMde HaesJCHoosAMLammesFBDoctor–patient communication: a review of the literatureSoc Sci Med19954079039187792630
- van DalenJCommunication skills in context: trends and perspectivesPatient Educ Couns201392329229523810181
- HaJFLongneckerNDoctor–patient communication: a reviewOchsner J2010101384321603354
- NaughtonCPatient-centered communicationPharmacy201861818
- BiedrzyckiBADecision making for cancer clinical trial participation: a systematic reviewOncol Nurs Forum2010376E387E39921059572
- NelsonWStefanekMPetersEMcCaulKDBasic and applied decision making in cancer controlHealth Psychol2005244SS3S816045416
- BowlingAEbrahimSMeasuring patients’ preferences for treatment and perceptions of riskQual Health Care2001101i2i811533430
- BrewerNTChapmanGBGibbonsFXGerrardMMcCaulKDWeinsteinNDMeta-analysis of the relationship between risk perception and health behavior: the example of vaccinationHealth Psychol200726213614517385964
- LoewensteinGFWeberEUHseeCKWelchNRisk as feelingsPsychol Bull2001127226728611316014
- SlovicPPerception of RiskLondonEarthspan2001
- ApoloneGMosconiPKnowledge and opinions about clinical research. A cross-sectional survey in a sample of Italian citizensJ Ambul Care Manage2003261838712545517
- MosconiPPoliPGioloAApoloneGHow Italian health consumers feel about clinical research: a questionnaire surveyEur J Public Health200515437237916014662
- AbereggSKHaponikEFTerryPBOmission bias and decision making in pulmonary and critical care medicineChest200512831497150516162749
- RitovIBaronJReluctance to vaccinate: omission bias and ambiguityJ Behav Decis Mak199034263277
- BaronJRitovIReference points and omission biasOrgan Behav Hum Decis Process1994593475498
- BaronJRitovIOmission bias, individual differences, and normalityOrgan Behav Hum Decis Process20049427485
- ConnollyTRebJOmission bias in vaccination decisions: where’s the “omission”? Where’s the “bias”?Organ Behav Hum Decis Process2003912186202
- AschDABaronJHersheyJCOmission bias and pertussis vaccinationMed Decis Making19941421181238028464
- DibonaventuraMChapmanGBDo decision biases predict bad decisions? Omission bias, naturalness bias, and influenza vaccinationMed Decis Making200828453253918319507
- FischhoffBRisk perception and communication unplugged: twenty years of processRisk Anal19951521371457597253
- RothmanAJSaloveyPShaping perceptions to motivate healthy behavior: the role of message framingPsychol Bull199712113199000890
- NishimuraACareyJErwinPJTilburtJCMuradMHMcCormickJBImproving understanding in the research informed consent process: a systematic review of 54 interventions tested in randomized control trialsBMC Med Ethics201314281428
- Paasche-OrlowMKTaylorHABrancatiFLReadability standards for informed-consent forms as compared with actual readabilityN Engl J Med2003348872172612594317
- BrandbergYJohanssonHBergenmarMPatients’ knowledge and perceived understanding – associations with consenting to participate in cancer clinical trialsContemp Clin Trials Commun201621561129736441
- KassNETaylorHAAliJHallezKChaissonLA pilot study of simple interventions to improve informed consent in clinical research: feasibility, approach, and resultsClin Trials2015121546625475879
- KarunaratneASKorenmanSGThomasSLMylesPSKomesaroffPAImproving communication when seeking informed consent: a randomised controlled study of a computer-based method for providing information to prospective clinical trial participantsMed J Aust2010192738839220367586
- TaitARVoepel-LewisTZikmund-FisherBJFagerlinAThe effect of format on parents’ understanding of the risks and benefits of clinical research: a comparison between text, tables, and graphicsJ Health Commun201015548750120677054
- HenryJPalmerBWPalinkasLGloriosoDKCaligiuriMPJesteDVReformed consent: adapting to new media and research participant preferencesIRB200931218
- KassNETaylorHAAliJHallezKChaissonLA pilot study of simple interventions to improve informed consent in clinical research: feasibility, approach, and resultsClin Trials2015121546625475879
- StunkelLBensonMMclellanLComprehension and informed consent: assessing the effect of a short consent formIRB201032419
- BurroRSavardiUAnnunziataMAde PaoliPBianchiIThe effects of presenting oncologic information in terms of opposites in a medical contextPatient Prefer Adherence20181244345929628757
- OngLMVisserMRLammesFBde HaesJCDoctor–patient communication and cancer patients’ quality of life and satisfactionPatient Educ Couns200041214515612024540
- OngLMVisserMRKruyverIPThe Roter Interaction Analysis System (RIAS) in oncological consultations: psychometric propertiesPsychooncology1998753874019809330
- IshikawaHTakayamaTYamazakiYSekiYKatsumataNPhysician– patient communication and patient satisfaction in Japanese cancer consultationsSoc Sci Med200255230131112144143
- VenetisMKStaplesSRobinsonJDKearneyTProvider information provision and breast cancer patient well-beingHealth Commun201827111
- RobinsonJDHeritageJPhysicians’ opening questions and patients’ satisfactionPatient Educ Couns200660327928516431070
- SiminoffLARavdinPColabianchiNSturmCMDoctor–patient communication patterns in breast cancer adjuvant therapy discussionsHealth Expect200031263611281909
- RaschGProbabilistic Models for Some Intelligence and Attainment TestsChicagoUniversity of Chicago Press1980
- AndrichDRasch Models for Measurement68Newbury ParkSage1988
- GavaruzziTLottoLRumiatiRFagerlinAWhat makes a tumor diagnosis a call to action? On the preference for action versus inactionMed Decis Making201131223724420671207
- BrownRFButowPNEllisPBoyleFTattersallMHSeeking informed consent to cancer clinical trials: describing current practiceSoc Sci Med200458122445245715081196
- HietanenPAroARHolliKAbsetzPInformation and communication in the context of a clinical trialEur J Cancer200036162096210411044647
- HollandJBrowmanGMcDonaldMSaginurRProtecting human research participants: reading vs understanding the consent formJ Natl Cancer Inst20131051392792823821756
- MillerSMHudsonSVEglestonBLThe relationships among knowledge, self-efficacy, preparedness, decisional conflict, and decisions to participate in a cancer clinical trialPsychooncology201322348148922331643
- SchumacherASikovWMQuesenberryMIInformed consent in oncology clinical trials: a Brown University Oncology Research Group prospective cross-sectional pilot studyPLoS One2017122e017295728235011
- CosmidesLToobyJAre humans good intuitive statisticians after all? Rethinking some conclusions from the literature on judgment under uncertaintyCognition1996581173
- GigerenzerGHoffrageUHow to improve Bayesian reasoning without instruction: frequency formatsPsychol Rev19951024684704
- MacchiLPragmatic aspects of the base-rate fallacyQ J Exp Psychol A1995481188207
- BondTFoxCMApplying the Rasch Model: Fundamental Measurement in the Human SciencesAbingdonRoutledge2015
- WrightBDMastersGNRating Scale Analysis Rasch MeasurementChicagoMesa Press1982
- BurroRTo be objective in experimental phenomenology: a psychophysics applicationSpringerplus201651172027777856
- BurroRSartoriRVidottoGThe method of constant stimuli with three rating categories and the use of Rasch modelsQual Quant20114514358
- AnselmiPVidottoGBettinardiOBertolottiGMeasurement of change in health status with Rasch modelsHealth Qual Life Outcomes20151311625889854
- CampbellNRPhysics: The ElementsCambridgeCambridge University Press2013
- LuceRDKrantzDHSuppesPTverskyAFoundations of Measurement3San DiegoAcademic1990
- CavanaghRFRomanoskiJTRating scale instruments and measurementLearn Environ Res200793273289
- R Core TeamR: A Language and Environment for Statistical Computing [Internet]Vienna, AustriaR Foundation for Statistical Computing2018
- MastersGNA Rasch model for partial credit scoringPsychometrika1982472149174
- MairPHatzingerRExtended Rasch modeling: the eRm package for the application of IRT models in RJ Stat Softw2007209120
- WrightBDLinacreJMReasonable mean-square fit valuesRasch Meas Trans19948370371
- LinacreJMInfit Wdoand Outfit, mean-square and standardized mean?Rasch Meas Trans200216878
- SmithEVEvidence for the reliability of measures and validity of measure interpretation: a Rasch measurement perspectiveJ Appl Meas20012328131112011511
- LinacreJMFacets Rasch measurement computer program (Version 3810) [Computer Software]Chicago, ILWinsteps.com2018
- BlandJMAltmanDGMultiple significance tests: the Bonferroni methodBMJ199531069731707833759
- BelvedereSLde MortonNAApplication of Rasch analysis in health care is increasing and is applied for variable reasons in mobility instrumentsJ Clin Epidemiol201063121287129720971422
- ChristensenKBKreinerSMesbahMRasch Models in HealthLondonWiley2013
- EngbergAGardeBKreinerSRasch analysis in the development of a rating scale for assessment of mobility after strokeActa Neurol Scand1995911187572069
- VidottoGMoroniLBurroRA revised short version of the depression questionnaireEur J Cardiovasc Prev Rehabil201017218719720215970
- RocchiSGhidelliCBurroRThe Walsh family resilience questionnaire: the Italian versionNeuropsychiatr Dis Treat2017132987299929290684
- RustøenTLerdalAGayCKottorpARasch analysis of the Herth Hope Index in cancer patientsHealth Qual Life Outcomes201816119620530285767
- TyWChenCTHuangYJHouWHWangJDHsiehCLRasch analysis of the 9-item shared decision making questionnaire in women with breast cancerCancer Nurs20181929206682
- AshleyLSmithABKedingAJonesHVelikovaGWrightPPsychometric evaluation of the revised Illness Perception Questionnaire (IPQ-R) in cancer patients: confirmatory factor analysis and Rasch analysisJ Psychosom Res201375655656224290046
- CosteJTissierFPouchotJRasch analysis for assessing unidimensionality and identifying measurement biases of malignancy scores in oncology. The example of the Weiss histopathological system for the diagnosis of adrenocortical cancerCancer Epidemiol201438220020824631426
- BulsaraCEStylesIDevelopment of a cancer related patient empowerment scale using the polytomous Rasch measurement modelCancer Clin Oncol20132187102
- DegnerLFSloanJADecision making during serious illness: what role do patients really want to play?J Clin Epidemiol19924599419501432023
- CoxKInformed consent and decision-making: patients’ experiences of the process of recruitment to Phases I and II anti-cancer drug trialsPatient Educ Couns2002461313811804767
- BiedrzyckiBAFactors and outcomes of decision making for cancer clinical trial participationOncol Nurs Forum201138554255221875841
- MurphyMLSemantic Relations and the Lexicon: Antonymy, Synonymy and Other ParadigmsCambridgeCambridge University Press2003
- CroftWCruseDACognitive LinguisticsCambridgeCambridge University Press2004
- JonesSMurphyMLParadisCWillnersCAntonyms in English: Construals, Constructions and CanonicityCambridgeCambridge University Press2012
- FallowfieldLFordSLewisSNo news is not good news: information preferences of patients with cancerPsychooncology19954319720211655006
- ErevICohenBLVerbal versus numerical probabilities: efficiency, biases, and the preference paradoxOrgan Behav Hum Decis Process1990451118
- PoultonECBias in Quantifying JudgmentHillsdaleLawrence Erlbaum1989
- MoxeyLMSanfordAJCommunicating quantities: a review of psycholinguistic evidence of how expressions determine perspectivesAppl Cogn Psychol2000143237255
- MaslinAA survey of the opinions on ‘informed consent’ of women currently involved in clinical trials within a breast unitEur J Cancer Care (Engl)1994341531627704350
- BrockDWWartmanSAWhen competent patients make irrational choicesN Engl J Med199032222159515992336090