
Abstract
Background
Effectiveness of pharmacist-led educational interventions on self-care activities and glycemic control of type 2 diabetes mellitus (T2DM) patients is vague. The purpose of this review is to appraise the effect of pharmacist-led educational interventions on self-care activities and levels of glycated hemoglobin of T2DM patients.
Methods
Five electronic databases were searched from date of database inception to September 2017. Randomized clinical trials examining the effectiveness of pharmacist-led educational interventions, directed at T2DM patients only, were included for systematic review and meta-analysis. The protocol is available with PROSPERO (CRD42017078854).
Results
Eleven studies, involving n=1,544 T2DM patients, were included in this systematic review. Meta-analysis demonstrated that pharmacist-led interventions had a significant effect on lowering of the levels of glycated hemoglobin (−0.66; 95% CI [−0.83, −0.50]; I2=58.3%; P=0.008), in comparison to usual care. Self-care activities were assessed by using Summary of Diabetes Self-care Activities tool in eight studies. Overall meta-analysis of self-care activities for included studies demonstrated a significant effect of pharmacist-led interventions on improvement of self-monitoring of blood glucose (1.62; 95% CI [0.92, 2.32]; I2=70.5%; P=0.005), foot care (1.20; 95% CI [0.49, 1.90]; I2=95.0%; P<0.001), and overall diet (1.16; 95% CI [0.38, 1.93]; I2=64.2%; P=0.094).
Conclusion
The findings of this review demonstrate a significantly positive effect of pharmacist-led educational interventions on HbA1c levels and self-care practices among T2DM patients.
Supplementary materials
Figure S1 Risk of bias summary of included studies (n=11).
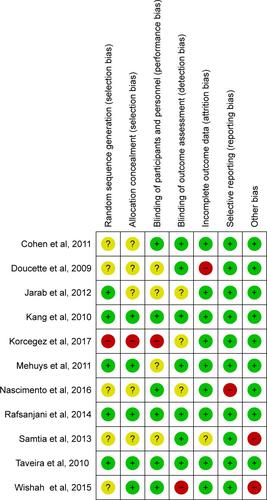
Figure S2 Risk bias graph of included studies (n=11).
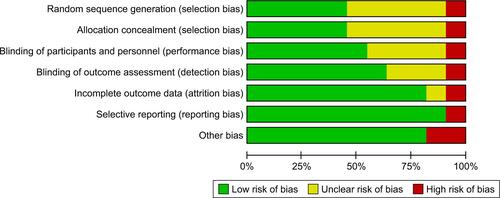
Figure S3 Sub-group meta-analysis for HbA1c on the basis of region (n=11). Weights are from random effects analysis.
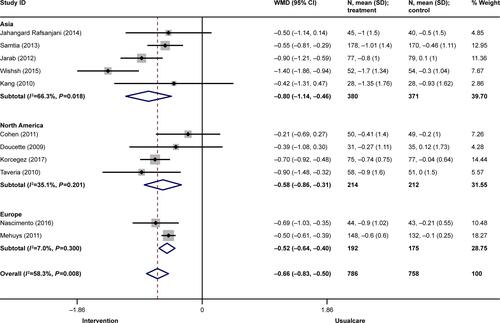
Figure S4 Sub-group meta-analysis for HbA1c of included RCTs on the basis of intervention provider (n=11).
Note: Weight are from random effects analysis.
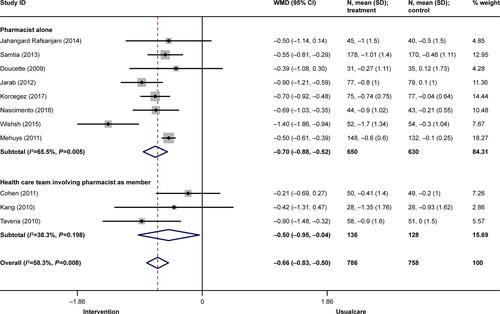
Figure S5 Sub-group meta-analysis for HbA1c of included RCTs on the basis of duration of study (n=11).
Note: Weights are from random effects analysis.

Figure S6 Sub-group meta-analysis for HbA1c of included RCTs on the basis of baseline HbA1c (n=11).
Note: Weights are from random-effects analysis.
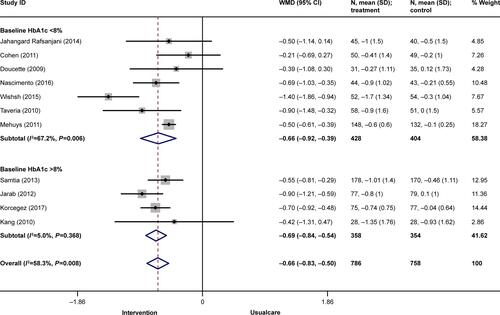
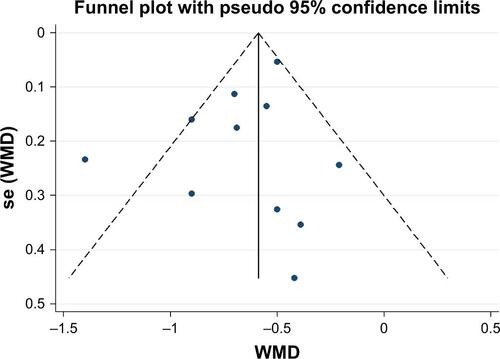
Figure S7 Funnel Plot of Publication Bias.
Disclosure
AB received a PhD Merit Scholarship from Monash University. KGC received a grant from the University of Malaya (PG089-2015B). The authors report no other conflicts of interest in this work.