
 ?Mathematical formulae have been encoded as MathML and are displayed in this HTML version using MathJax in order to improve their display. Uncheck the box to turn MathJax off. This feature requires Javascript. Click on a formula to zoom.
Abstract
Objectives: Differences in testosterone replacement therapy (TRT) gel products may affect patient satisfaction, quality-of-life, and treatment response and adherence. This study investigated preferences for TRT gel in terms of formulation and administration.
Methods: 525 male adults aged 45 years and over completed a discrete choice experiment. Respondents made repeated choices between two hypothetical testosterone gel treatments described according to four attributes: form, ease of use, impact of use on showering/swimming, and location/dosage of the application. Choice data were analyzed using a latent class model.
Results: Three preference classes were identified. Respondents across all classes displayed a preference for the gel being dispensed in smaller units with accurate dosing, waiting shorter times after the gel application before swimming/showering, and using 2.5 gm of gel to be applied to the inner thigh/abdomen as opposed 5 gm to shoulder/abdomen. The importance of these characteristics differed across classes, with preference class membership predicted by age and education level. For instance, younger men (aged 45–64 years) were more likely to belong to a class that prioritized reduced waiting time before being able to undertake activities. Formulation was not an important driver of choice.
Conclusions: Preferences demonstrate a predilection for TRT gel dispensed in small units allowing precise dosing, shorter waiting time after application, and application to the inner thigh/abdomen. However, the strength of importance of these characteristics differs between men. This study highlights the attributes of TRT gel considered important to patient subgroups, and which may ultimately affect treatment response, medication adherence, and patient quality-of-life.
Introduction
Testosterone deficiency syndrome (TDS), also known as late-onset male hypogonadism, is a clinical condition marked by low levels of testosterone.Citation1 Testosterone performs a key role in the growth and maintenance of the male reproductive system.Citation2 Although levels of testosterone naturally decrease as a result of the aging process, in men with TDS serum testosterone levels fall significantly below the levels of young men and this can negatively affect health-related quality of life.Citation3 TDS is estimated to occur in over 8% of men between the ages 50 and 79 with greater prevalence in men with obesity and in men with a poor health status.Citation2,Citation4
Symptoms associated with the condition include sexual problems such as erectile dysfunction, delayed ejaculation, reduced libido and lowered fertility, as well as decreased muscular formation, cognitive dysfunction, depression, decreased erythropoiesis (red blood cell production and visceral obesity).Citation2,Citation5 These low male sex hormone levels are, in particular, associated with metabolic and cardiovascular diseases such as hypertension, mild dyslipidemia, insulin resistance, Type 2 diabetes, and atherosclerosis.Citation5–Citation7
Treatment of TDS most commonly involves testosterone replacement therapy (TRT) and is usually considered for patients who are persistently suffering from erectile dysfunction and/or diminished libido and low testosterone levels.Citation1,Citation4 TRT aims to increase testosterone levels in order to minimize the symptoms associated with TDS.Citation8 TRT can be administered via tablets, patches, implants, injections, or gels. Different modes of administration are associated with differences in application site and frequency of administration, as well as the time taken to achieve and maintain serum testosterone levels as the desired therapeutic effect.Citation9
These differences mean that individual patient preferences for TRT play an important role in choice of treatment alongside clinical judgement. Topical gel has been shown to be preferred by most patients in the treatment of TDS rather than injection or patches.Citation10 Although the effectiveness of treatments at reducing TDS symptoms is paramount, other key factors for TRT preferences include ease of use, convenience of at-home administration (eg, in comparison to TRT injections), product characteristics, and treatment experience.
In addition to efficacy, manufacturers of TRT gels are becoming increasingly aware of the need to develop products that aim to minimize inconvenience to the patient, thereby improving the patient experience and increasing patient satisfaction while maintaining the level of effectiveness.Citation9–Citation11
This study aimed to compare features associated with TRT gel products using a discrete choice experiment (DCE) to assess which attributes are of most importance to patients.
Methods
Recruitment and data collection
A sample of 525 males aged 45 years and over was recruited by a third-party company (Qualtrics Ltd). We sought the perspective of men who were naive to TRT as this would represent the choice of men who first commence treatment following diagnosis. Therefore, to avoid biases developed by patients who have had experience of TRT therapies, any respondents who indicated that they had ever undertaken TRT were not eligible. As this was an anonymized survey and no personal medical or personally identifiable data were collected, this study was not submitted to an ethics review (http://www.hra-decisiontools.org.uk). Nevertheless, informed consent was obtained from participants, ie, the nature and aim of the study was provided to participants prior to participation. Potential participants were also informed that they could leave the survey at any stage. Participants were then asked to provide their consent to participate in the study before the survey commenced. The authors assert that all procedures contributing to this work comply with the ethical standards of the relevant national and institutional committees on human experimentation and with the Helsinki Declaration of 1975, as revised in 2008.
DCE attributes and levels
A DCE was administered as an online survey to investigate preferences for the delivery of testosterone gel. In a DCE, respondents are presented with a series of choices between two or more alternatives and are asked to select the alternative they prefer in each choice set. Each alternative is defined according to a combination of attributes and levels. The levels of the attributes are varied systematically across the alternatives. The relative importance of the attribute levels and the trade-offs individuals make when choosing one alternative over another are estimated through regression analysis of the choice data.
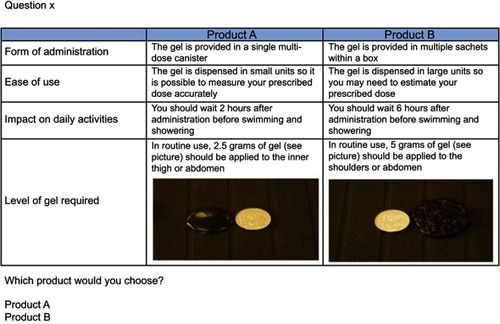
The final attributes and levels for the DCE choice sets are described in . These were based on the results of a pragmatic literature reviewCitation12 and clinician interviews. The DCE also included questions related to respondents’ socio-demographic characteristics and whether they had been previously treated with testosterone.
Table 1 Discrete choice experiment attributes and levels
Experimental design
Each respondent answered eight choice sets between two testosterone gel administration alternatives, similar to that shown in . For each choice set, the two products were described in terms of the same four attributes, each of which was varied across two levels (see Supplementary Online Material for the scenarios). This resulted in a total of 16 possible combinations which were paired using a full factorial fold-over design to create the 8 choice sets.Citation13
Figure 1 Example choice set from the discrete choice experiment.
Data analysis
The choice data were analyzed in NLogit statistical software (version 6, Econometric Software Inc.) using multinomial logit and mixed logit models for preliminary analyses and then a latent class model (LCM), ie, unobservable group membership, for the final analysis.Citation6 The preferred model was selected based on model fit (minimizing the Akaike Information Criterion, AIC). Behaviorally, the LCM essentially clusters individuals in the sample to different preference classes, thus allowing preferences across individuals in the sample to vary between classes but restricting them to be the same within a class.
Within each class, the utility function for the choice model was specified as a linear additive function of the main effects for each attribute level, as shown Equation (1).
In Equation (1), V(j) is the systematic (observed) utility associated with choice j (j= Alternative A or Alternative B in each choice set); β1–5 are the beta coefficients (also referred to as preference weights, marginal utilities, or part worths) associated with each attribute level; and Form, Ease, Impact, Gel are the effects coded attribute levels, as defined in .
The LCM assumes that individual behavior is influenced by both observable attributes and latent heterogeneity which varies across factors which are not observed by the researcher.Citation14 Thus, in this case, the LCM allows preferences for testosterone treatments to vary between participants and an assessment of associations between participant characteristics and preference class membership.Citation15 Respondents’ characteristics were effects coded and entered into the LCM model as potential predictors of class membership, and then removed using a backward-step approach if they did not explain preference heterogeneity (ie, predict class membership) at the 20%, 10%, and then 5% significance level.
Results
Sample characteristics
Complete choice data were available for all respondents (). More than half of respondents (76.6%) were younger than 65 years old. Nearly half had a university degree, diploma, or professional qualification (42.1%) and/or were employed in a managerial, administrative, or professional role (45.5%).
Table 2 Respondent characteristics for Discrete choice experiment (N=525)
DCE analysis
A total of 4,200 choice observations were included in the preference model (8 choices each from 525 respondents). The optimal LCM had three preferences classes (AIC/N 0.813). This model exhibited a better fit than both an LCM with 2 classes (AIC/N 0.900) and a mixed logit model (AIC/N 0.838). Attempts to estimate a fourth class resulted in identification problems. The LCM with three classes had a pseudo R2 of 0.42, representing an acceptable fit for a discrete choice model.
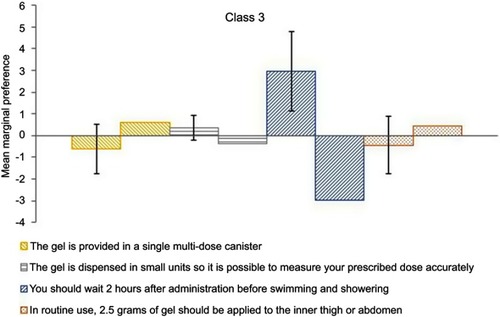
The coefficients in the LCM indicate the relative strength of preference or “preference weight” for improvements in the attribute levels (characteristics) of a testosterone gel treatment, for each class. and – summarize the preferences for improvements in each attribute level. Overall, respondents across all classes preferred the gel to be dispensed in small units with accurate dosage measurement rather than large units requiring dose estimation, waiting 2 rather than 6 hrs before swimming or showering, and 2.5 grams applied to the inner thigh or abdomen rather than 5 grams to the shoulders or abdomen (p<0.05). However, in Class 3 only the waiting time before undertaking activity drove choice of gel, and the strength of importance of these characteristics varied across classes.
Table 3 Latent class model results
Approximately one third of respondents exhibited preferences consistent with Class 1 (probability of membership 0.328). Preferences in this class were strongly driven by ease of administration; this class strongly preferred the gel to be dispensed in small units enabling accurate dosing. This characteristic was approximately 5 times as important as impact on swimming/showering and approximately 10 times as important as the location/dosage for application of gel (which was also only significant at the 10% level for this class).
Nearly half of respondents exhibited preferences consistent with Class 2 (probability of membership 0.433). Preferences in this class were less extreme than for the other classes, although the location/dosage for gel application was slightly more important than either the ease of dispensing or the impact on swimming/showering.
Approximately one quarter of respondents exhibited preferences consistent with Class 3 (probability of membership 0.239). Preferences in this class were strongly driven by impact on swimming/showering; this class strongly preferred a 2 rather than 6 hrs wait before being able to swim/shower. None of the other characteristics were observed to drive choice in this class.
The form through which the gel treatment is provided (single multi-dose canister versus multiple sachets in a box) was not observed to be significantly associated with choice for any class (p>0.05).
Two socio-demographic characteristics significantly explained class membership (age and education; p<0.05); hence, these characteristics were included in the model (). Respondents with preferences consistent with Classes 1 and 2 were more likely to be older (≥65 years) than those in Class 3. Respondents with preferences consistent with Class 2 were less likely to be educated to degree/diploma or professional qualification level than those in Class 3. Employment did not significantly predict class membership.
Discussion
This study has investigated the preferences of adult males aged over 45 years in the UK for the formulation and administration of testosterone gel. This population group reflects those most likely to use testosterone gel for TRT; thus, their preferences are important to inform product design and likely market uptake. The findings suggest adult males in this age group prefer a testosterone treatment gel dispensed in small units allowing accurate dosage measurement, a shorter waiting time after the gel application before being able to shower or swim, and a smaller quantity gel application in the inner thigh/abdomen rather than larger quantity to the shoulder/abdomen. The packaging form of the gel (single multi-dose canister vs multiple sachets within a box) does not appear to be an important consideration for men.
However, whilst the overall direction of preference for these characteristics appears to be consistent across individuals, the strength of importance of these characteristics varies across the sample, with three distinct preference classes identified from the data. Perhaps most notably, being able to wait less time before swimming or showering after application of the gel is more likely to be a strong driver of formulation choice for younger men, all else being equal.
These results are in line with the literatureCitation10,Citation11 suggesting that process features such as ease of use and convenience play an important role in patient preference for TRT in addition to the alleviation of symptoms associated with low testosterone levels. Knowledge of individual patient preferences for TRT within the clinical consultation process should lead to better patient adherence to medication leading to an improved clinical response and ultimately to greater symptom control and patient health-related quality of life.Citation10
Limitations
The findings of this DCE assumes that the hypothetical choices respondents say they would make would actually be made in practice, were they to require a testosterone treatment. However, the DCE method allows an exploration of preferences round the delivery of products that are not necessarily available in the market place, which is one of its strengths.
The preferences elicited relate only to the attributes included in the study; there may be other testosterone treatment characteristics, eg, effectiveness or side effects, or comparisons such as cream and gel, time of day for application that may be relevant for some patients but were not included in the choice.Citation10 The attributes included in this study were based on the results of a literature reviewCitation12 and clinician interviews. Therefore, since the aim of the study was to investigate preferences around the administration and formulation a gel, these were assumed to be equal across the choices.
Conclusion
Men’s preferences for testosterone gel treatment are consistent in exhibiting a predilection for a treatment gel dispensed in small units with accurate dosing, a shorter waiting time after application before being able to swim or shower, and a smaller quantity of gel application to the inner thigh/abdomen. However, the strength of importance of these characteristics differs between men. This study extends what is known about the features influencing patient preferences of testosterone treatments.
Supplementary materials
Figure S1 Class 1 preferences for each attribute level. For each attribute, the columns represent the marginal preference for the identified attribute level (left column) over its alternative level (right column). Error bars represent the 95% confidence intervals ().
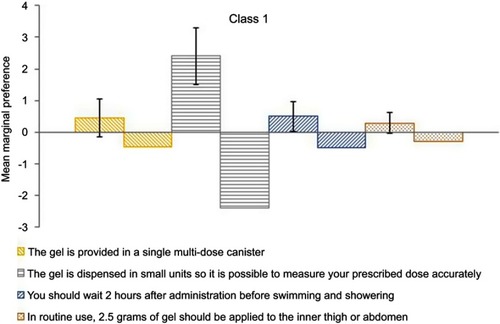
Figure S2 Class 2 preferences for each attribute level. For each attribute, the columns represent the marginal preference for the identified attribute level (left column) over its alternative level (right column). Error bars represent the 95% confidence intervals ().
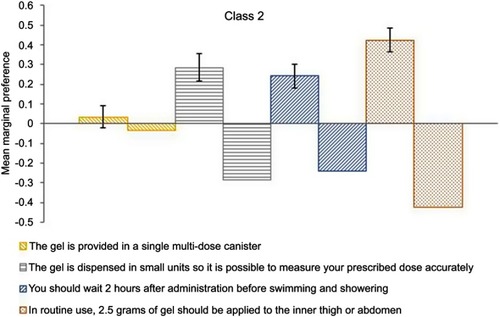
Figure S3 Class 3 preferences for each attribute level. For each attribute, the columns represent the marginal preference for the identified attribute level (left column) over its alternative level (right column). Error bars represent the 95% confidence intervals ().
Acknowledgments
This study was funded by Kyowa Kirin International (KKI) manufacturer of Tostran©. KKI was not involved in the drafting or review of this manuscript.
Disclosure
Dr Jenny Retzler reports grants from Kyowa Kirin, during the conduct of the study. Dr Adam B Smith reports grants from Kyowa Kirin International (KKI), during the conduct of the study. Ms Ana Sofia Oliveira Gonçalves reports grants during the conduct of the study. Professor Jennifer A Whitty reports grants from York Health Economics Consortium, during the conduct of the study. The authors report no other conflicts of interest in this work.
References
- Wang C, Nieschlag E, Swerdloff R, et al. Investigation, treatment, and monitoring of late-onset hypogonadism in males: ISA, ISSAM, EAU, EAA, and ASA recommendations. J Androl. 2009;30(1):1–9. doi:10.2164/jandrol.108.00648618772485
- Dohle GR, Arver S, Bettochi C, Kliesch S, Punab M, de Ronde W. Guidelines on male hypogonadism. Eur Assoc Urol. 2012;(4):1–28.
- Moncada I. Testosterone and men’s quality of life. Aging Male. 2006;9(4):189–193. doi:10.1080/1368553060100318017178553
- Wylie K, Rees M, Hackett G, et al. Anfrogens, health and sexuality in women and men. Human Fertility. 2010;13:277–297.
- Kang H-Y. Beyond the male sex hormone: deciphering the metabolic and vascular actions of testosterone. J Endocrinol. 2013;217(3):C1–C3. doi:10.1530/JOE-13-005223528478
- Laaksonen DE, Niskanen L, Punnonen K, et al. Sex hormones, inflammation and the metabolic syndrome: a population-based study. Eur J Endocrinol. 2003;149(6):601–608.14641004
- Pye SR, Huhtaniemi IT, Finn JD, et al. Late-onset hypogonadism and mortality in aging men. J Clin Endocrinol Metab. 2014;99(4):1357–1366. doi:10.1210/jc.2013-205224423283
- Cai X, Tian Y, Wu T, Cao C-X, Li H, Wang K-J. Metabolic effects of testosterone replacement therapy on hypogonadal men with type 2 diabetes mellitus: a systematic review and meta-analysis of randomized controlled trials. Asian J Androl. 2014;16(1):146–152. doi:10.4103/1008-682X.12234624369149
- Gould DC. A novel metered-dose 2% testosterone gel treatment for male hypogonadism. J Mens Health Gend. 2007;4(4):419–427. doi:10.1016/j.jmhg.2007.07.044
- Szeinbach SL, Seoane-Vazquez E, Summers KH. Development of a men’s Preference for Testosterone Replacement Therapy (P-TRT) instrument. Patient Prefer Adher. 2012;6:631–641. doi:10.2147/PPA.S35840
- Arver S, Stief C, de la Rosette J, Jones TH, Neijber D, Carrara D. A new 2% testosterone gel formulation: a comparison with currently available topical preparations. Andrology. 2018;6:396–407. doi:10.1111/andr.1248729600542
- Smith AB, Dickinson S, Arber M. P381: a pragmatic review of patient satisfaction and testosterone replacement therapy In: Society for Endocrinology BES 2015. Edinburgh: Endocrine Abstracts. 2015;37.
- Street DJ, Burgess L, Louviere JJ. Quick and easy choice sets: constructing optimal and nearly optimal stated choice experiments. Int J Res Mark. 2005;22(4):459–470. doi:10.1016/j.ijresmar.2005.09.003
- Greene WH, Hensher DA. A latent class model for discrete choice analysis: contrasts with mixed logit. Transport Res B Meth. 2003;37(8):681–698. doi:10.1016/S0191-2615(02)00046-2
- Whitty JA, Stewart S, Carrington MJ, et al. Patient preferences and willingness-to-pay for a home or clinic based program of chronic heart failure management: findings from the which? trial. PLoS One. 2013;8(3):e58347. doi:10.1371/journal.pone.005834723505491