
Abstract
Over the past two decades, functional magnetic resonance imaging (fMRI) has become the primary tool for exploring neural correlates of emotion. To enhance the reliability of results in understanding the complex nature of emotional experiences, researchers combine findings from multiple fMRI studies using coordinate-based meta-analysis (CBMA). As one of the most widely employed CBMA methods worldwide, activation likelihood estimation (ALE) is of great importance in affective neuroscience and neuropsychology. This comprehensive review provides an introductory guide for implementing the ALE method in emotion research, outlining the experimental steps involved. By presenting a case study about the emotion of disgust, with regard to both its core and social processing, we offer insightful commentary as to how ALE can enable researchers to produce consistent results and, consequently, fruitfully investigate the neural mechanisms underpinning emotions, facilitating further progress in this field.
Introduction
Understanding the functional dynamics of neuronal populations involved in emotional experiences is crucial for comprehending the complexity of emotions and their role in various mental phenomena, such as information processing, memory, and decision-making.Citation1 There are different methods capable of providing images of the activated areas of the brain by investigating the localization of neuronal structures involved in a given emotional phenomenon. The main human brain imaging techniques used for functional localization are functional magnetic resonance imaging (fMRI), positron emission tomography (PET), magnetoencephalography (MEG), electroencephalography (EEG), single photon emission computed tomography (SPECT), and functional near-infrared spectroscopy (fNIRS).Citation2–7
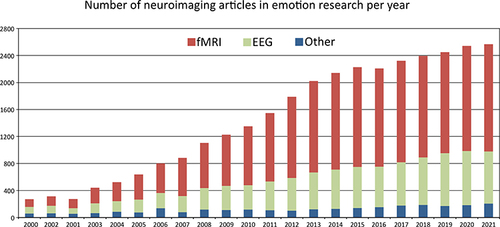
The past 20 years of neuroimaging research have yielded thousands of studies correlating brain regions with human emotions. A graphical overview can be found in . These studies have revealed the involvement of several brain structures in different emotional processes, including the anterior cingulate, anterior insula, amygdala, medial prefrontal cortex, occipital temporal cortex, and the orbitofrontal cortex.Citation8–10 One major area of inquiry has examined whether emotions arise from a discrete set of basic emotions (eg, happiness, sadness, anger, and fear) or if they emerge through combinations of fundamental dimensions like salience and valence.Citation11–15 Furthermore, neuroscientists have dedicated their efforts to studying the intricate relationship between emotions and various brain disorders. By meticulously examining the neurofunctional variations associated with emotional aspects in clinical populations, neuroscientists actively pursue valuable insights into how emotional states impact the brain, overall well-being, and the progression of various illnesses.Citation16–18
Figure 1 Number of published articles per year in PubMed search engine (https://pubmed.ncbi.nlm.nih.gov/) for neuroimaging techniques in the field of emotion research.
The field of affective neuroscience is currently witnessing a lively debate about the nature of emotions. On the one hand, some authors believe that emotions are constructed by means of interoceptive processes, cultural concepts, and the social context.Citation19 This view denies that there are brain circuits dedicated to specific emotions; it also rejects the idea that the so-called primary or basic emotions are genetically predetermined. On the other hand, other authors believe that emotions are embedded in behavioral patterns that are driven by “primary emotional systems”.Citation20 According to this perspective, seven primary emotional systems (Search, Fear, Anger, Care/Food, Sadness/Pain, Sexuality, and Play), which are genetically programmed, activate specific and basic emotional schemes. For instance, The Search system activates the emotions of pleasure and surprise. The Fear system activates the emotions of fear. The Anger system activates the emotion of anger. The Care/Food system activates the emotions of disgust, contempt or pleasure. The Sadness/Pain system activates the emotions of pain or sadness. The Sexuality system activates the emotion of pleasure for sexual arousal and enjoyment. The Play system activates the emotion of pleasure for imagination and, if the game is shared, the pleasure that comes from participating in a social activity. Each primary emotional system is associated with specific neural correlates and networks, which have important underpinnings in subcortical structures such as the brain stem.Citation21 As there are different ways to define emotions (eg, positive vs negative, primary and secondary, etc.), probably the best way to account for their multifarious aspects is to integrate complementary perspectives and methods of investigation. This introductory guide constitutes a further methodological tool that fits into the integrated framework for investigating the human affectome recently proposed by a large group of scientists.Citation22
In this work, the focus will be on fMRI, a technique that has provided a wealth of data, which has contributed to elucidating the brain areas activated by a given stimulus, during a task, or following an emotional experience. However, several aspects of fMRI (and neuroimaging methods in general) limit the validity as well as the generalization of individual studies. One well-known limitation is the frequently small number of subjects participating in experiments, with a mean sample size of 23 participants per study.Citation23 This limited sample size poses challenges in terms of statistical power and reproducibility of the fMRI findings.Citation24–26 Low statistical power refers to the decreased likelihood of detecting a true effect or relationship between variables when few data are available (as in the case of a small sample size). With a small number of participants, the ability to detect significant effects becomes diminished, potentially leading to false negatives or failing to identify genuine effects that may be present in the population of interest. Poor reproducibility, on the other hand, pertains to the consistency of obtaining the same or similar results when repeating an experiment using the same experimental procedures and conditions. If the results of an fMRI study cannot be reliably reproduced, it raises concerns about the robustness and generalizability of the findings.Citation25 Moreover, differences in experimental protocolsCitation27 and fMRI data processing pipelinesCitation28 additional sources of heterogeneity. Considering this intricate landscape, it becomes evident that relying solely on the activation of a brain area in a single neuroimaging experiment is insufficient to establish a reliable association between the observed phenomenon and its neural correlates.Citation26,Citation29
There is, therefore, the need to integrate results from different studies to ensure consistency of data. Meta-analyses provide a method to precisely achieve this goal, as they review relevant experiments in the literature and combine their data in a quantitative manner to obtain results that are more consistent than those of the original studies.Citation30 Thus, the use of meta-analysis, in principle, increases the statistical power and reproducibility of findings.Citation31,Citation32
In the fields of human brain mapping and affective neuroscience, coordinate-based meta-analysis (CBMA) plays a crucial role in integrating findings from neuroimaging experiments focused on emotional phenomena. By pooling together results from studies employing various tasks and cohorts worldwide but targeting the same research question, CBMA can provide a comprehensive understanding of specific emotional domains.Citation7,Citation33 Specifically, CBMA methodology enables the identification of brain areas that exhibit consistent activation across a range of fMRI tasks employed in emotion research. Unlike standard meta-analyses in other research domains that estimate effect sizes,Citation30 CBMA focuses on spatial reliability among multiple results.Citation34 This is due to the fact that, in neuroimaging studies, it is rare to have comprehensive three-dimensional (3D) maps of brain findings. Instead, researchers typically present their results as 3D points in study tables. These points, known as activation peaks or foci, represent the specific 3D locations in the brain where the highest level of activity was observed. The coordinates of these peaks are reported using a system called stereotactic coordinates (x, y, z foci), which provide a reference for the precise location of the brain activity. The goal of CBMA is to construct a map that represents the likelihood or probability of brain activation at different locations. This map is created by combining the activation peaks from multiple studies and estimating the probability of activation in each brain region. In simpler terms, CBMA is a way to piece together information from different studies and create a map of brain activity. This helps researchers understand which regions of the brain are consistently associated with certain tasks or conditions, even when full 3D maps are not available. Detailed methodological accounts can be found in Manuello et alCitation31 and in the following paragraphs.
Different methods have been developed in the last twenty years to perform fMRI meta-analyses starting from stereotactic coordinates of activation peaks.Citation35 The most common are the activation likelihood estimation (ALE),Citation36–38 the kernel density analysis (KDA) and multilevel KDA (MKDA),Citation27 and the seed-based d mapping (SDM).Citation39,Citation40 In this review, we consider the ALE method, and its implementation in the freely available software GingerALE,Citation36–38 developed and maintained by the Research Imaging Institute of the University of Texas – Health Science Center San Antonio (http://www.brainmap.org/). The ALE is particularly notable for providing a rigorous environment that automates the estimation of spatial-unbiased distribution maps across fMRI experiments, mitigating the laboratory and group-level inhomogeneity.Citation41 Simulation studies have demonstrated that ALE offers superior spatial accuracy in aligning results with canonical image-based neuroimaging results compared to other CBMA methods.Citation42 Moreover, the ALE algorithm has undergone continuous enhancements over the past two decades.Citation36,Citation43–47 These updates have contributed to its reliability and precision, cementing its role as an integral component of the Brainmap multi-platform resource,Citation48 which provides a set of neuroimaging software packages and supports a wide array of neuroinformatic operations.
In this context, our main goal is to present a clear and comprehensive overview of the CBMA approach and its application in the field of emotion research. In the following paragraph, we specifically focus on fMRI as the imaging technique of interest. Additionally, we aim to explain the underlying principles of CBMA, with a particular emphasis on the ALE method. In the last paragraph, we discuss the significance of CBMA in advancing our understanding of brain activations related to emotions. Here, we illustrate the main methodological steps involved in CBMA and, more broadly, demonstrate how the ALE technique can be utilized in emotion research. To provide a concrete example, we present a recently published case study that demonstrates the application of the ALE environment in the field of emotion research. By doing so, we aim to highlight the practicality and relevance of CBMA in enhancing our knowledge about the neural correlates of emotions.
Functional Magnetic Resonance Imaging Background
This section gives a very brief introduction to the steps involved in an fMRI experimental study, with a focus on emotion research. For a more detailed methodological account, please see LindquistCitation49 and Poldrack, Mumford, and Nichols.Citation50
At the basis of fMRI there is the fact that, because neurons have no cellular reserves of energy in the form of sugar or oxygen, energy needs to be provided to the brain areas characterized by high activity levels. The supply is operated through the circulation of fresh blood towards those brain regions, technically called hemodynamic response. Once the oxygenated blood reaches its target the oxygen is promptly used by neurons. The shift from well-oxygenated to deoxygenated blood causes a reconfiguration of red blood cells which can be detected by magnetic resonance machines (due to the presence of iron in the blood). In fact, the signal captured and processed in MRI analyses is called blood oxygenation level-dependent (BOLD), telling therefore how brain regions are consuming oxygen from blood due to neuronal activity.Citation51 The general idea in fMRI is therefore to engage participants in a task (ie, task-fMRI) that is designed to demand a cognitive ability to be solved. The brain regions that were seen to require more blood supply during the task execution are therefore supposed to support the cognitive ability under investigation. When this approach is applied in the field of affective neuroscience, participants are typically asked to perform a series of emotional tasks or are exposed to emotionally evocative stimuli, such as images, videos, or sounds, while the scanner measures the BOLD signal. The signal is acquired over time, so to obtain a temporal profile. In order to allow a fine-grain resolution of the activity profile, the brain is divided into millimeters wide voxels (ie, a 3D version of the pixels) and BOLD is measured for each of them. Therefore, at the end of the experimental session it is known, for each participant, how each single voxel of its brain reacted over time while the emotional stimuli were shown.
While an in-depth description of the necessary procedures to move from raw data to final results is out of scope here, a few concepts need to be mentioned. First, when more than one participant was tested, their data have to be mapped to a common space. This is known as spatial normalization, and allows to make the participants’ brains to be geometrically similar to a standard one (typically the Talairach atlasCitation52 or the Montreal Neurological Institute (MNI) atlas).Citation53 After this spatial normalization, one can assume that a given voxel represents (roughly) the same small portion of the brain across all subjects. At a second relevant step, it is necessary to distinguish between activity truly associated with the emotional task (or other stimulus of interest) and background noise, that is made of random activations unrelated with the fact that a stimulus was delivered to the subject. This is technically achieved by fitting a mathematical model (ie, a T-statistics) to the data of each voxel. The obtained numerical value tells us to what extent the activity of this given voxel is unlikely to be merely random or due to background noise, or in other words statistically significant. Due to biological constraints, these significant voxels usually appear grouped together to form clusters, rather than sparse across the brain. The peak of activity within each cluster, also known as a focus, is identified by determining the voxel with the highest level of activation. The location of each focus is reported using a system of x, y, z stereotactic coordinates.
Activation Likelihood Estimation
ALE is the CBMA method most employed worldwide,Citation54 as evidenced by over 1300 published articles in peer-reviewed journals (for the full list see also http://brainmap.org/pubs/). Its popularity is supported by the availability of GingerALE, a free and widely used software package implementation of the ALE algorithm.Citation48,Citation55–57 For a more comprehensive guide, please refer to the user manual available at https://brainmap.org/ale/manual.pdf.
The fundamental premise behind ALE is to account for the uncertainty associated with determining the precise location of brain activations. In any fMRI experimental measurement, there exists a certain degree of imprecision. ALE tackles this issue by computing a probability for each voxel in the brain, representing the likelihood that it contains the specific brain activation being investigated. This probability is modeled as a series of Gaussian distributions, each one centered around a focus (ie, the estimated coordinates of the peak of activation measured in a given fMRI experiment). Consequently, the probability decreases as the distance from the center of the distribution increases.Citation38 In other words, when an experiment reports a focus at coordinates x,y,z the Gaussian distribution is built to assign a value of 1 to that voxel. Then, to account for spatial uncertainty, the voxels close to the peak receive a value of slightly less than 1, until reaching a probability of 0 when voxels are far enough from the peak to unlikely represent the real location of the maximum activation. This is repeated for each focus reported in one of the selected fMRI experiments, generating a so-called modeled activation (MA) map for each of them.Citation56 To obtain the final ALE map, the MA maps from all experiments are combined. The resulting ALE map provides information about the probability of finding brain activation in each voxel, offering insights into the areas of the brain more likely to be associated with the phenomenon under investigation. For a more detailed statistical description, see Supplementary Materials.
At the time ALE was developed, the final maps were used as is without further thresholding. However, it should be considered that this technique tests all the voxels in the brain simultaneously, giving rise to an issue of multiple comparisons. To mitigate this, therefore avoiding to increase the likelihood of false-positive findings,Citation45 several thresholding methods have been devised. The current standard is to adopt family-wise error (FWE) correction. Conceptually, this allows to test the values obtained in the ALE maps against what would be observed if foci were randomly distributed across the brain, rather than reflecting the peaks of activation obtained across the various experiments analyzed.Citation29 A further level of control can be added by imposing that the clusters in the final ALE map must be wider than the widest cluster obtained from, again, a random distribution of the foci across the brainCitation39 (for a more advanced description of thresholding procedures see Costa et al).Citation44 These correction methods enhance the reliability of results by reducing the risk of false-positive findings and improving the validity of identified consistent brain activation patterns.
Application of the Method in Emotion Research
ALE was originally introduced more than two decades agoCitation38 and has since become a valuable method in affective neuroscience for quantitatively analyzing neuroimaging data and uncovering consistent patterns of brain activity associated with emotional processes. Over the years, several influential studies have employed ALE to investigate various aspects of emotion processing.
To the best of our knowledge, the first ALE study in the field of affective neuroscience was conducted by Fusar-Poli et al,Citation58 who investigated the most consistent neural correlates of emotional facial processing. Their findings unveiled consistent activations in several brain regions, including visual, limbic, temporoparietal, and prefrontal areas, as well as the putamen and the cerebellum. These results highlighted the involvement of a network of regions spanning both sensory and higher-order cognitive processing in the perception and interpretation of emotional facial expressions. In a different line of research, Vytal & HamannCitation59 conducted an extensive ALE meta-analysis to investigate the neural representation of basic emotions. The authors aimed to determine whether emotions such as fear, anger, disgust, sadness, and happiness are associated with consistent and distinguishable brain activations. The ALE method revealed compelling results. Each emotion demonstrated consistent neural correlates across studies, indicating reliable associations with specific brain regions. Furthermore, the activation patterns associated with each emotion were distinct, allowing for discrimination between them. These findings support the existence of consistent and discernible neural correlates linked to discrete basic emotions. Additionally, Li et alCitation54 conducted an ALE meta-analysis to investigate brain activation during facial emotion processing in patients with schizophrenia compared to healthy controls. The study aimed to address inconsistencies in previous findings regarding regional brain activation abnormalities in schizophrenia patients during emotion perception. The results indicated that both patients with schizophrenia and controls activated the bilateral amygdala and right fusiform gyri during facial emotion processing. However, the extent of activation in these regions was generally more limited in the schizophrenia samples. When directly compared to controls, patients with schizophrenia exhibited significantly less activation in the bilateral amygdala, parahippocampal gyrus, fusiform gyrus, right superior frontal gyrus, and lentiform nucleus. Notably, patients with schizophrenia showed under recruitment of the amygdala regardless of task design (explicit or implicit emotion elicitation), while differences in fusiform activation were observed primarily in explicit tasks. The findings suggest that a marked under recruitment of the amygdala, accompanied by limited activation throughout a social brain network (ie, ventral temporal-basal ganglia-prefrontal cortex), may contribute to the difficulties experienced by patients with schizophrenia in processing facial emotion. ALE was also used to investigate neural correlates of the processing of subliminal arousing stimuli through different modalities of presentation.Citation60 The results, showing the involvement of a distributed pattern encompassing the amygdala and the hippocampus, together with the salience network, elucidate the relationship between arousal and emotion.
These influential ALE studies collectively contribute to our understanding of the neural underpinnings of emotional processes. However, it is important to note that the studies mentioned here represent only a fraction of the extensive literature in this field. For a comprehensive list of emotion-related ALE studies, we recommend referring to the full compilation available at http://brainmap.org/pubs/. This resource provides a broader scope of research findings and further insights into the neural mechanisms underlying emotions.
Case Study: Do Consistent Brain Activations Occur in Disgust Processing?
In this section, we present an ALE coordinate-based meta-analysis as a proof of concept. Specifically, we selected the recent work of Gan et alCitation61 as a case study, who conducted an ALE meta-analysis on healthy human participants in order to i) identify spatially consistent patterns of neuronal activation engaged in general disgust processing, and ii) determine common and divergent patterns involved in core and social disgust processing. It is important to note that our intention here is not to replicate or extend their analysis but rather to showcase the main methodological design of the ALE environment in emotion research.
Disgust is considered a basic human emotion and a complex and evolutionary system of disease-avoidance mechanisms.Citation62 It is thought to have evolved to protect individuals from potentially contaminated substances and infectionsCitation63 through avoidant defensive behaviors (ie, core disgust).Citation64 On the other hand, with the advent of human society, the disgust response has also been crucial for the survival of conspecifics and successful socio-communicative relations (ie, social disgust).Citation64 Starting from the pioneering work of Phillips et al,Citation65 a wide amount of fMRI studies have investigated the neurofunctional substrate involved in disgust processing. Nonetheless, the precise localization of brain areas associated with this type of emotion remains a subject of debate. Additionally, the potential convergence and differences between core and social disgust processing remain largely unappreciated. These unresolved issues may be partially ascribed to the inherent limitations of single fMRI experiments, namely their methodological (eg, sample size, MRI field strength, acquisition protocol, task design, processing pipeline, etc.) and socio-demographic (eg, developmental stage of participants, cultural background, disgust propensity, etc.) factors.
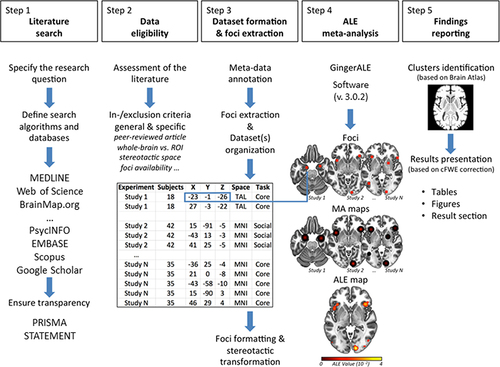
Is there a convergent functional pattern that underlies disgust processing in the human brain? If so, which cortical, subcortical, and cerebellar regions are consistently recruited during core and/or social disgust processing? Gan et alCitation61 addressed these questions by conducting an ALE coordinate-based meta-analysis of published fMRI articles on this topic. provides a graphical overview of the primary methodological steps generally applicable to the ALE method, as well as those employed by the authors themselves.
Figure 2 Workflow stages of the activation likelihood estimation (ALE) method.
Step 1: Literature Search
Using multiple combinations of appropriate keywords, the authors queried scientific databases (ie, MEDLINE, Web of Science) in search of eligible studies in peer-reviewed journals. This is the first critical point designed to ensure high sensitivity with respect to the research question. However, achieving precise yet extensive retrieval in biomedical and psychological systematic searches poses challenges due to the vast size of these databases, which now encompass approximately 33.8 million records.Citation66 Moreover, additional databases including PsycINFO, EMBASE, and Google Scholar may also be consulted, potentially increasing the total number of records to scrutinize. In this scenario, the application of search filters, Medical Subject Headings (MeSH) keywords, and advanced search strategies has proven effective in increasing the relevance and reducing the volume of records retrieved, without compromising the inclusion of potentially eligible articles.Citation67 It is important to note, however, that these strategies lack standardized rules due to the diverse research questions covered by CBMAs and depend heavily on expert-driven, meticulous searches of well-annotated literature. Therefore, it is considered good practice for different authors of the meta-analysis to conduct independent searches and subsequently evaluate the consistency of the results.Citation31
The authors also queried the BrainMap database via Sleuth (https://www.brainmap.org/sleuth/),Citation48,Citation55,Citation56 a user-friendly software application capable of building standardized search algorithms and extracting in an automated manner meta-data of interest, including foci of the fMRI experiments in the stereotactic space adopted for the ALE analysis (details given in step 2). Although BrainMap contains approximately 20% of the current peer-reviewed neuroimaging literature,Citation68 we believe that its use in conjunction with the aforementioned databases generally represents a valuable choice for researchers. One of its key advantages is that it eliminates the need for researchers to individually inspect and analyze each selected fMRI study, which can be a time-consuming and error-prone process. By using BrainMap, researchers can avoid potential human errors in reporting foci, sample sizes, and the nature of the analysis conducted in each fMRI study. In essence, it provides a standardized and efficient approach to accessing and utilizing a wide range of fMRI data. For comprehensive guidelines on ensuring the traceability and replicability of meta-data in the field of CBMA, consult Manuello et alCitation31 and Müller et al.Citation32 These resources provide valuable insights into best practices for researchers in this field.
Finally, the authors manually checked the reference lists of the included studies to identify other eligible articles that could have been missed during the database searches. This constitutes another good practice because the meta-analytic approach should take into account, at least in theory, the entire current literature that is pertinent to the research hypothesis under consideration.
Step 2: Data Eligibility
After the identification of all potential data, the assessment of the identified literature starts. This procedure is essential for the systematic selection of experiments to be included in the final CBMA dataset. It also ensures the exclusion of neuroimaging data that fails to meet the a priori inclusion/exclusion criteria established by the authors. At this stage, it is considered best practice for two authors to independently evaluate the entire corpus of identified literature.Citation69 Additionally, it is typical for any disagreements between authors to be resolved through consensus, under the guidance of a third author.Citation70
Usually, the first action consists of excluding, after a title- or abstract-level evaluation, non-original studies (ie review, systematic review, meta-analysis, letter to the editor, case report, etc.) and animal model studies. Of note, many authors discard articles published in non-English language journals to ensure easier replicability of the dataset worldwide.Citation54 Next, the full texts of the remaining articles should be downloaded for an in-depth evaluation. What inclusion or exclusion criteria should be taken into account? Inevitably, specific criteria depend on the particular research question and literature background. Beyond the affective domain or type of emotional task to select, specific criteria can relate to the imaging methodology (eg, fMRI studies only or PET, SPECT, and fMRI studies) or to the characteristics of the experimental group (eg, healthy or clinical subjects; only a specific age rage/sex of subjects). For example, Gan et alCitation61 focused their analysis specifically on fMRI-based experiments involving healthy participants to study disgust processing. Their analysis exclusively incorporated data from visual stimuli to meticulously control for sensory modality, thus enabling effective comparisons between core disgust and social disgust. Moreover, in the case of multiple fMRI experiments from the same group of subjects within the study, the authors considered eligible only the most representative in the process of interest. This decision was motivated by an important methodological consideration. The ALE algorithm treats each fMRI experiment as an independent record,Citation71 meaning that data from the same participants may introduce a potential dependence that could compromise the validity of the final ALE results.Citation32
In addition to specific criteria related to aspects of the topic, the design of the ALE method (and of CBMA in general) imposes that eligible experiments adhere to two specific requirements:
The findings reported in each fMRI experiment must be derived from imaging analyses that have covered the entire brain (ie, whole-brain analysis), rather than from small volume correction (SVC) or region-of-interest (ROI) analyses. ALE tests spatial convergence across experiments against a null hypothesis of random spatial associations across the whole brain, thus assuming that each brain voxel has the same chance of being activated.Citation36,Citation45 Therefore, the inclusion of SVC and ROI findings violates this assumption and could lead to biased results for specific brain regions.Citation31,Citation32
The findings reported in each fMRI experiment must be in a stereotactic brain space (ie, Talairach or MNI) and accompanied by the peaks (foci) of significant effect observed. Although neuroimaging findings are usually normalized in a standard common space in order to evaluate the effects across the subjects’ group, it is important to note that coordinates in MNI space differ from those in Talairach.Citation72 Thus, to reduce the spatial disparity between neuroimaging findings reported as MNI or Talairach coordinates, it is useful and recommended to convert data reported in MNI to Talairach space, or vice versa. This can be easily achieved through the transformation algorithm available in the GingerALE interface.Citation73 Moreover, assuming that whole-brain coverage and stereotactic space in an experiment have been verified, findings are still useless in the absence of the list of foci. Foci are frequently listed in a table in the Results section; alternatively, they can be obtained from the in particular when the corresponding analysis was not the principal aim of the study. When just a few foci are reported, the authors usually incorporate them into the main text.
Step 3: Dataset(s) Formation and Foci Extraction
Once the studies (and their fMRI experiments included) have been selected, the meta-data of interest should be extracted and organized into a.txt file format. Essential information, such as significant foci of activation and the number of subjects per fMRI experiment, is mandatory for conducting an ALE meta-analysis. It is crucial that the.txt file strictly adheres to the following input layout specifications to prevent the GingerALE application from treating the included experiments as missing data:
Begin each line containing meta-data must begin with “//”.
The final line of meta-data for each included experiment must specify the number of subjects, using the format “Subjects=xx”.
List x, y, z coordinates for each focus on separate lines, using a space to separate values and a period as the decimal separator, if necessary.
Include an empty line between the last focus of one experiment and the meta-data of the next.
For practical support to the ALE dataset formation see also https://github.com/Jordi-Manuello/CBMAT.Citation74
It is also worth noting that the collection of other methodological and socio-demographic variables may be of interest as well. Type of emotional imaging/task/stimulus/contrast modality, presence/absence of multiple comparison correction of findings, analytic software employed, magnetic field strength, spatial smoothing of the data, male-female ratio, intelligence quotient, and developmental stage of the participants are other optional meta-data that may be useful to perform sub-analyses of interest.
Again, the organization and reporting of the dataset should be transparent and detailed. The reader should be able to easily trace the original studies included and understand “how” the database is composed and/or sub-grouped. This may be achieved through the authors’ presentation of tables in the manuscript or Supplementary Materials.
Step 4: Activation Likelihood Estimation Meta-Analysis
At this stage, the GingerALE application can be used to perform statistical analyses.Citation48,Citation55,Citation56 To assess the correct interpretation of the data, GingerALE requires only the foci.txt file (details on its format can be seen at http://www.brainmap.org/ale/manual.pdf). When the file has been uploaded, the number of stereotactic coordinates and the number of studies detected in the input are shown.
Regardless of the specific algorithm used for thresholding, GingerALE employs statistical analysis on the regions that surpass the chosen threshold. As mentioned earlier, just like individual neuroimaging studies, the ALE method requires correction for multiple comparisons. Uncorrected thresholding may offer higher sensitivity but also increases the risk of false positives. In neuroimaging CBMA, various methods are available for correcting multiple comparisons, but it is recommended to strike a balance between sensitivity and susceptibility to false positives.Citation32 In line with recent recommendations from the BrainMap team,Citation45,Citation46 ALE results generally undergo family-wise error correction (FWE-c) for multiple comparisons. This correction involves a cluster-level inference with a significance threshold of p < 0.05 and a cluster-forming threshold of p < 0.001 at the voxel-level. By adhering to these guidelines, researchers can ensure more reliable and robust findings in their ALE analyses.
In their study, Gan et alCitation61 capitalized on a substantial body of literature to conduct a comprehensive ALE analysis on general disgust processing. This analysis included 71 fMRI experiments, comprising a total of 717 foci of activation and involving 1409 participants. The main ALE meta-analysis, which encompassed all the fMRI peer-reviewed experiments on disgust processing, revealed twelve consistent neuronal clusters of activation. These clusters were located in various brain regions, including the bilateral insula, amygdala, fusiform gyrus, middle occipital gyrus, right inferior occipital gyrus, right lingual gyrus, left inferior temporal gyrus, right inferior frontal gyrus, and left superior frontal gyrus. To visually illustrate these significant findings, refer to the upper panel of . Interestingly, the authors discussed their findings in light of the multifaceted nature of the disgust response. The areas identified in the study may collectively support various simultaneous processes that contribute to a coordinated disgust reaction. These processes encompass different stages, including the initial detection of biologically salient stimuli in occipital visual regions, the early detection of threats, and the execution of defensive motor responses involving the amygdala and fusiform regions. Additionally, the identified regions are implicated in salience allocation and interoceptive awareness of the emotional state in the insula cortex, as well as the subjective experience and interpretation of the emotional state in prefrontal regions.
Figure 3 Brain clusters of spatially convergent patterns of activation in the general disgust processing dataset (main ALE analysis of Gan et al (2022);Citation61 top panel), core disgust processing dataset (subanalysis 1 of Gan et al (2022); bottom left panel), and social disgust processing dataset (subanalysis 2 of Gan et al (2022); bottom right panel). Results were FWE-corrected at 0.05 with cluster-forming value at p <.001 by Gan et al (2022) via GingerALE (v. 3.0.2.; http://www.brainmap.org/ale/). The activation likelihood activation (ALE) maps are visualized as axial slices (2-D cortical and subcortical view). Brain templates are in neurological convention (ie, R is right, L is left).
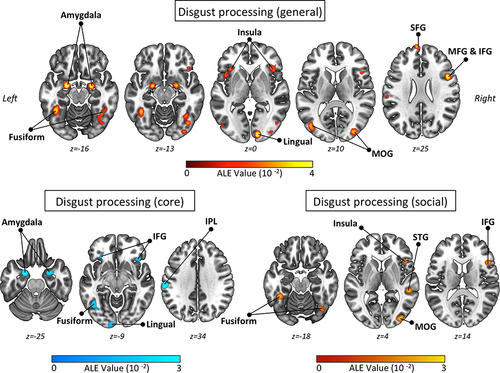
In contrast, the lower panel of illustrates the specific findings related to core disgust processing and social disgust processing sub-analyses. The authors identified ten clusters demonstrating robust activation for the core disgust sub-dataset, based on a subset of 41 experiments involving 402 foci and 897 participants. These clusters primarily encompassed the bilateral amygdala (with extension into the right globus pallidus) and inferior frontal gyrus, as well as the left fusiform gyrus, left inferior parietal lobule, and left inferior occipital gyrus extending into the adjacent lingual gyrus. As elegantly noted by the authors, this pattern of brain areas may reflect the activation of evolutionary defensive-avoidance circuits when individuals are directly exposed to potentially infectious and harmful stimuli. In fact, it is well-known that these areas are involved in the early detection of salient threats and initiate the physiological and behavioral defensive responses, facilitating rapid withdrawal from potentially dangerous situations.
Regarding social disgust processing involving a subset of 30 experiments, 315 foci, and 512 participants, the analysis revealed six significant clusters of robust activation. These clusters were located in the right insula and adjacent inferior frontal gyrus, bilateral fusiform gyrus, left superior temporal gyrus, and right middle occipital gyrus. Most of these identified regions have previously been linked to emotional face processing, encompassing both early face-processing stages and higher-level face perception processing. Additionally, other areas, such as the superior temporal regions, have been prominently associated with social cognitive processes, including theory of mind and mentalizing. Interestingly, the authors’ report highlights a distinct finding regarding social disgust processing. In contrast to several previous original fMRI studies, their ALE meta-analysis focusing on the social aspect did not demonstrate robust engagement of the amygdala. This deviation from prior findings adds to the evolving understanding of the neural mechanisms underlying social disgust processing.
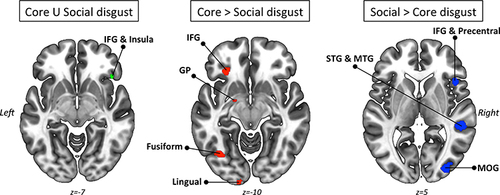
An additional feature of GingerALE is its capability to conduct contrast analysis, enabling statistical comparisons between different datasets to identify common and divergent ALE patterns. To illustrate this feature, we can consider the contrast analysis performed by Gan et al.Citation61 In their study, the authors compared and contrasted the previously generated ALE findings of core disgust processing and social disgust processing. This analysis allowed for a systematic examination of the overlapping and distinct brain activation patterns associated with these two facets of disgust processing. The authors revealed robust activation of the right inferior frontal gyrus (extending into the anterior insula) during both core and social disgust processing. They also observed stronger recruitment of left hemisphere regions (ie, the left inferior frontal gyrus, globus pallidus, fusiform gyrus, and lingual gyrus) specifically in core disgust compared to social disgust. Conversely, a right hemispheric predominance was found for social disgust compared to core disgust, involving the right inferior frontal gyrus, precentral gyrus, superior temporal gyrus, and middle occipital gyrus. A graphical overview can be found in . Interestingly, while the authors did not have specific a priori hypotheses about lateralization, their findings align with previous research indicating a left lateralization of withdrawal-related activity and a right lateralized network involved in conscious emotional perception. However, the discovery of a left-lateralized withdrawal network in this study is a novel finding that challenges prevailing neuronal models of approach/avoidance.
Figure 4 Conjunction and contrast analyses between core and social disgust processing datasets as performed by Gan et al.Citation61 Left panel: Convergence of activation between core and social disgust processing datasets (green color represents ALE values). Central panel: Compared to the social disgust dataset, activations are exclusively present in the core disgust dataset (red color represents ALE values). Right panel: Compared to the core disgust dataset, activations are exclusively present in the social disgust dataset (blue color represents ALE values).
Step 5: Reporting of the Findings
In the final step of the analysis, the ALE computation outputs are generated by the GingerALE software package. The anatomical labels of the Talairach Daemon (http://www.talairach.org)Citation75 are assigned to the peaks of each cluster in the results map. It is important to clarify that in the ALE analysis, the labeling process for assigning anatomical labels to the peaks of each cluster is automated and data-driven rather than manually performed by the researchers. Additionally, a table is generated, providing various details about the identified clusters, such as their x, y, z coordinates, the number of significant voxels, the corresponding brain area names, and x, y, z statistical information regarding cluster formation. For a more comprehensive description, please refer to the user manual available at https://brainmap.org/ale/manual.pdf.
The GingerALE software saves the output maps in the NIfTI format (http://nifti.nimh.nih.gov), which can be easily read by various functional neuroimaging software packages. Additionally, the resultant ALE maps can be disseminated to the broader research community by uploading them to online neuroimaging repositories, such as the Archive of Neuroimaging Meta-analyses (ANIMA).Citation76 This dissemination is advantageous as it allows these maps to serve as reliable prior data for designing subsequent task-based fMRI studies. Furthermore, they can be employed as ROI in studies exploring functional connectivity or in various seed-based analyses,Citation77 including connectomics.Citation78,Citation79 This enhances the utility of ALE maps in advancing neuroimaging research by facilitating shared resources and collaborative scientific inquiry.
Concluding Remarks
In conclusion, the ALE method has emerged as a crucial tool in emotion research and affective neuroscience, providing a powerful and quantitative approach to investigating the neural correlates of emotions. By integrating data from multiple neuroimaging studies, ALE provides a comprehensive understanding of the consistent patterns of brain activity associated with emotional processes under investigation. This method has allowed researchers to overcome the limitations of individual fMRI studies, such as small sample sizes and heterogeneity in experimental protocols, thereby enhancing the reliability and generalizability of findings. ALE has been instrumental in uncovering reliable neural activations related to emotional facial processing, basic emotions, and differences in emotion processing across healthy and clinical populations, just to name a few. It has significantly contributed to our understanding of the neural underpinnings of emotions, highlighting the specific brain regions involved and shedding light on the complex interplay between emotions and cognition. Moving forward, the continued application and advancement of the ALE methodCitation43,Citation44 in emotion research promise to further deepen our understanding of the intricate mechanisms underlying human emotions.
Author Contributions
TC: Conceptualization, Methodology, Supervision, Writing – original draft, Writing – review and editing. MF: Conceptualization, Methodology, Supervision, Writing – original draft. JM: Methodology, Writing – review and editing. AC: Writing – review and editing. AN: Writing – review and editing. LM: Writing – review and editing. FC: Supervision, Writing – review and editing. PTF: Supervision, Writing – review and editing. DL: Conceptualization, Investigation, Supervision, Methodology, Visualization, Writing – original draft, Writing – review and editing. All authors made a significant contribution to the work reported, whether that is in the conception, study design, execution, acquisition of data, analysis and interpretation, or in all these areas; took part in drafting, revising or critically reviewing the article; gave final approval of the version to be published; have agreed on the journal to which the article has been submitted; and agree to be accountable for all aspects of the work.
Disclosure
The authors report no financial interests or potential conflicts of interest in this work. Dr. Donato Liloia, PhD is an Associate Editorial Board Member of this journal but was not involved in the peer-review process nor had access to any information regarding its peer-review.
Acknowledgments
The authors would like to thank Dr. Xianyang Gan, Dr. Benjamin Klugah-Brown, and Prof. Benjamin Becker for sharing their ALE maps used as case studies in this article. We extend our deepest appreciation to Annachiara Crocetta, Camilla Chiavassa, and Mattia Corsi for their invaluable comments and suggestions.
Additional information
Funding
References
- Deak A. Brain and emotion: cognitive neuroscience of emotions. Rev Psychol. 2011;18(2):71–80.
- Brooke AH, Harrison NA. Chapter 30 - neuroimaging and emotion. In: Fink G editor. Stress: Concepts, Cognition, Emotion, and Behavior. Academic Press; 2016:251–259. doi:10.1016/B978-0-12-800951-2.00030-3
- Davis KM, Ryan JL, Aaron VD, Sims JB. PET and SPECT imaging of the brain: history, technical considerations, applications, and radiotracers. Semin Ultrasound CT MR. 2020;41(6):521–529. doi:10.1053/j.sult.2020.08.006
- Hu X, Zhuang C, Wang F, Liu YJ, Im CH, Zhang D. fNIRS evidence for recognizably different positive emotions. Front Hum Neurosci. 2019;13:120. doi:10.3389/fnhum.2019.00120
- Junghöfer M, Peyk P, Flaisch T, Schupp HT. Neuroimaging methods in affective neuroscience: selected methodological issues. Prog Brain Res. 2006;156:123–143. doi:10.1016/S0079-6123(06)56007-8
- Kragel PA, LaBar KS. Decoding the nature of emotion in the brain. Trends Cognit Sci. 2016;20(6):444–455. doi:10.1016/j.tics.2016.03.011
- Phan KL, Wager T, Taylor SF, Liberzon I. Functional neuroanatomy of emotion: a meta-analysis of emotion activation studies in PET and fMRI. Neuroimage. 2002;16(2):331–348. doi:10.1006/nimg.2002.1087
- Barrett LF, Wager TD. The structure of emotion: evidence from neuroimaging studies. Curr Dir Psychol Sci. 2006;15(2):79–83. doi:10.1111/j.0963-7214.2006.00411.x
- Lindquist KA, Wager TD, Kober H, Bliss-Moreau E, Barrett LF. The brain basis of emotion: a meta-analytic review. Behav Brain Sci. 2012;35(3):121. doi:10.1017/S0140525X11000446
- Posner J, Russell JA, Gerber A, et al. The neurophysiological bases of emotion: an fMRI study of the affective circumplex using emotion-denoting words. Hum Brain Mapp. 2009;30(3):883–895. doi:10.1002/hbm.20553
- Barrett LF, Mesquita B, Ochsner KN, Gross JJ. The experience of emotion. Annu Rev Psychol. 2007;58:373–403. doi:10.1146/annurev.psych.58.110405.085709
- Ekman P. An argument for basic emotions. Cognition Emotion. 1992;6(3–4):169–200. doi:10.1080/02699939208411068
- Gu S, Wang F, Cao C, Wu E, Tang YY, Huang JH. An integrative way for studying neural basis of basic emotions with fMRI. Front Neurosci. 2019;13:628. doi:10.3389/fnins.2019.00628
- Hamann S. Mapping discrete and dimensional emotions onto the brain: controversies and consensus. Trends Cognit Sci. 2012;16(9):458–466. doi:10.1016/j.tics.2012.07.006
- Russell JA. Core affect and the psychological construction of emotion. Psychol Rev. 2003;110(1):145–172. doi:10.1037/0033-295x.110.1.145
- Ebneabbasi A, Mahdipour M, Nejati V, et al. Emotion processing and regulation in major depressive disorder: a 7T resting-state fMRI study. Hum Brain Mapp. 2021;42(3):797–810. doi:10.1002/hbm.25263
- McKechanie AG, Lawrie SM, Whalley HC, Stanfield AC. A functional MRI facial emotion-processing study of autism in individuals with special educational needs. Psychiatry Res Neuroimaging. 2022;320:111426. doi:10.1016/j.pscychresns.2021.111426
- van Zutphen L, Siep N, Jacob GA, Goebel R, Arntz A. Emotional sensitivity, emotion regulation and impulsivity in borderline personality disorder: a critical review of fMRI studies. Neurosci Biobehav Rev. 2015;51:64–76. doi:10.1016/j.neubiorev.2015.01.001
- Barrett LF. The theory of constructed emotion: an active inference account of interoception and categorization. Soc Cogn Affect Neurosci. 2017;12(1):1–23. doi:10.1093/scan/nsw154
- Panksepp J. Affective Neuroscience: The Foundations of Human and Animal Emotions. Oxford University Press; 2004.
- Solms M. The Hidden Spring: A Journey to the Source of Consciousness. Profile Books; 2021.
- Schiller D, Yu ANC, Alia-Klein N, et al. The Human Affectome. Neurosci Biobehav Rev. 2024;158:105450. doi:10.1016/j.neubiorev.2023.105450
- Szucs D, Ioannidis JP. Sample size evolution in neuroimaging research: an evaluation of highly-cited studies (1990–2012) and of latest practices (2017–2018) in high-impact journals. Neuroimage. 2020;221:117164. doi:10.1016/j.neuroimage.2020.117164
- Carp J. The secret lives of experiments: methods reporting in the fMRI literature. Neuroimage. 2012;63(1):289–300. doi:10.1016/j.neuroimage.2012.07.004
- Cremers HR, Wager TD, Yarkoni T. The relation between statistical power and inference in fMRI. PLoS One. 2017;12(11):e0184923. doi:10.1371/journal.pone.0184923
- Samartsidis P, Montagna S, Nichols TE, Johnson TD. The coordinate-based meta-analysis of neuroimaging data. Stat Sci. 2017;32(4):580–599. doi:10.1214/17-STS624
- Wager TD, Lindquist M, Kaplan L. Meta-analysis of functional neuroimaging data: current and future directions. Soc Cogn Affect Neurosci. 2007;2(2):150–158. doi:10.1093/scan/nsm015
- Bowring A, Maumet C, Nichols TE. Exploring the impact of analysis software on task fMRI results. Hum Brain Mapp. 2019;40(11):3362–3384. doi:10.1002/hbm.24603
- Nani A, Manuello J, Liloia D, Duca S, Costa T, Cauda F. The neural correlates of time: a meta-analysis of neuroimaging studies. J Cogn Neurosci. 2019;31(12):1796–1826. doi:10.1162/jocn_a_01459
- Smith ML, Glass GV. Meta-analysis of research on class size and its relationship to attitudes and instruction. Am Educ Res J. 1980;17(4):419–433. doi:10.3102/00028312017004419
- Manuello J, Costa T, Cauda F, Liloia D. Six actions to improve detection of critical features for neuroimaging coordinate-based meta-analysis preparation. Neurosci Biobehav Rev. 2022;137:104659. doi:10.1016/j.neubiorev.2022.104659
- Müller VI, Cieslik EC, Laird AR, et al. Ten simple rules for neuroimaging meta-analysis. Neurosci Biobehav Rev. 2018;84:151–161. doi:10.1016/j.neubiorev.2017.11.012
- Morawetz C, Bode S, Derntl B, Heekeren HR. The effect of strategies, goals and stimulus material on the neural mechanisms of emotion regulation: a meta-analysis of fMRI studies. Neurosci Biobehav Rev. 2017;72:111–128. doi:10.1016/j.neubiorev.2016.11.014
- Caspers J, Zilles K, Beierle C, Rottschy C, Eickhoff SB. A novel meta-analytic approach: mining frequent co-activation patterns in neuroimaging databases. Neuroimage. 2014;90:390–402. doi:10.1016/j.neuroimage.2013.12.024
- Evans AC, Collins DL, Mills SR, Brown ED, Kelly RL, Peters TM 3D statistical neuroanatomical models from 305 MRI volumes. In: 1993 IEEE Conference Record Nuclear Science Symposium and Medical Imaging Conference. 1993:1813–1817. doi:10.1109/NSSMIC.1993.373602.
- Eickhoff SB, Bzdok D, Laird AR, Kurth F, Fox PT. Activation likelihood estimation meta-analysis revisited. Neuroimage. 2012;59(3):2349–2361. doi:10.1016/j.neuroimage.2011.09.017
- Eickhoff SB, Laird AR, Grefkes C, Wang LE, Zilles K, Fox PT. Coordinate-based activation likelihood estimation meta-analysis of neuroimaging data: a random-effects approach based on empirical estimates of spatial uncertainty. Hum Brain Mapp. 2009;30(9):2907–2926. doi:10.1002/hbm.20718
- Turkeltaub PE, Eden GF, Jones KM, Zeffiro TA. Meta-analysis of the functional neuroanatomy of single-word reading: method and validation. Neuroimage. 2002;16(3 Pt 1):765–780. doi:10.1006/nimg.2002.1131
- Albajes-Eizagirre A, Solanes A, Vieta E, Radua J. Voxel-based meta-analysis via permutation of subject images (PSI): theory and implementation for SDM. Neuroimage. 2019;186:174–184. doi:10.1016/j.neuroimage.2018.10.077
- Radua J, Rubia K, Canales-Rodríguez EJ, Pomarol-Clotet E, Fusar-Poli P, Mataix-Cols D. Anisotropic kernels for coordinate-based meta-analyses of neuroimaging studies. Front Psychiatry. 2014;5:13. doi:10.3389/fpsyt.2014.00013
- Fox PT, Lancaster JL, Laird AR, Eickhoff SB. Meta-analysis in human neuroimaging: computational modeling of large-scale databases. Annu Rev Neurosci. 2014;37:409–434. doi:10.1146/annurev-neuro-062012-170320
- Salimi-Khorshidi G, Smith SM, Keltner JR, Wager TD, Nichols TE. Meta-analysis of neuroimaging data: a comparison of image-based and coordinate-based pooling of studies. Neuroimage. 2009;45(3):810–823. doi:10.1016/j.neuroimage.2008.12.039
- Costa T, Manuello J, Ferraro M, et al. BACON: a tool for reverse inference in brain activation and alteration. Hum Brain Mapp. 2021;42(11):3343–3351. doi:10.1002/hbm.25452
- Costa T, Liloia D, Cauda F, et al. A minimum Bayes Factor based threshold for activation likelihood estimation. Neuroinform. 2023;21(2):365–374. doi:10.1007/s12021-023-09626-6
- Eickhoff SB, Nichols TE, Laird AR, et al. Behavior, Sensitivity, and power of activation likelihood estimation characterized by massive empirical simulation. Neuroimage. 2016;137:70–85. doi:10.1016/j.neuroimage.2016.04.072
- Eickhoff SB, Laird AR, Fox PM, Lancaster JL, Fox PT. Implementation errors in the GingerALE Software: description and recommendations. Hum Brain Mapp. 2017;38(1):7–11. doi:10.1002/hbm.23342
- Langner R, Rottschy C, Laird AR, Fox PT, Eickhoff SB. Meta-analytic connectivity modeling revisited: controlling for activation base rates. NeuroImage. 2014;99:559–570. doi:10.1016/j.neuroimage.2014.06.007
- Fox PT, Lancaster JL. Opinion: mapping context and content: the BrainMap model. Nat Rev Neurosci. 2002;3(4):319–321. doi:10.1038/nrn789
- Lindquist MA. The Statistical Analysis of fMRI Data. Stat Sci. 2008;23(4):439–464. doi:10.1214/09-STS282
- Poldrack RA, Mumford JA, Nichols TE. Handbook of Functional MRI Data Analysis. Cambridge University Press; 2011.
- Logothetis NK, Wandell BA. Interpreting the BOLD Signal. Ann Rev Physiol. 2004;66(66):735–769. doi:10.1146/annurev.physiol.66.082602.092845
- Talairach PJ Co-planar stereotaxic atlas of the human brain; 1988. Available from: https://cir.nii.ac.jp/crid/1370565169355516436. Accessed April 17, 2024.
- Collins DL, Neelin P, Peters TM, Evans AC. Automatic 3D intersubject registration of MR volumetric data in standardized Talairach space. J Comput Assist Tomogr. 1994;18(2):192–205.
- Tahmasian M, Sepehry AA, Samea F, et al. Practical recommendations to conduct a neuroimaging meta-analysis for neuropsychiatric disorders. Hum Brain Mapp. 2019;40(17):5142–5154. doi:10.1002/hbm.24746
- Fox PT, Laird AR, Fox SP, et al. BrainMap taxonomy of experimental design: description and evaluation. Hum Brain Mapp. 2005;25(1):185–198. doi:10.1002/hbm.20141
- Laird AR, Fox PM, Price CJ, et al. ALE meta-analysis: controlling the false discovery rate and performing statistical contrasts. Hum Brain Mapp. 2005;25(1):155–164. doi:10.1002/hbm.20136
- Vanasse TJ, Fox PM, Barron DS, et al. BrainMap VBM: an environment for structural meta-analysis. Hum Brain Mapp. 2018;39(8):3308–3325. doi:10.1002/hbm.24078
- Fusar-Poli P, Placentino A, Carletti F, et al. Functional atlas of emotional faces processing: a voxel-based meta-analysis of 105 functional magnetic resonance imaging studies. J Psychiatry Neurosci. 2009;34(6):418–432.
- Vytal K, Hamann S. Neuroimaging support for discrete neural correlates of basic emotions: a voxel-based meta-analysis. J Cogn Neurosci. 2010;22(12):2864–2885. doi:10.1162/jocn.2009.21366
- Brooks SJ, Savov V, Allzén E, Benedict C, Fredriksson R, Schiöth HB. Exposure to subliminal arousing stimuli induces robust activation in the amygdala, hippocampus, anterior cingulate, insular cortex and primary visual cortex: a systematic meta-analysis of fMRI studies. Neuroimage. 2012;59(3):2962–2973. doi:10.1016/j.neuroimage.2011.09.077
- Gan X, Zhou X, Li J, et al. Common and distinct neurofunctional representations of core and social disgust in the brain: coordinate-based and network meta-analyses. Neurosci Biobehav Rev. 2022;135:104553. doi:10.1016/j.neubiorev.2022.104553
- Oaten M, Stevenson RJ, Case TI. Disgust as a disease-avoidance mechanism. Psychol Bull. 2009;135(2):303–321. doi:10.1037/a0014823
- Curtis V, de Barra M, Aunger R. Disgust as an adaptive system for disease avoidance behaviour. Philos Trans R Soc Lond B Biol Sci. 2011;366(1563):389–401. doi:10.1098/rstb.2010.0117
- Vicario CM, Rafal RD, Martino D, Avenanti A. Core, social and moral disgust are bounded: a review on behavioral and neural bases of repugnance in clinical disorders. Neurosci Biobehav Rev. 2017;80:185–200. doi:10.1016/j.neubiorev.2017.05.008
- Phillips ML, Young AW, Senior C, et al. A specific neural substrate for perceiving facial expressions of disgust. Nature. 1997;389(6650):495–498. doi:10.1038/39051
- Bramley R, Howe S, Marmanis H. Notes on the data quality of bibliographic records from the MEDLINE database. Database. 2023;2023:baad070. doi:10.1093/database/baad070
- McKeown S, Mir ZM. Considerations for conducting systematic reviews: evaluating the performance of different methods for de-duplicating references. Syst Rev. 2021;10(1):38. doi:10.1186/s13643-021-01583-y
- Derrfuss J, Mar RA. Lost in localization: the need for a universal coordinate database. Neuroimage. 2009;48(1):1–7. doi:10.1016/j.neuroimage.2009.01.053
- Page MJ, McKenzie JE, Bossuyt PM, et al. The PRISMA 2020 statement: an updated guideline for reporting systematic reviews. PLoS Med. 2021;18(3):e1003583. doi:10.1371/journal.pmed.1003583
- Liloia D, Manuello J, Costa T, Keller R, Nani A, Cauda F. Atypical local brain connectivity in pediatric autism spectrum disorder? A coordinate-based meta-analysis of regional homogeneity studies. Eur Arch Psychiatry Clin Neurosci. 2024;274(1):3–18. doi:10.1007/s00406-022-01541-2
- Turkeltaub PE, Eickhoff SB, Laird AR, Fox M, Wiener M, Fox P. Minimizing within-experiment and within-group effects in activation likelihood estimation meta-analyses. Hum Brain Mapp. 2012;33(1):1–13. doi:10.1002/hbm.21186
- Lancaster JL, Cykowski MD, McKay DR, et al. Anatomical global spatial normalization. Neuroinformatics. 2010;8(3):171–182. doi:10.1007/s12021-010-9074-x
- Laird AR, Robinson JL, McMillan KM, et al. Comparison of the disparity between Talairach and MNI coordinates in functional neuroimaging data: validation of the Lancaster transform. Neuroimage. 2010;51(2):677–683. doi:10.1016/j.neuroimage.2010.02.048
- Manuello J, Liloia D, Crocetta A, Cauda F, Costa T. CBMAT: a MATLAB toolbox for data preparation and post hoc analyses in neuroimaging meta-analyses. Behav Res. 2023. doi:10.3758/s13428-023-02185-3
- Lancaster JL, Woldorff MG, Parsons LM, et al. Automated Talairach atlas labels for functional brain mapping. Hum Brain Mapp. 2000;10(3):120–131. doi:10.1002/1097-0193(200007)10:3<120::aid-hbm30>3.0.co;2-8
- Reid AT, Bzdok D, Genon S, et al. ANIMA: a data-sharing initiative for neuroimaging meta-analyses. Neuroimage. 2016;124(Pt B):1245–1253. doi:10.1016/j.neuroimage.2015.07.060
- Schilbach L, Müller VI, Hoffstaedter F, et al. Meta-analytically informed network analysis of resting state fMRI reveals hyperconnectivity in an introspective socio-affective network in depression. PLoS One. 2014;9(4):e94973. doi:10.1371/journal.pone.0094973
- Liloia D, Mancuso L, Uddin LQ, et al. Gray matter abnormalities follow non-random patterns of co-alteration in autism: meta-connectomic evidence. NeuroImage. 2021;30:102583. doi:10.1016/j.nicl.2021.102583
- Mancuso L, Costa T, Nani A, et al. The homotopic connectivity of the functional brain: a meta-analytic approach. Sci Rep. 2019;9(1):3346. doi:10.1038/s41598-019-40188-3