
Abstract
Purpose
Many studies have reported that exposure to air pollution increases the likelihood of acquiring allergic rhinitis (AR). This study investigated associations between short-term air pollution exposure and AR outpatient visits.
Patients and Methods
The Department of Otorhinolaryngology, Affiliated Hospital of Hangzhou Normal University provided AR outpatient data from January 1, 2019 to December 31, 2021. Daily air quality information for that period was gathered from the Hangzhou Air Quality Inspection Station. We used the Poisson’s generalized additive model (GAM) to investigate relationships between daily outpatient AR visits and air pollution, and investigated lag-exposure relationships across days. Subgroup analyses were performed by age (adult (>18 years) and non-adult (<18 years)) and sex (male and female).
Results
We recorded 20,653 instances of AR during the study period. Each 10 g/m3 increase in fine particulate matter (PM10 and PM2.5) and carbon monoxide (CO) concentrations was associated with significant increases in AR outpatient Visits. The relative risks (RR) were: 1.007 (95% confidence interval (CI): 1.001–1.013), 1.026 (95% CI: 1.008–1.413), and 1.019 (95% CI: 1.008–1.047). AR visits were more likely due to elevated PM2.5, PM10, and CO levels. Additionally, children were more affected than adults.
Conclusion
To better understand the possible effects of air pollution on AR, short-term exposure to ambient air pollution (PM2.5, PM10, and CO) may be linked to increased daily outpatient AR visits.
Introduction
In atopic individuals exposed to allergens, allergic rhinitis (AR) can develop, which is a non-infectious chronic inflammatory illness of the nasal mucosa.Citation1 The condition is characterized by paroxysmal sneezing, clear watery mucus, nasal itching, and nasal congestion.Citation1 Although AR is not a fatal condition, it significantly impairs individuals’ quality of life, imposes a substantial economic burden on both patients and society, and has emerged as a significant public health concern.Citation2,Citation3 It is estimated that AR affects between 10% and 40% of the global population.Citation4 The direct health expenditure associated with AR is estimated to range from $2 billion to $5 billion annually, with additional productivity losses of up to $2 billion to $4 billion per year.Citation2 Moreover, the incidence of AR is alarmingly increasing over time.Citation5 AR is characterized by a propensity for recurrence and is closely associated with other diseases such as asthma, chronic rhinosinusitis, and allergic conjunctivitis.Citation6 The coexistence of AR, chronic rhinosinusitis, and asthma is common, with up to 40% of AR patients reporting symptoms of asthma and up to 80% of individuals with asthma experiencing symptomatic AR.Citation7 Additionally, 34–50% of patients with sinusitis suffer from asthma, while 84% of asthma patients experience sinusitis, particularly during asthma onset.Citation8 Furthermore, a remarkable 88.4% of patients with allergic conjunctivitis develop AR, and the severity and duration of conjunctivitis are significantly correlated with the severity and duration of rhinitis across both children and adults.Citation9 The mechanism behind these comorbidities can be explained by the single airway theory and upper airway remodeling.Citation10
It is now widely accepted that the development of AR is influenced by interactions between genetic factors and the environment.Citation1 Among various environmental factors, air pollution is one of the most prevalent forms of pollution.Citation11,Citation12 Particulate matter 10 (PM10) are coarse particles of diameter 10 micrometers or less, and fine particles with a diameter of 2.5 micrometers or less are particulate matter 2.5 (PM2.5). The World Health Organization (WHO, 2014) estimated that 7 million people died in 2012 due to air pollution, primarily due to cardiovascular and respiratory ailments. Air pollution has been proven to be associated with both acute and chronic respiratory diseases. Hospital admissions or emergency room visits for pneumonia were increased by PM2.5 levels in East Asia.Citation13 Asthma exacerbations were associated with air pollution.Citation14,Citation15 Lung function, emphysema prevalence, chronic obstructive pulmonary disease (COPD) progression, and lung cancer incidence rates were all negatively impacted by long-term exposure to air pollution.Citation16–20
Although air quality in China has improved significantly in recent years, the annual concentration of inhalable particulates greatly exceeds WHO guidelines.Citation21,Citation22 Critically, Recent research suggests that air pollution can exacerbate the occurrence and development of AR.Citation23,Citation24 Air pollution exposure over an extended period, due to transportation and industrial activity, can impair the immune system, promote inflammation, and increase the chances of developing AR and asthma.Citation25 However, there is still no unified conclusion on which components have an impact on the incidence rate of AR. Therefore, we aim to investigate the correlation between short-term air pollution exposure in Hangzhou and the number of outpatient AR patients to identify the specific components of air pollution that contribute to changes in the short-term incidence rate of AR.
Materials and Methods
We conducted a retrospective study in Hangzhou, in which we matched air pollution data from Hangzhou with the number of patients diagnosed with AR at Hangzhou Normal University Affiliated Hospital. The aim of the study was to investigate the relative risk factors of air pollution components and the incidence of AR, as well as to identify which specific components have an impact on the number of AR cases. This study was approved by the Ethics Committee of Affiliated Hospital of Hangzhou Normal University (no. 2022-(E2)-KS-104) and was granted an exemption from obtaining informed consent from the patients involved.
Air Pollution and Meteorological Data
From January 1, 2019 to December 31, 2021, the Hangzhou Meteorological Bureau released daily air quality data for PM2.5, PM10, and carbon monoxide (CO) concentrations. Also, daily average temperature and humidity data were downloaded from the China Meteorological Administration website (http://data.cma.cn/). The daily concentrations are represented as 24 h averages (Supplementary Table 1).
AR Visits per Day
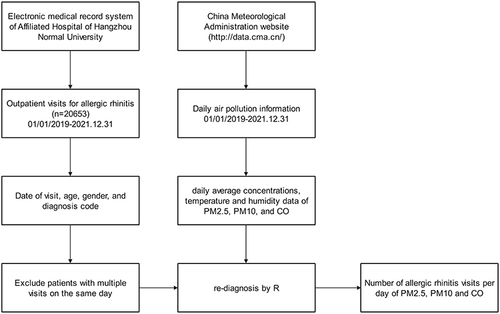
Between 2019 and 2021, we obtained the number of AR-related outpatient visits from the Department of Otolaryngology, Affiliated Hospital of Hangzhou Normal University. This tertiary care general hospital is located in the central city of Hangzhou. The study population comprised all outpatients with AR who were examined by an otolaryngologist during the study period. Records provided visit date, age, gender, and diagnosis code information (Supplementary Table 2). Only one visit/patient/day was gathered to prevent double counting. According to the latest diagnostic standards, the diagnostic program was written in R (The R Foundation R Foundation for Statistical Computing, Vienna, Austria) to re-diagnose outpatient information recorded in the hospital outpatient database. The process of incorporating daily medical data of patients with AR, as well as corresponding air pollution and meteorological data, into the study is shown in .
Figure 1 Flow chart showing outpatient visit inclusion criteria and daily air pollution information.
Statistical Methods
A GAM was used for statistical analysis to examine all data. The GAM used quasi-Poisson regression as daily outpatient visits generally followed an over-dispersed Poisson distribution. To account for potential confounding effects, a number of covariates, such as mean daily temperature and mean daily humidity, were included. Firstly, unmeasured long-term and seasonal trends of > 2 months and a natural cubic regression smoothing function with seven degrees of freedom (df) per year for calendar time, were excluded. Secondly, according to minimum Akaike information criterion (AIC) model principles, nonlinear confounding effects for weather were controlled by natural smoothing functions for mean temperature (6 df) and relative humidity (4 df). Thirdly, public holidays and “day of the week” indicator variables were implemented. Briefly, the estimated log relative rate of pollution for the city was obtained by fitting the following log-linear GAM:
Where E(Yt) is the expected number of outpatients with AR on day t; β is the log correlation rate of AR associated with a unit increase in air pollutants; Zt is the pollutant concentration on day t; the DOW Jones index is a dummy variable for a day of the week; and ns is a natural cubic regression smoothing function.
After basic model development, a single pollutant model was initially used and introduced, and the concentrations of each pollutant on the same day (lag0) were presented in turn. To validate model stability, and considering that the health effects of ambient air pollutants may have lasted for several days, additional single lag days were used (lag0, lag1, lag2, lag3, lag4, lag5, lag6, and lag7) and moving average exposures were obtained for multiple days (lag0–1, lag0–2, lag0–3, lag0–4, lag0–5, lag0–6, and lag0–7). The stability of impact estimations following changes for shared contaminants was then examined using two pollutant models.
All outpatients were stratified by age (< 18 years and ≥ 18 years) and sex as behavioral patterns and common diseases may have differed.Citation26,Citation27 Results were expressed as relative risks (RR) and 95% confidence intervals (CI) associated with a 10 μg/m3 increase in PM2.5. Statistical tests were two-sided, and effects with a p value < 0.05 were 95% statistically significant. All statistical models were constructed using R software version 3.6.0 (R Foundation for Statistical Computing, version 3.6.1; http://www.Rproject.org) in the MGCV package.
Results
Basic Research Data
Basic information on outpatient visits, pollutants, and weather data are provided (). In total, 20,653 AR outpatient visits were recorded between January 1, 2019 and December 31, 2021, with 10,998 male and 9655 female patients. Overall, the mean number of daily outpatient visits was 16.34, with minors (< 18 years) accounting for 35% (5.73 visits) and males for 55% (8.93 visits). The daily mean air PM2.5, PM10, and CO concentrations during the study period were 42.21 µg/m3, 61.69 µg/m3, and 24.39 µg/m3, respectively. Daily mean PM2.5 levels were greater than the national secondary air pollution limit (35 µg/m3). Also, the daily average temperature in Hangzhou was 18.2°C and the average relative humidity was 72.84%.
Table 1 Descriptive Statistics Showing Daily Allergic Rhinitis Outpatient Visits, Air Pollutant Concentrations, and Weather Conditions
Analysis results of Single Day Lag Model
The single-day lagged model findings for age and gender are shown (). We accounted for the fact that effects were delayed when compared with exposure. The model included a delay (lag). For instance, lag1 indicated an exposure on a day prior to the resulting incident. Overall, in terms of AR, for PM10, the whole group lag was 0, 2–4, male lag was 0, 4, female lag was 1, 2, adult lag was 0, 2, and non-adult lag was 1–4. For PM2.5, a lag between 0–1, 4 was identified for the whole group, a lag between 0–1 was identified for males, a lag between 1–2, 6–7 was identified for females, a lag of 1, 7 was identified for adults, and a lag of 1, 4 was identified for non-adults. For CO, the whole group lag was 0, 2, the male lag was 4, the female lag was 4, the adult lag was 2, and the non-adult lag was 4.
Table 2 Relative Risks of Allergic Rhinitis-Associated Outpatient Visits for PM10, PM2.5, and CO at Different Single Lag Days, with 95th Percentiles
Analysis Results of Cumulative Exposure Model
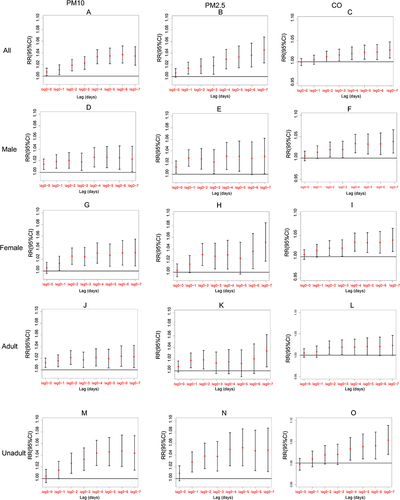
Age and gender subgroup analysis results in cumulative exposure models (lag00–lag07) are shown (). Statistically significant results were observed at lag 01–07 for PM10 and PM2.5 and lag 03–07 for carbon monoxide (CO). The impact increased as the lag time increased. Connections between male and female groupings did not differ significantly. Associations for PM10, PM2.5, and CO were stronger in minors (< 18 years) at different lag days when compared with adults.
Figure 2 Ratio risks (95% confidence interval) of daily outpatient visits for allergic rhinitis associated with lag days (0–7) of cumulative exposure models after subgroup analyses by gender and age ((A–C) represents the entire group for PM2.5, PM10, CO separately; (D–F) represents the male subgroup for PM2.5, PM10, CO separately; (G–I) represents the female subgroup for PM2.5, PM10, CO separately; (J–L) represents the adult subgroup for PM2.5, PM10, CO separately; (M–O) represents the unadult subgroup for PM2.5, PM10, CO separately).
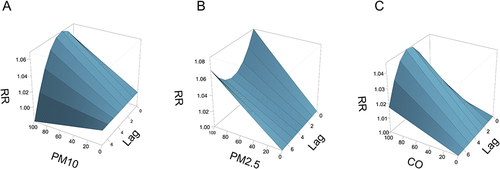
Response curves for outpatient visits, air pollutants (PM2.5, PM10, and CO), and single-day lag times for patients with AR are shown (). From graphs, we identified a positive correlation between RR of AR and pollutant concentrations; no positive correlation was observed with a single-day lag time. Different air pollutants produced different irritation peaks in patients. PM10 had the greatest impact on outpatient visits for AR after 1 day of generation; PM2.5 had the highest RR on the day of generation and after 7 days of generation; while CO displayed the greatest irritation in patients with AR at 4 days of cumulative exposure.
Figure 3 Ratio risks of daily outpatient visits for allergic rhinitis with the concentration of air pollutants and lag days ((A) for PM10, (B) for PM2.5, and (C) for CO).
Results of Two-Pollutant Model
presents the results of the two-pollutant models at lag 0. It was observed that the effects of all three pollutants substantially attenuated and became less statistically significant when adjusted for co-pollutants. The association between outpatient visits and PM10, as well as CO, slightly decreased but remained significant after adjustment for PM10 (1.317, 95% CI: 1.118–1.717) and CO (1.209, 95% CI: 1.018–1.347) respectively. However, the associations of PM10 and CO lost statistical significance after controlling for CO and PM2.5, respectively.
Table 3 Relative Risks of Allergic Rhinitis Outpatient Visits Associated with a 10 µg/m3 (PM10, PM2.5, and CO) Increase in Pollutant Concentrations in Two-Pollutant Models
Discussion
Our study presents evidence of the detrimental impact of background air pollution on AR in the Hangzhou region. We investigated the lag effects of air pollutants and potential differences in gender and age among daily outpatients receiving AR treatment at a hospital over a 3-year period. Our results revealed a positive and delayed correlation between air pollution and the frequency of AR outpatient visits. As air pollution levels increased, the RR of AR in outpatients also increased.
The effects of PM on respiratory disorders have been investigated by several studies.Citation23,Citation24,Citation28–30 PM2.5 are airborne particles with an aerodynamic equivalent diameter of 2.5 microns or smaller. They reside for a long time in the atmosphere and are transported over vast distances. Because particle sizes are small enough to pass through fine bronchi and alveoli, PM2.5 has become one of the major causes of lower respiratory disease. PM10 only reaches the upper respiratory tract due to its larger diameter. From animal studies, PM2.5 exposure was shown to cause ciliary epithelial destruction, cupped cell proliferation, and increased mucin MUC5AC secretion from the nasal mucosa of AR rats. PM2.5 also inhibited interferon-γ (IFN-γ) production, suppressed Th1 responses, but enhanced Th2 cell-dominated immune responses, such as increased interleukin-4 (IL-4), IL-13, IL-6 levels, and other pro-inflammatory factor release.Citation31,Citation32 In human nasal epithelial cells, PM2.5 impaired epithelium barrier function and caused cellular oxidative stress and inflammation. Epigenetically, PM2.5 upregulated GATA-3 mRNA expression in AR rat nasal mucosa, whereas T-bet was significantly downregulated.Citation31 Prolonged exposure to PM2.5 levels positively correlated with IFN-γ promoter methylation levels, possibly through the ERK-DNMT pathway.Citation33 PM2.5 also caused significant changes in nasal mucosal miRNA expression in AR rats;Citation32 the expression of eight microRNAs were consistent with microRNA gene microarray results and were shown to have crucial roles regulating PM2.5 effects on the biological behavior and mucosal inflammation in AR rats.Citation32 PM may also enhance organism sensitivity to airborne allergens. A Japanese study confirmed that PM2.5 increased organism sensitivity to pollen.Citation34 A Hangzhou study reported that PM2.5 and PM10 were aggravating factors for dust mite sensitization.Citation35 This may have been due to increased allergens deposited in airways via particle transport, increased epithelial permeability by oxidative damage, and increased antigenicity and adjuvant actions of chemically modified proteins.Citation36
We observed that PM2.5 had stronger pathogenic effects on AR when compared with PM10. When compared with PM10, PM2.5 had a higher surface area ratio, was more active, and carried more poisonous and hazardous materials, such as heavy metals and germs. Also, PM2.5 could enter deeper into the lower respiratory tract and alveoli, making it more difficult to excrete, and causing more intense and sustained oxidative stress when compared with PM10. From previous toxicological studies, when compared with PM10, PM2.5 induced M1 inflammatory phenotypes, which decreased phagocytosis and increased macrophage apoptosis. This was manifested as increased tumor necrosis factor- and M1-related gene expression (inducible nitric oxide synthase) and decreased IL-10 and M2 phenotype gene expression (arginase).Citation37
Our study suggested that children were more affected by air pollution. AR pathogenesis in children is not significantly different to adults. Studies have reported that air pollutants are the main pollutants in the respiratory systems of children.Citation30 Firstly, children weigh less than adults, they have smaller airway calibers, and smaller respiratory surface areas. Also, children breathe 50% more air per kilogram of body weight. A study shows that 3-month old infants exhibited 4-fold higher inhalation (PM2.5 and PM10) doses than their mothers.Citation38 Also, the number of particles deposited per unit of frontal surface area was 4–5 times higher in children. Secondly, children’s lungs are immature at birth and do not develop until approximately 6 years old. Such lung epithelium immaturity during infancy facilitates toxins and other substances from atmospheric pollution crossing the epithelial barrier. Thirdly, the immune system is immature at birth. Studies have shown that PM disrupt intrapulmonary homeostasis in the innate immune system by affecting epithelial functions in the lung, macrophages, pattern recognition receptors, and the microbiota.Citation37 Fourthly, distinct to adults, a child’s respiratory zone is located closer to the ground and is limited by height. Environmental pollutants from transportation are emitted near the ground and then diffused. Air pollutant concentrations associated with traffic pollution are highest closer to the ground and this increases children’s exposure to ambient air pollutants.Citation39 Combined, these factors may explain why PM made children more prone to developing AR when compared with adults.
CO had a significant effect on increased AR outpatient visits; these effects were greater in preadolescent children when compared with adults. Currently, CO relevance to AR is unclear. So far, CO does not appear to have a significant impact on the incidence rate of AR.Citation24,Citation40 However, a 100 parts per billion increase in daily CO levels in children within a year of birth had a lifetime RR of 1.10 for AR. A previous study supported this view and suggested that children under 15 years of age may be more vulnerable to CO.Citation41 This concurred with our data. Therefore, the relevance of CO to AR remains to be fully characterized.
In urban environments, the main CO sources are derived from the incomplete combustion of carbon-containing fuels and photochemical atmospheric reactions. CO, which is frequently found in indoor and outdoor settings, significantly contributes to air pollution via transportation, tobacco smoke, and gas stove emissions. Due to CO poisoning, reactive oxygen species are produced, different organs receive less oxygen, and cardiac ion channels are impacted. Critically, even at non-toxic levels, the impact is still evident. A recent study proposed a connection between reactive oxygen species formation and childhood allergy illnesses such as asthma and AR, and identified higher malondialdehyde levels in nasal and oral samples from children with asthma or AR when compared with healthy controls. This could be why CO-related AR is getting worse.Citation31 Further studies are required to unravel how CO and AR interact.
When compared with previous studies, firstly, our study period was up to 3 years and included the time since the outbreak of the COVID-19 pandemic, which reflected a new situation in terms of the impact of air pollution on AR; and secondly, we selected Hangzhou, a typical tourist city, as the study location, as it provided a good sampling area for observing air pollution at low concentrations.
Additionally, our study had several drawbacks. Potential mixed factors, such as family allergy history, smoking habits, pet-breeding behaviors, and drug-use history may have affected relationships between air pollutants and AR. Secondly, the number of outpatient clinics at a single hospital does not represent levels in a large city. Then, in the context of the COVID-19 pandemic, people pay more attention to personal protection such as wearing masks, which can reduce the impact of air pollutants on AR to a certain extent. In the end, the chemical composition of PM was not analyzed in this study, which makes it challenging to precisely identify a single emission source. If specific public health actions are required to regulate emission sources, further comprehensive investigations on chemical composition (ions, elements, black carbon, and organic carbon) and its impact on AR are required.
There are some limitations to this study. Firstly, it is a retrospective study that can only establish a correlation between air pollution and the number of outpatient visits for AR based on data analysis, but it cannot determine a causal relationship between the two factors. Secondly, this study was conducted at a single center, and the data included may not fully represent outpatient visits for AR in Hangzhou. Finally, the study period coincided with the outbreak of a new epidemic, during which public health measures such as travel restrictions and mask-wearing were implemented, which may have impacted the incidence rate of AR.
Conclusion
We suggest that air pollution, specifically PM2.5, PM10, and O3, is correlated with the number of outpatient visits for AR in Hangzhou, particularly among children. We recommend implementing environmental control measures and public health strategies to address this growing issue.
Abbreviations
AR, allergic rhinitis; PM10, Particulate matter 10; PM2.5, particulate matter 2.5; WHO, The World Health Organization; NO2, Nitrogen dioxide; SO2, sulfur dioxide; O3, ozone; COPD, chronic obstructive pulmonary disease; FVC, forced vital capacity; FEV1, forced expiratory volume in the first second; PEF, peak expiratory flow; GAM, generalized additive model; CO, carbon monoxide; AIC, Akaike information criterion; CI, confidence intervals.
Data Sharing Statement
The data for this study can be made available from the corresponding author on reasonable request.
Ethics Approval
The study was approved by the Ethics Committee of Affiliated Hospital of Hangzhou Normal University (no. 2022-(E2)-KS-104) and complied with the Declaration of Helsinki. The study was granted exemption from informed patient consent. Because this study was retrospective in nature, many patients could not be contacted. We declare that the patient’s name, gender, age, address, and other information will be kept confidential. We have processed the data for privacy, and any identifiable information would not appear in the records of images, text, or photos.
Disclosure
The authors report no potential conflicts of interest in this work.
Acknowledgments
We acknowledge the Affiliated Hospital of Hangzhou Normal University and Hangzhou Zhenqi Technology Co., Ltd. for providing us with necessary data to realize this research. The research work was funded by the Affiliated Hospital of Hangzhou Normal University (no. 2021YN2021121).
References
- Seidman MD, Gurgel RK, Lin SY, et al. Clinical practice guideline: allergic rhinitis. Otolaryngol Head Neck Surg. 2015;152(1 Suppl):S1–S43. doi:10.1177/0194599814561600
- Blaiss MS. Allergic rhinitis: direct and indirect costs. Allergy Asthma Proc. 2010;31(5):375–380. doi:10.2500/aap.2010.31.3329
- Li X, Xu X, Li J, et al. Direct and indirect costs of allergic and non-allergic rhinitis to adults in Beijing, China. Clin Transl Allergy. 2022;12(4):e12148. doi:10.1002/clt2.12148
- Brożek JL, Bousquet J, Agache I, et al. Allergic Rhinitis and its Impact on Asthma (ARIA) guidelines-2016 revision. J Allergy Clin Immunol. 2017;140(4):950–958. doi:10.1016/j.jaci.2017.03.050
- Bousquet J, Anto JM, Bachert C, et al. Allergic rhinitis. Nat Rev Dis Primers. 2020;6(1):95. doi:10.1038/s41572-020-00227-0
- Greiner AN, Hellings PW, Rotiroti G, Scadding GK. Allergic rhinitis. Lancet. 2011;378(9809):2112–2122. doi:10.1016/s0140-6736(11)60130-x
- Leynaert B, Neukirch C, Kony S, et al. Association between asthma and rhinitis according to atopic sensitization in a population-based study. J Allergy Clin Immunol. 2004;113(1):86–93. doi:10.1016/j.jaci.2003.10.010
- Marseglia GL, Caimmi S, Marseglia A, et al. Rhinosinusitis and asthma. Int J Immunopathol Pharmacol. 2010;23(1 Suppl):29–31. doi:10.1177/03946320100230S108
- Sánchez-Hernández MC, Dordal MT, Navarro AM, et al. Severity and duration of allergic conjunctivitis: are they associated with severity and duration of allergic rhinitis and asthma?. Eur Ann Allergy Clin Immunol. 2022;54(6):277–283. doi:10.23822/EurAnnACI.1764-1489.231
- Samitas K, Carter A, Kariyawasam HH, Xanthou G. Upper and lower airway remodelling mechanisms in asthma, allergic rhinitis and chronic rhinosinusitis: the one airway concept revisited. Allergy. 2018;73(5):993–1002. doi:10.1111/all.13373
- Hassan Bhat T, Jiawen G, Farzaneh H. Air Pollution Health Risk Assessment (AP-HRA), principles and applications. Int J Environ Res Public Health. 2021;18(4):1935. doi:10.3390/ijerph18041935
- Santos UP, Arbex MA, Braga ALF, et al. Environmental air pollution: respiratory effects. J Bras Pneumol. 2021;47(1):e20200267. doi:10.36416/1806-3756/e20200267
- Yee J, Cho YA, Yoo HJ, Yun H, Gwak HS. Short-term exposure to air pollution and hospital admission for pneumonia: a systematic review and meta-analysis. Environ Health. 2021;20(1):6. doi:10.1186/s12940-020-00687-7
- Khreis H, Kelly C, Tate J, Parslow R, Lucas K, Nieuwenhuijsen M. Exposure to traffic-related air pollution and risk of development of childhood asthma: a systematic review and meta-analysis. Environ Int. 2017;100:1–31. doi:10.1016/j.envint.2016.11.012
- Nejjari C, Marfak A, Rguig A, et al. Ambient air pollution and emergency department visits among children and adults in Casablanca, Morocco. AIMS Public Health. 2021;8(2):285–302. doi:10.3934/publichealth.2021022
- Liu S, Jørgensen JT, Ljungman P, et al. Long-term exposure to low-level air pollution and incidence of chronic obstructive pulmonary disease: the ELAPSE project. Environ Int. 2021;146:106267. doi:10.1016/j.envint.2020.106267
- Wang M, Aaron CP, Madrigano J, et al. Association between long-term exposure to ambient air pollution and change in quantitatively assessed emphysema and lung function. JAMA. 2019;322(6):546–556. doi:10.1001/jama.2019.10255
- Hvidtfeldt UA, Severi G, Andersen ZJ, et al. Long-term low-level ambient air pollution exposure and risk of lung cancer - A pooled analysis of 7 European cohorts. Environ Int. 2021;146:106249. doi:10.1016/j.envint.2020.106249
- Park J, Kim HJ, Lee CH, Lee CH, Lee HW. Impact of long-term exposure to ambient air pollution on the incidence of chronic obstructive pulmonary disease: a systematic review and meta-analysis. Environ Res. 2021;194:110703. doi:10.1016/j.envres.2020.110703
- Zhang W, Ma R, Wang Y, Jiang N, Zhang Y, Li T. The relationship between particulate matter and lung function of children: a systematic review and meta-analysis. Environ Pollut. 2022;309:119735. doi:10.1016/j.envpol.2022.119735
- Zhang Q, Zheng Y, Tong D, et al. Drivers of improved PM(2.5) air quality in China from 2013 to 2017. Proc Natl Acad Sci U S A. 2019;116(49):24463–24469. D - 7505876. (- 1091-6490 (Electronic)):T - ppublish.
- Liu S, Yang X, Duan F, Zhao W. Changes in air quality and drivers for the heavy PM(2.5) pollution on the North China Plain Pre-to Post-COVID-19. Int J Environ Res Public Health. 2022;19(19):12904. D - 101238455. (- 1660-4601 (Electronic)):T - epublish.
- Deng Q, Lu C, Yu Y, Li Y, Sundell J, Norbäck D. Early life exposure to traffic-related air pollution and allergic rhinitis in preschool children. Respir Med. 2016;121:67–73. doi:10.1016/j.rmed.2016.10.016
- Hao S, Yuan F, Pang P, Yang B, Jiang X, Yan A. Early childhood traffic-related air pollution and risk of allergic rhinitis at 2–4 years of age modification by family stress and male gender: a case-control study in Shenyang, China. Environ Health Prev Med. 2021;26(1):48. doi:10.1186/s12199-021-00969-7
- Vawda S, Mansour R, Takeda A, et al. Associations between inflammatory and immune response genes and adverse respiratory outcomes following exposure to outdoor air pollution: a HuGE systematic review. Am J Epidemiol. 2014;179(4):432–442. doi:10.1093/aje/kwt269
- Schuler Iv CF, Montejo JM. Allergic rhinitis in children and adolescents. Immunol Allergy Clin North Am. 2021;41(4):613–625. doi:10.1016/j.iac.2021.07.010
- Hong SN, Won JY, Nam EC, et al. Clinical manifestations of allergic rhinitis by age and gender: a 12-year single-center study. Ann Otol Rhinol Laryngol. 2020;129(9):910–917. doi:10.1177/0003489420921197
- Huang Y, Zhu M, Ji M, et al. Air pollution, genetic factors, and the risk of lung cancer: a prospective study in the UK Biobank. Am J Respir Crit Care Med. 2021;204(7):817–825. doi:10.1164/rccm.202011-4063OC
- Bălă GP, Râjnoveanu RM, Tudorache E, Motișan R, Oancea C. Air pollution exposure-the (in)visible risk factor for respiratory diseases. Environ Sci Pollut Res Int. 2021;28(16):19615–19628. doi:10.1007/s11356-021-13208-x
- Heinrich J, Slama R. Fine particles, a major threat to children. Int J Hyg Environ Health. 2007;210(5):617–622. doi:10.1016/j.ijheh.2007.07.012
- Guo ZQ, Dong WY, Xu J, et al. T-helper type 1-T-helper type 2 shift and nasal remodeling after fine particulate matter exposure in a rat model of allergic rhinitis. Am J Rhinol Allergy. 2017;31(3):148–155. doi:10.2500/ajra.2017.31.4437
- Huang Y, Guo ZQ, Zhang RX, et al. Effect of PM2.5 on microRNA expression and function in nasal mucosa of rats with allergic rhinitis. Am J Rhinol Allergy. 2020;34(4):543–553. doi:10.1177/1945892420912367
- Li Y, Zhou J, Rui X, Zhou L, Mo X. PM2.5 exposure exacerbates allergic rhinitis in mice by increasing DNA methylation in the IFN-γ gene promoter in CD4+T cells via the ERK-DNMT pathway. Toxicol Lett. 2019;301:98–107. doi:10.1016/j.toxlet.2018.11.012
- Konishi S, Ng CF, Stickley A, et al. Particulate matter modifies the association between airborne pollen and daily medical consultations for pollinosis in Tokyo. Sci Total Environ. 2014;499:125–132. doi:10.1016/j.scitotenv.2014.08.045
- Ye Q, Zhang T, Mao JH. Haze facilitates sensitization to house dust mites in children. Environ Geochem Health. 2020;42(7):2195–2203. doi:10.1007/s10653-019-00481-6
- Fukuoka A, Yoshimoto T. Barrier dysfunction in the nasal allergy. Allergol Int. 2018;67(1):18–23. doi:10.1016/j.alit.2017.10.006
- Rahmani H, Sadeghi S, Taghipour N, et al. The effects of particulate matter on C57BL/6 peritoneal and alveolar macrophages. Iran J Allergy Asthma Immunol. 2020;19(6):647–659. doi:10.18502/ijaai.v19i6.4934
- Madureira J, Slezakova K, Silva AI, et al. Assessment of indoor air exposure at residential homes: inhalation dose and lung deposition of PM(10), PM(2.5) and ultrafine particles among newborn children and their mothers. Sci Total Environ. 2020;717:137293. doi:10.1016/j.scitotenv.2020.137293
- Gao J, Qiu Z, Cheng W, Gao HO. Children’s exposure to BC and PM pollution, and respiratory tract deposits during commuting trips to school. Ecotoxicol Environ Saf. 2022;232:113253. doi:10.1016/j.ecoenv.2022.113253
- Kim SH, Lee J, Oh I, et al. Allergic rhinitis is associated with atmospheric SO2: follow-up study of children from elementary schools in Ulsan, Korea. PLoS One. 2021;16(3):e0248624. doi:10.1371/journal.pone.0248624
- Wang J, Lu M, An Z, et al. Associations between air pollution and outpatient visits for allergic rhinitis in Xinxiang, China. Environ Sci Pollut Res Int. 2020;27(19):23565–23574. doi:10.1007/s11356-020-08709-0