
 ?Mathematical formulae have been encoded as MathML and are displayed in this HTML version using MathJax in order to improve their display. Uncheck the box to turn MathJax off. This feature requires Javascript. Click on a formula to zoom.
Abstract
Objective
The assessment of the grade of renal fibrosis in diabetic kidney disease (DKD) requires renal biopsy, which may be associated with certain risks. To assess the severity of chronic pathologic changes in DKD, we performed a quantitative analysis of renal parenchymal stiffness in advanced DKD, using shear wave elastography (SWE) imaging.
Patients and methods
Twenty-nine diabetic patients with chronic kidney disease (CKD) grades 3–4 due to DKD, and 23 healthy subjects were enrolled. Combined conventional ultrasound and SWE imaging were performed on all participants. The length, width, and cortical thickness and stiffness were recorded for each kidney.
Results
Cortical thickness was lower in patients with DKD than in healthy subjects (13.8±2.2 vs 14.8±1.6 mm; P=0.002) and in DKD patients with CKD grade 4 than in those with grade 3 (13.0±3.5 vs 14.7±2.1 mm; P<0.001). Cortical stiffness was greater in patients with DKD than in healthy subjects (23.72±14.33 vs 9.02±2.42 kPa; P<0.001), in DKD patients with CKD grade 4 than in those with grade 3 (30.4±16.2 vs 14.6±8.1 kPa; P<0.001), and in DKD patients with CKD grade 3b, than in those with CKD grade 3a (15.7±6.7 vs 11.0±4.2 kPa; P=0.03). Daily proteinuria was higher in DKD patients with CKD grade 4 than in those with grade 3 (5.52±0.96 vs 1.13±0.72; P=0.001), and in DKD patients with CKD grade 3b, than in those with CKD grade 3a (1.59±0.59 vs 0.77±0.48; P<0.001). Cortical stiffness was inversely correlated with the estimated glomerular filtration rate (r=−0.65, P<0.001) and with cortical thickness (r=−0.43, P<0.001) in patients with DKD.
Conclusions
In patients with advanced DKD, SWE imaging may be utilized as a simple and practical method for quantitative evaluation of the chronic morphological changes and for the differentiation between CKD grades.
Introduction
Diabetes mellitus is the leading cause of end-stage renal disease (ESRD) worldwide. Clinically, diabetic kidney disease (DKD) is characterized by a progressive increase in proteinuria, a decline in glomerular filtration rate (GFR), elevated blood pressure, and a high risk of kidney failure. In addition, advanced DKD is characterized by morphologic renal changes that include varying degrees of fibrosis.Citation1,Citation2
For a number of decades, the evaluation of renal disorders has been based on a variety of conventional methods, including ultrasound, computerized tomography, magnetic fields, and biochemical analysis. Although the progression of DKD can be assessed from routine biochemical tests, such as the amount of urinary protein and serum creatinine levels, assessment of the grade of renal fibrosis requires renal biopsy. This is an invasive and costly procedure that may be associated with certain risks and is not routinely performed.Citation3–Citation5
While kidney biopsy is required for the definitive diagnosis of diabetic nephropathy, in most cases, careful screening of diabetic patients can identify people with DKD without the need for kidney biopsy. Thus, renal biopsy is usually considered when the course of DKD is not typical, as when other diseases, such as membranous nephropathy, are suspected. Although most complications of renal biopsies are mild and resolve spontaneously, major complications have been reported in up to 7.3% of biopsies.Citation3 Renal insufficiency is considered a main risk factor for the development of complications after renal biopsies. The risk of bleeding has been shown to increase with worsening of the degree of renal insufficiency.Citation4 Compared to patients with normal renal function, patients with CKD grades 3 and 4 have a six-fold increased risk of severe bleeding.Citation4 Despite the identification of predisposing risk factors, there is no definitive way to predict which patients will develop serious bleeding. Therefore, a noninvasive method may be preferred for assessing the severity and progression of chronic renal changes, particularly in cases in which it is advisable to avoid performing a kidney biopsy, such as in DKD patients with a single kidney or in those who are receiving anticoagulant therapy. Thus, shear wave elastography (SWE) imaging may be applied as a simple tool for assessing the severity of chronic morphologic changes and for establishing categories of severity based on cortical stiffness measurements, at least in cases in which renal biopsy should be avoided or is contraindicated. Certainly, other studies are needed to establish the correlations between cortical stiffness, morphologic changes, and renal function.
Conventional renal ultrasound may reveal reduced renal length and cortical thickness, as well as increased cortical echogenicity, which may suggest the presence of chronic atrophic morphological changes in a variety of renal diseases. However, these measurements are not quantitative. Moreover, in diabetic patients, kidneys frequently do not show atrophic change by conventional renal ultrasound, even in advanced DKD with CKD grades 3 and 4. Therefore, conventional renal ultrasound is, generally, not informative for the evaluation of the progression of DKD and not useful for the differentiation between the CKD grades.Citation1,Citation2,Citation6
SWE imaging, based on acoustic radiation force impulse (ARFI) technology, is a noninvasive and cost effective ultrasound diagnostic method that has been developed for the evaluation of tissue elasticity.Citation7–Citation10 Essentially, SWE technology measures the velocity of the shear wave (in m/s) that passes through the examined tissue, and then converts this measurement into a tissue stiffness measurement that is expressed in kPa.Citation7–Citation11 Combined conventional and SWE imaging can provide qualitative and quantitative assessments of tissue elasticity. A number of recent applications of SWE have focused on the evaluation of the mechanical properties of renal tissue.Citation7–Citation11
Mechanical properties of the kidney depend on its histology, particularly the amount of fibrosis in the renal parenchyma. A simple, practical, and noninvasive measure is needed for quantitative assessment of renal fibrosis. Yet, the ARFI technique is difficult to apply to native kidneys because of the limited detection depth, which is a maximum of 8 cm from the probe surface. Only a few studies examined renal elastographic parameters in native kidneys of patients with DKD. Goya et alCitation10 and Yu et alCitation11 showed that ARFI can be used to assess renal morphologic changes in patients with DKD. Goya et alCitation10 evaluated the changes in the elasticity of the renal parenchyma in healthy volunteers and patients with diabetic nephropathy using ARFI imaging. The shear wave velocities (m/s) for the kidneys were higher in patients with stage 1–5 diabetic nephropathy than healthy volunteers, and it was concluded that ARFI imaging was able to distinguish between different diabetic nephropathy stages (except for stage 5). Also, Yu et alCitation11 evaluated the changes in the elasticity of the renal parenchyma in healthy volunteers and three groups of patients with diabetic nephropathy, according to their urinary albumin-to-creatinine ratio (ACR): normoalbuminuria (ACR <30 mg/g), microalbuminuria (ACR 30–300 mg/g), and macroalbuminuria (ACR ≥300 mg/g and estimated glomerular filtration rate [eGFR] ≥30 mL/min/1.73 m2), to determine and to compare the shear wave velocity of the renal cortex between these groups.Citation6 The results showed that there was no significant difference between the normoalbuminuria and healthy subjects, but there was a significant difference between the microalbuminuria and macroalbuminuria groups and the healthy subjects. It was concluded that it is feasible to use ARFI imaging to determine the renal cortical shear wave velocity for judging renal injury in type 2 diabetes mellitus.
In the current study, we investigated whether renal SWE imaging expressed in kPa can serve as a practical and noninvasive tool for quantitative assessment of renal fibrosis in DKD patients with CKD grades 3a, 3b, and 4, where conventional renal ultrasound is not informative for the evaluation of the progression of DKD and not useful for the differentiation between CKD grades.
Materials and methods
The study protocol was approved by the Institutional Helsinki Committee of Galilee Medical Center, Naharyia, Israel (no 0096-14-NHR) and written informed consent was obtained from all participants.
Twenty-nine patients with type 2 diabetes mellitus and CKD grade 3–4 due to DKD, and 23 healthy subjects were enrolled in the study. All patients with DKD were receiving diabetic treatment, seven (24.1%) were receiving oral antidiabetic treatment, and 22 (75.9%) were receiving insulin therapy. The eGFR was calculated by using the CKD epidemiology collaboration (CKD-EPI) equation:
where Scr is serum creatinine (mg/dL); κ is 0.7 for females, and 0.9 for males; α is −0.329 for females and −0.411 for males; min indicates the minimum of Scr/κ or 1; and max indicates the maximum of Scr/κ or 1.Citation12 Daily urinary protein excretion was determined by 24-hour urine collection. Diabetic nephropathy was defined on the basis of a urinary albumin excretion of more than 300 mg in a 24-hour urine collection and reduced eGFR.Citation2
Combined conventional ultrasound imaging for routine kidney scan with SWE imaging, using the Philips iU22 xMATRIX ultrasound system with ARFI-based technology, including a 5–1 MHz convex probe (Philips Medical Systems, Bothell, WA, USA), was performed on all participants. Immediately after image acquisition, the screen displays the image and measurement results, including the mean and median values and the deviations expressed in kPa or m/s. If measurement reliability is low, 0.00 kPa will be displayed as the result. Elastic value (E) expressed in kPa is calculated using the equation:
where Vs (m/s) is defined as the shear wave propagation velocity and ρ as tissue density (with an approximated value in the human body of 1 g/cm3). The ρ of blood is 1.0428 g/cm3, fat 0.9094 g/cm3, and muscle 1.0599 g/cm3.
The region of interest (ROI) can be placed anywhere, but always at a depth of <8 cm. All the measurements were performed in the supine and the right or left lateral decubitus positions while the patients were holding their breath. The probe was placed steadily with minimal compression. The mean values from ten measurements were used. The most appropriate ROI used was the center of the image, immediately below the probe, and <8 cm from the probe surface. The radiologic evaluations, including the conventional ultrasound and elastographic examinations, were performed by a single experienced radiologist. The usual examination time was 20–30 minutes. Symptoms or a history of abnormal imaging data (including cysts, stones, or hydronephrosis on conventional ultrasound) were considered exclusion criteria. Before renal SWE imaging was performed, kidneys were checked by conventional ultrasound to detect stones, cysts, hydronephrosis, or masses. Obese subjects with a renal depth of more than 8 cm from the skin surface were excluded from the study. The length and width were recorded for each right and left kidney. Cortical thickness was measured at ten locations between kidney poles of both kidneys. The cortical thickness for each kidney was calculated as the mean of ten measurements expressed in mm. The elastographic measurements of the cortical stiffness were taken at ten locations between kidney poles of both kidneys. The cortical stiffness for each kidney was calculated as the mean of ten measurements expressed in kPa.
Statistical methods
Statistical analysis was carried out using Statistical Package for the Social Sciences (SPSS) (IBM SPSS Statistics Version 21, Armonk, NY, USA) software; P<0.05 was considered to be significant. Continuous variables were reported as mean values and standard deviations, and categorical variables as frequencies and percentages. The unpaired t-test was used to compare the differences between the study groups, according to age, BMI, HbA1c, eGFR, proteinuria level, kidney length, kidney width, cortical thickness, and cortical stiffness. The Chi square test was used to compare the gender distribution between the study groups. Pearson’s correlation coefficient test was used to describe associations between cortical stiffness, age, eGFR, and cortical thickness.
Results
The study group comprised 29 patients with DKD: 14 with CKD grade 3 and 15 with CKD grade 4. Their mean eGFR was 32.0±11.6 mL/min/1.73 m2 and mean daily proteinuria level was 1.61±1.09 g/day. Characteristics of the study population are summarized in .
Table 1 Demographic and laboratory characteristics of the study population
Cortical thickness was significantly lower in patients with DKD than in healthy subjects (13.8±2.2 vs 14.8±1.6 mm; P=0.002) () and in DKD patients with CKD grade 4 than in those with grade 3 (13.0±3.5 vs 14.7±2.1 mm; P<0.001) (). Stratifying by gender, cortical thickness was lower for individuals with DKD than for healthy subjects (males: 14.0±1.3 vs 14.9±1.7 mm; P=0.002; females: 13.3±1.2 vs 14.7±1.2 cm; P=0.002). Mean values of cortical thickness were similar in males and females among the diabetic patients, as well as among the healthy subjects ().
Table 2 Conventional and shear wave elastography imaging parameters
Table 3 Shear wave elastography imaging parameters in CKD grade 3 and grade 4 due to DKD
Cortical stiffness was significantly greater in patients with DKD than in healthy subjects (23.72±14.33 vs 9.02±2.42 kPa; P<0.001) (), in DKD patients with CKD grade 4 than in those with grade 3 (30.4±16.2 vs 14.6±8.1 kPa; P<0.001) (), and in DKD patients with CKD grade 3b, than in those with CKD grade 3a (15.7±6.7 vs 11.0±4.2 kPa; P=0.03) (). Stratifying by gender, cortical stiffness was greater for individuals with DKD than for healthy subjects: (males: 24.34±17.21 vs 9.63±2.49 kPa; P<0.001; females: 22.89±9.58 vs 8.73±2.46 kPa; P<0.001) (). Mean values of cortical stiffness were similar in males and females among the diabetic patients, as well as among the healthy subjects ().
Daily proteinuria was higher in DKD patients with CKD grade 4 than in those with grade 3 (5.52±0.96 vs 1.13±0.72; P=0.001) and in DKD patients with CKD grade 3b, than in those with CKD grade 3a (1.59±0.59 vs 0.77±0.48; P<0.001) ().
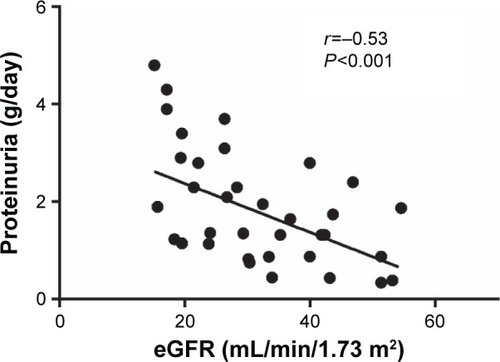
Cortical stiffness was inversely correlated with the eGFR (r=−0.65, P<0.001) () and with cortical thickness (r=−0.43, P<0.001) in patients with DKD (). Cortical stiffness was positively correlated with daily proteinuria (r=0.56, P<0.001) (). Daily proteinuria was inversely correlated with the eGFR (r=−0.53, P<0.001) ().
Figure 1 The inverse correlation between renal cortex stiffness and estimated glomerular filtration rate (eGFR).
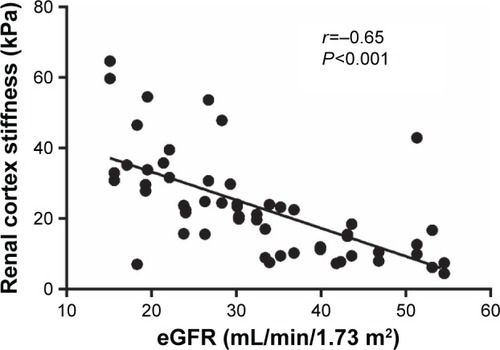
Figure 2 The inverse correlation between renal cortex stiffness and thickness.
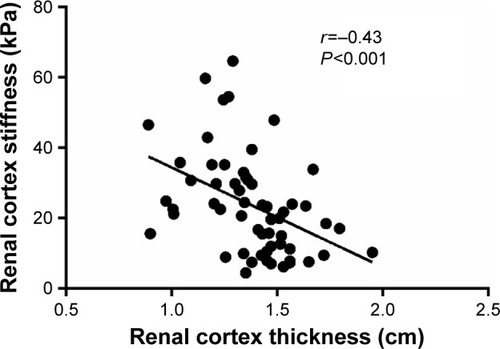
Figure 3 The positive correlation between renal cortex stiffness and daily proteinuria.
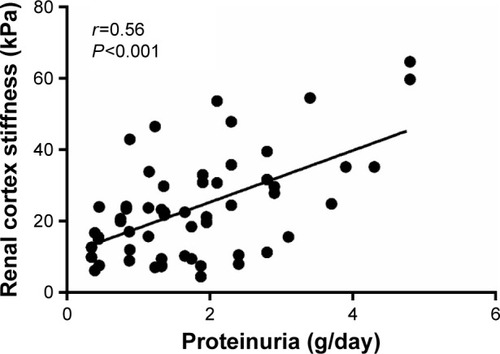
Figure 4 The inverse correlation between daily proteinuria and estimated glomerular filtration rate (eGFR).
In analysis of the total sample, no correlations were found between cortical stiffness and kidney length, kidney width, and gender. No correlation was found between cortical stiffness and cortical thickness in healthy subjects.
Discussion
Compared to healthy individuals, cortical stiffness was significantly higher and inversely correlated with the eGFR in DKD patients with CKD grades 3 and 4. Moreover, cortical stiffness was significantly higher in DKD patients with CKD grade 3b than in those with CKD grade 3a. These data suggest that SWE may be applied as a noninvasive, simple, cost effective, and reliable imaging technique that can quantitatively assess the extent of cortical fibrosis in advanced DKD, and enable differentiation between CKD grades 3a, 3b, and 4. In contrast, conventional ultrasound and other expensive imaging methods, including computerized tomography and magnetic fields, are not quantitative for the assessment of the severity of chronic morphologic changes, and not informative for differentiation between these CKD grades.
According to Kidney Disease Improving Global Outcomes (KDIGO), classification of CKD is based on the degree of decline in GFR and the presence of kidney damage markers, rather than on direct examination of kidney tissue.Citation2 These markers include abnormalities in urinary protein excretion, urine sediment, electrolyte and solutes, pathologic changes in kidney tissue obtained by biopsy, imaging abnormalities, and history of kidney transplantation. The quantitative information obtained by SWE imaging enables more accurate assessment of the chronic morphological changes associated with the progression of DKD.Citation5,Citation7–Citation11 Furthermore, SWE imaging may be used as a noninvasive, practical, and quantitative kidney damage marker, and as a tool for assigning CKD grades in DKD patients.
While only few studies have documented the use of SWE imaging in relation to native kidneys, SWE has become a useful and practical method to evaluate other organs. For example, although liver biopsy has long been the gold standard procedure for assessing the degree of chronic morphologic changes in the liver, SWE has been used to stage liver fibrosis.Citation13 Moreover, SWE imaging has been used for the evaluation of pathologic processes in several tissues, including breast, prostate, pancreas, testis, thyroid, and transplanted kidneys.Citation13–Citation18 Human native kidneys are located at a greater depth than the liver and transplanted kidneys and, therefore, assessment of their renal elasticity is more difficult.Citation14–Citation21 Consequently, the earliest studies of renal SWE imaging were performed in animals and transplanted kidneys. Animal studies on rats and rabbits showed a direct correlation between renal cortical stiffness and renal fibrotic changes, and between an increase in cortical stiffness and a decline in renal function.Citation19,Citation20 In studies of transplanted kidneys, increased renal stiffness was detected in cases of transplant rejection and in patients who developed acute deterioration in renal function.Citation21–Citation37
Of the few studies that examined the use of SWE to assess renal stiffness, and its relationship to native kidney function, four evaluated renal elasticity in CKD patients.Citation8,Citation38–Citation40 Only two studies showed that SWE imaging, using ARFI-based technology, can be used to assess renal morphologic changes in patients with DKD.Citation10,Citation11 In both studies, histological samples were lacking because renal biopsies were not performed and the diagnosis of DKD was based on the presence of albuminuria and/or reduced kidney function. One study evaluated the elasticity of renal parenchyma in different grades of DKD. The second study evaluated the elasticity of the renal parenchyma in healthy controls and in patients with DKD and different levels of proteinuria. The results of both studies suggest that SWE imaging, using ARFI-based technology, may distinguish between renal elasticity changes in DKD. The results of the present study revealed that SWE imaging can differentiate not only between CKD grades in DKD (as was shown by Goya et alCitation10) but also between CKD subgrades 3a, 3b, as was shown for the first time in the present study. Furthermore, the results showed that the cortical stiffness was inversely correlated with the eGFR and positively with the level of proteinuria which, itself, was found to be positively correlated with cortical stiffness. Thus, these data suggest that SWE imaging can be considered as an additional noninvasive and more accurate tool for the evaluation of the severity of chronic morphological changes than other imaging methods, and can contribute to better follow-up regarding the progression of DKD.
Although current treatments that focus on controlling hyperglycemia and hypertension with renin–angiotensin system inhibitors reduce the risk of progressive kidney disease, DKD remains the leading cause of ESRD.Citation41–Citation43 Metabolic abnormalities including high levels of glucose and lipids may produce glycated lipids and reactive oxygen species that lead to the production of inflammatory cytokines and profibrotic factors.Citation41–Citation43 These may incur mesangial, endothelial, and epithelial damage that ultimately results in the development of glomerulosclerosis and tubulointerstitial fibrosis that are characteristic of DKD.Citation41–Citation43 Based on these advances, novel therapeutic agents, targeting different mechanisms of DKD, are under evaluation. Renal biopsies are not practical for following the response to such agents. In contrast, renal SWE imaging may be considered a reliable and alternative method for providing additional information concerning the severity and progression of the chronic changes of DKD and the therapeutic response to the investigational therapies.
In summary, while kidney biopsy remains the gold standard for diagnosing renal chronic morphological changes, this method is an invasive and expensive procedure that requires hospitalization, and may be associated with various risks.Citation3–Citation5 Renal insufficiency predisposes to dangerous complications after renal biopsies, particularly severe bleeding.Citation4 Additionally, sometimes biopsies should be repeated periodically to monitor disease progression. Although the idea of a noninvasive method to detect the progression of CKD in the diabetic patient is tempting, the actual need for renal biopsy in diabetics is restricted to certain medical situations, such as the presence of hematuria, active sediments, heavy proteinuria, or an atypical course of DKD.Citation44 However, due to the rising number of patients with DKD worldwide, and based on the findings in the present study, SWE appears to be a simple, practical, and “virtual” method for evaluating the native kidney in patients with advanced DKD. Additionally, the findings in the present study suggest that SWE may be applied for evaluation of chronic morphological changes in DKD patients with a single kidney and those on anticoagulant therapy. However, this technology is a new tool for renal tissue characterization and further studies are needed to provide additional confirmation and validation in clinical practice.
Limitations
The present study was performed in one center and included a relatively small number of patients. The study was also limited because of the absence of real-time renal histopathologic samples of the studied population, which were not obtained due to ethical considerations. The maximum detection depth of only 8 cm limits the use of the SWE method, and the accuracy of measurements depends on the skill of the examiner.
Conclusion
In patients with advanced DKD, SWE imaging may be utilized as a simple and practical method for quantitative evaluation of the chronic morphological changes and for the differentiation between different CKD grades. Multicenter studies are needed to provide additional confirmation and validation in clinical practice.
Disclosure
The authors report no conflicts of interest in this work.
References
- GrossJLde AzevedoMJSilveiroSPCananiLHCaramoriMLZelmanovitzTDiabetic nephropathy: diagnosis, prevention, and treatmentDiabetes Care20052816417615616252
- KDOQI Clinical Practice Guidelines and Clinical Practice Recommendations for Diabetes and Chronic Kidney DiseaseAm J Kidney Dis2007492 Suppl 2S12S15417276798
- KorbetSMPercutaneous renal biopsySemin Nephrol200222325426712012311
- ChristensenJLindequistSKnudsenDUPedersenRSUltrasound-guided renal biopsy with biopsy gun technique–efficacy and complicationsActa Radiol19953632762797742122
- ChesneyDSBrouhardBHCunninghamRJSafety and cost effectiveness of pediatric percutaneous renal biopsyPediatr Nephrol19961044934958865250
- SicariRGarganiLWiecekAThe use of echocardiography in observational clinical trials: the EURECA-m registryNephrol Dial Transplant2013281192323048175
- ZaffanelloMPiacentiniGBrunoCBrugnaraMFanosVRenal elasticity quantification by acoustic radiation force impulse applied to the evaluation of kidney diseases: a reviewJ Investig Med2015634605612
- SamirAEAllegrettiASZhuQShear wave elastography in chronic kidney disease: a pilot experience in native kidneysBMC Nephrol2015116119
- SarvazyanAPRudenkoOVSwansonSDFowlkesJBEmelianovSYShear wave elasticity imaging: a new ultrasonic technology of medical diagnosticsUltrasound Med Biol19982491419143510385964
- GoyaCKilincFHamidiCAcoustic radiation force impulse imaging for evaluation of renal parenchyma elasticity in diabetic nephropathyAJR Am J Roentgenol2015204232432925615754
- YuNZhangYXuYValue of virtual touch tissue quantification in stages of diabetic kidney diseaseJ Ultrasound Med201433578779224764333
- LeveyASStevensLASchmidCHA new equation to estimate glomerular filtration rateAnn of Intern Med2009150960461219414839
- AfdhalNHFibroscan (transient elastography) for the measurement of liver fibrosisGastroenterol Hepatol (N Y)20128960560723483859
- ZhengXZJiPMaoHWA novel approach to assessing changes in prostate stiffness with age using virtual touch tissue quantificationJ Ultrasound Med201130338739021357561
- D’AnastasiMSchneevoigtBSTrottmannMAcoustic radiation force impulse imaging of the testes: a preliminary experienceClin Hemorheol Microcirc2011491–410511422214682
- BaiMDuLGuJLiFJiaXVirtual touch tissue quantification using acoustic radiation force impulse technology: initial clinical experience with solid breast massesJ Ultrasound Med201231228929422298873
- ZhangYFXuHXHeYVirtual touch tissue quantification of acoustic radiation force impulse: a new ultrasound elastic imaging in the diagnosis of thyroid nodulesPLoS One2012711e4909423152855
- SporeaIGiljaOHBotaSŞirliRPopescuALiver elastography – an updateMed Ultrason201315430431424286095
- DerieppeMDelmasYGennissonJLDetection of intrarenal microstructural changes with supersonic shear wave elastography in ratsEur Radiol201222124325021845464
- MoonSKKimSYChoJYKimSHQuantification of kidney fibrosis using ultrasonic shear wave elastography: experimental study with a rabbit modelJ Ultrasound Med201534586987725911705
- SommererCScharfMSeitzCAssessment of renal allograft fibrosis by transient elastographyTranspl Int201326554555123383606
- ArndtRSchmidtSLoddenkemperCNoninvasive evaluation of renal allograft fibrosis by transient elastography – a pilot studyTranspl Int201023987187720158692
- LeeJOhYTJooDJAcoustic Radiation Force Impulse Measurement in Renal Transplantation: A Prospective, Longitudinal Study With Protocol BiopsiesMedicine (Baltimore)20159439e159026426636
- NakaoTUshigomeHNakamuraTEvaluation of renal allograft fibrosis by transient elastography (Fibro Scan)Transplant Proc201547364064325891702
- OrlacchioAChegaiFDel GiudiceCKidney transplant: usefulness of real-time elastography (RTE) in the diagnosis of graft interstitial fibrosisUltrasound Med Biol201440112564257225218454
- GaoJRubinJMUltrasound strain zero-crossing elasticity measurement in assessment of renal allograft cortical hardness: a preliminary observationUltrasound Med Biol20144092048205725109692
- LukendaVMikolasevicIRackiSJelicIStimacDOrlicLTransient elastography: a new noninvasive diagnostic tool for assessment of chronic allograft nephropathyInt Urol Nephrol20144671435144024966148
- HeWYJinYJWangWPLiCLJiZBYangCTissue elasticity quantification by acoustic radiation force impulse for the assessment of renal allograft functionUltrasound Med Biol201440232232924315391
- GaoJMinRHamiltonJCorticomedullary strain ratio: a quantitative marker for assessment of renal allograft cortical fibrosisJ Ultrasound Med201332101769177524065258
- KahnJSlowinskiTThomasAFilimonowSFischerTTSI ultrasound elastography for the diagnosis of chronic allograft nephropathy in kidney transplanted patientsJ Ultrason2013135425326226674928
- GaoJWeitzelWRubinJMRenal transplant elasticity ultrasound imaging: correlation between normalized strain and renal cortical fibrosisUltrasound Med Biol20133991536154223849389
- SyversveenTMidtvedtKBerstadAEBrabrandKStromEHAbildgaardATissue elasticity estimated by acoustic radiation force impulse quantification depends on the applied transducer force: an experimental study in kidney transplant patientsEur Radiol201222102130213722610533
- GrenierNPoulainSLepreuxSQuantitative elastography of renal transplants using supersonic shear imaging: a pilot studyEur Radiol201222102138214622588518
- LeeCUGlocknerJFGlaserKJMR elastography in renal transplant patients and correlation with renal allograft biopsy: a feasibility studyAcad Radiol201219783484122503893
- StockKFKleinBSCongMTARFI-based tissue elasticity quantification and kidney graft dysfunction: first clinical experiencesClin Hemorheol Microcirc2011491–452753522214724
- StockKFKleinBSVo CongMTARFI-based tissue elasticity quantification in comparison to histology for the diagnosis of renal transplant fibrosisClin Hemorheol Microcirc2010462–313914821135489
- SyversveenTBrabrandKMidtvedtKAssessment of renal allograft fibrosis by acoustic radiation force impulse quantification–a pilot studyTranspl Int201124110010520819192
- HuQWangXYHeHGWeiHMKangLKQinGCAcoustic radiation force impulse imaging for non-invasive assessment of renal histopathology in chronic kidney diseasePLoS One2014912e11505125546304
- GrenierNGennissonJLCornelisFLe BrasYCouziLRenal ultrasound elastographyDiagn Interv Imaging201394554555023567180
- MenzilciogluMSDuymusMCitilSStrain wave elastography for evaluation of renal parenchyma in chronic kidney diseaseBr J Radiol20158810502014071425806412
- AroraMKSinghUKMolecular mechanisms in the pathogenesis of diabetic nephropathy: an updateVascul Pharmacol201358425927123313806
- VinodPBPathophysiology of diabetic nephropathyClin Queries: Nephrology201212121126
- SunYMSuYLiJWangLFRecent advances in understanding the biochemical and molecular mechanism of diabetic nephropathyBiochem Biophys Res Commun2013433435936123541575
- RitzEClinical manifestations and natural history of diabetic kidney diseaseMed Clin N Am2013971192923290727