
Abstract
Background
The aim of this study was to evaluate the changes in biomarkers of skeletal muscle proteolysis (atrogin-1, muscle RING finger-1 protein [MuRF-1]) and inflammation (nuclear factor kappa-B) in skeletal muscles of rats under two catabolic conditions, diabetes mellitus (DM) and acute joint inflammation, and the effects of insulin therapy.
Materials and methods
Male Wistar rats were divided into groups without diabetes – normal (N), saline (NS), or ι-carrageenan (NCa) injection into the tibiotarsal joint – and groups with diabetes – diabetes (D), plus insulin (DI), saline (DS), or ι-carrageenan (DCa) injection into the tibiotarsal joint, or ι-carrageenan injection and treatment with insulin (DCaI). Three days after ι-carrageenan injection (17 days after diabetes induction), tibialis anterior (TA) and soleus (SO) skeletal muscles were used for analysis.
Results
DM alone caused a significant decrease in the mass of TA and SO muscles, even with low levels of atrogenes (atrogin-1, MuRF-1), which could be interpreted as an adaptive mechanism to spare muscle proteins under this catabolic condition. The loss of muscle mass was exacerbated when ι-carrageenan was administered in the joints of diabetic rats, in association with increased expression of atrogin-1, MuRF-1, and nuclear factor kappa-B. Treatment with insulin prevented the increase in atrogin-1 (TA, SO) and the loss of muscle mass (SO) in diabetic-carrageenan rats; in comparison with TA, SO muscle was more responsive to the anabolic actions of insulin.
Conclusion
Acute joint inflammation overcame the adaptive mechanism in diabetic rats to prevent excessive loss of muscle mass, worsening the catabolic state. The treatment of diabetic-carrageenan rats with insulin prevented the loss of skeletal muscle mass mainly via atrogin-1 inhibition. Under the condition of DM and inflammation, muscles with the prevalence of slow-twitch, type 1 fibers were more responsive to insulin treatment, recovering the ability to grow.
Introduction
Diabetes mellitus (DM) is a chronic metabolic disease that appears as a consequence of the deficiency in insulin production by pancreatic beta cells and/or increased insulin resistance in target tissues. Persistent hyperglycemia is the main symptom of the disease; however, other symptoms related to metabolic disturbances such as polydipsia, polyuria, polyphagia, weight loss, dyslipidemia, glycosuria, and proteinuria are also observed. Type 1 DM results from the autoimmune destruction of pancreatic beta cells, leading to an absolute deficiency of insulin production; whereas, type 2 DM is characterized by varying degrees of tissue insulin resistance and a relative insulin deficiency due to pancreatic dysfunction.Citation1 DM is one of the most important public health problems worldwide, and ~415 million people are currently living with DM.Citation2
Skeletal muscle atrophy is a long-term complication frequently associated with DM, which is characterized by a decrease in muscular protein content, fiber diameter, muscle mass, force production, and fatigue resistance.Citation3 Increased proteolysis has been considered to be a major determinant of muscle atrophy in various catabolic states, leading to muscle weakness, inactivity, and increased mortality. Two genes are systematically overexpressed under various conditions of muscle atrophy, including DM, and are responsible for increased muscle proteolysis: muscle atrophy F-box protein (MAFbx, also called atrogin-1) and muscle RING finger-1 protein (MuRF-1). These two so-called atrogenes encode muscle-specific E3-ubiquitin ligases that play an important role in the ubiquitin proteasome system (UPS), since these enzymes target proteins that will be degraded by the 26S proteasome.Citation4,Citation5 Skeletal muscle atrophy in diabetes has also been associated with nuclear factor kappa-B (NF-κB)-mediated inflammatory conditions. Hyperglycemia-induced inflammation appears to require the activation of NF-κB.Citation6 Furthermore, MuRF-1 expression can be increased by NF-κB, inducing muscle atrophy.Citation7 Thus, NF-κB can be considered as a good marker for investigating muscle atrophy in a DM model with joint inflammation.
Besides muscle atrophy, individuals with type 1 or 2 DM are susceptible to the development of other musculoskeletal disorders that are frequently related to rheumatic conditions, mainly affecting the ankle, foot, and hand joints.Citation8,Citation9 Various joint illnesses in which inflammation is a common feature, such as rheumatoid arthritis, osteoarthritis, and ligament and meniscus injuries, show morphological and functional impairments in skeletal muscles.Citation10,Citation11 However, there have been fewer studies attempting to understand the pathophysiological basis of the musculoskeletal complications related to rheumatic manifestations in insulin-deficient or insulin-resistant states, most of which focused on epidemiological data.Citation12,Citation13
The aim of this study was to evaluate the changes caused by acute tibiotarsal joint inflammation 1) in the physiological and biochemical profiles of tibialis anterior (TA) and soleus (SO) skeletal muscles and 2) in the expression of genes related to muscle atrophy (atrogin-1 and MuRF-1) and NF-κB, in diabetic rats (induced by streptozotocin [STZ]). The effects of insulin therapy in these animals were also investigated.
Materials and methods
Animal care and experimental groups
This study was conducted in accordance with the National Guide for Care and Use of Laboratory Animals (Conselho Nacional de Controle de Experimentação Animal [CONCEA]) and with the approval by the Committee for Ethics in Animal Experimentation from the School of Pharmaceutical Sciences, UNESP, Araraquara, São Paulo (protocol number 31/2009).
Male Wistar rats (140–160 g, 6 weeks) were maintained under environmentally controlled conditions of temperature (23°C±1°C) and humidity (55%±5%) under a 12-h light/dark cycle, with free access to standard chow diet and water. The animals were randomly divided into eight groups (n=6): normal rats (rats without diabetes) that received intraperitoneal injection of citrate buffer (N); normal rats injected with saline (NS) or ι-carrageenan (NCa) into the tibiotarsal joint; diabetic rats that received intraperitoneal injection of STZ (D); diabetic rats treated with insulin (DI); diabetic rats injected with saline (DS) or with ι-carrageenan (DCa) into the tibiotarsal joint; and diabetic rats injected with ι-carrageenan into the tibiotarsal joint and treated with insulin (DCaI). Animals without any experimental intervention were also studied, and they did not differ from the N group (data not shown); thus, N rats were considered as the control group.
DM induction and insulin therapy
Experimental DM was induced by a single intraperitoneal injection of 50 mg/kg STZ (Sigma Aldrich, St Louis, MO, USA) dissolved in 0.01 M citrate buffer (pH 4.5).Citation14 Normal rats (rats without diabetes) received an intraperitoneal injection of citrate buffer. The diabetes induction was confirmed 3 days after the STZ injection by measuring the glucose levels;Citation15 diabetic rats showing glycemia values of ~500 mg/dL were used in the experiments. Diabetic rats treated with insulin (4 days after STZ) received subcutaneous injections of NPH insulin (Eli Lilly Co, Indianapolis, IN, USA), 2.5 U/rat for each injection (08:00 h and 17:00 h), totaling 5 U/day, for a period of 13 days (ie, 17 days after STZ).
Joint inflammation procedure
An inflammatory state was induced in the right tibiotarsal joint of rats from NCa, DCa, and DCaI groups (14 days after STZ), with a single injection (0.03 mL) of 3% ι-carrageenan (Sigma Aldrich) in saline solution (0.9% NaCl). The animals were anesthetized with an intraperitoneal injection of 12 mg/kg xylazine plus 95 mg/kg ketamine before the ι-carrageenan or saline administration. After a 26-gage needle entered the joint space, ι-carrageenan (NCa, DCa, and DCaI) or saline (NS and DS) was injected as previously described.Citation16 The animals were assessed 3 days after ι-carrageenan or saline administration (17 days after STZ).
Foot pad volume assessment
The foot volume was assessed by volumetry, based on the Archimedes principle. A glass container was previously assessed to ensure the reproducibility of the volume measures by intraclass correlation (ICC =0.93). The glass container used was particularly made for the animal paw size (5 cm high and 4 cm diameter). To standardize the measurements, a mark was placed on the side of the ankle of the rats, 1 cm from the base of the heel. The animal was then suspended using a device similar to that used by Dolan et al.Citation17 The container was filled with water to capacity, and the excess water was allowed to flow to stabilize. Next, the animal’s foot was placed into the container, up to the mark on the ankle. The displaced water was collected and measured, considering that 1 mL =1 g. Measurements were made before (day 0) and 3 days after ι-carrageenan or saline injection.
Skeletal muscle evaluations
The skeletal muscles TA (typical fast-twitch muscle, prevailing type 2B, glycolytic fibers) and SO (typical slow-twitch muscle, prevailing type 1, oxidative fibers) were carefully dissected and removed 3 days after ι-carrageenan or saline injection into the tibiotarsal joint. The muscles were weighed and immediately frozen in liquid nitrogen and stored at −80°C (Thermo Fisher Scientific, Waltham, MA, USA). Skeletal muscles were used for the following analyses: histological analysis (TA), analysis of mRNA expression of atrogenes and NF-κB (TA and SO), and creatine kinase (CK) activity (TA and SO). After muscle removal, animals were euthanized with an overdose of anesthesia.
Muscle fiber cross-sectional area (CSA) analysis
Morphological analysis was performed according to Pinheiro-Dardis et al.Citation18 Histological cross-sections (10 µm) were obtained with a cryostat microtome (Micron HE 505, Jena, Germany) through the middle belly of the TA muscle. Unfortunately, considering that the SO muscle is very small in size in comparison with TA, there was no sufficient SO sample to perform muscle fiber CSA analysis. Muscle sections were obtained using toluidine blue/1% borax and analyzed by light microscopy (Axiolab, Carl Zeiss, Oberkochen, Germany) to evaluate the general muscle morphology. One histological cross-section of each TA muscle located in the central region, with contiguous muscle fibers, was chosen to measure the muscle fiber CSA. One image from this area was taken at 20× magnification; the image was obtained using a light microscope equipped with a digital camera (Carl Zeiss Axio-Cam HRc). From each picture, the CSA of 100 contiguous muscle fibers in the central region was measured using AxioVision 4.7.1.0 software (Carl Zeiss). All the measurements were taken by a blinded evaluator.
For the analysis of intramuscular connective tissue, a planimetry system was used with scoring points, and quantification was done using a reticulum containing 195 straight-line intersections. The percent connective tissue density was calculated by dividing the sum of the number of coincident points in the straight-line intersections in the connective tissue (endomysium and perimysium) by the total number of points.Citation19
RNA isolation and analysis by real-time polymerase chain reaction
Samples of TA and SO muscles were homogenized, and the total RNA was isolated using TRIzol reagent (Thermo Fisher Scientific, Walther, MA, USA). The integrity of RNA was confirmed by electrophoretic analysis of the 18S and 28S ribosomal RNA, which were stained with ethidium bromide (Thermo Fisher Scientific). Reverse transcription (RT) to cDNA was performed with 1 µg of total RNA, a dNTP mixture (Promega, Madison, WI, USA) with 0.2 mmol/L each of deoxyadenosine triphosphate (dATP), deoxycytidine triphosphate (dCTP), deoxyguanosine triphosphate (dGTP) and 0.1 mol/L of deoxythymidine triphosphate (dTTP), 1 µL of oligo (dT) primer (Thermo Fisher Scientific), and 200 U of M-MLV RT enzyme (Promega). The RT mixture was sequentially incubated at 70°C for 10 min, 42°C for 60 min, and 95°C for 10 min before quick chilling on ice. RNA transcript levels were analyzed simultaneously, and the reactions were performed in duplicate in a LightCycler (Rotor Gene 3000, Corbett Research, San Francisco, CA, USA) using SYBR green fluorescent dye for detection (Applied Biosystems, Foster City, CA, USA) and 180 nM of each primer in a final volume of 50 µL. The cycling conditions for the target genes were as previously described.Citation20,Citation21 Data were analyzed using the comparative cycle threshold method described by the manufacturer. Control levels were arbitrarily set to 1. Negative controls contained RNA but no M-MLV RT. An non-template control (NTC) containing primers and SYBR green was also processed. Primers used for the amplification of the products were as follows: rat atrogin-1 (forward TACTAAGGAGCGCCATGGATACT; reverse GTT-GAATCTTCTGGATCCAGGAT); MuRF-1 (forward TGT CTGGAGGTCGTTTCCG; reverse ATGCCGGTCCA TGATCACTT); NF-κB (forwardCATTGAGGTGTATTTCACGG; reverse GGCAAGTGGCCATTGTGT TC); and GAPDH, used as an internal control (forward GATGCTGGTGCTGAGTATGTCG; reverse GTGGT GCAGGATGCATTGCTGA).
Creatine kinase activity
Muscle samples were homogenized in 0.01 M phosphate buffer, pH 7.4 at 4°C. The homogenates were centrifuged at 12,000 g for 30 min at 4°C, and the supernatants were used for the determination of CK activity. CK activity was determined using a commercial kit (Labtest Diagnostica SA, Minas Gerais, Brazil). In the presence of creatine phosphate and adenosine diphosphate, CK catalyzes ATP generation, and these ATPs are used by hexokinase for the phosphorylation of glucose to glucose-6-phosphate, which finally is oxidized to 6-phosphogluconate, with the simultaneous production of NADH, and can then be monitored at 340 nm.Citation22 Results are expressed as U/mg protein, and total muscle protein levels were determined according to Lowry modified by Hartree,Citation23 using bovine serum albumin as the standard.
Statistical analysis
Shapiro–Wilk’s and Levene’s tests were applied to evaluate the normality and homogeneity of the data, respectively. One-way analysis of variance followed by the Tukey’s test was used to compare the inter-group differences. The paired Student’s t-test was used to compare the intra-group differences between the initial and final glycemia values, body weight, and foot pad volumes. Differences were considered significant at p<0.05. Statistical analysis was performed using GraphPad InStat 3.05 (GraphPad Software, La Jolla, CA, USA).
Results
Characterization of the experimental models
The induction of DM in rats was shown to be effective because all rats with diabetes (3 days after STZ) showed glycemia levels of ~500 mg/dL. At the end of the experiment (17 days after STZ), the glycemia levels of D, DS, and DCa rats were maintained at values close to those found at the third day of diabetes, showing that neither the chronicity of diabetes nor the interventions in joints caused changes in glycemia levels. Saline or carrageenan administration in joints did not change the levels of glycemia in NS or NCa rats, respectively. Insulin treatment was effective in reducing glycemia of diabetic rats (DI and DCaI groups), maintaining plasma glucose levels at values similar to those found in normal rats ().
Table 1 Glycemia values (mg/dL), foot pad volumes (mL), body weight gain (g), and weight of TA and SO muscles (g/100 g body weight) of normal and diabetic rats before and after ι-carrageenan or saline administration
A significant increase was observed in the foot pad volume in NCa, DCa, and DCaI rats, 3 days after the carrageenan injection in joints (17 days after STZ). Only saline injected in joints did not lead to changes in foot pad volume (NS and DS). These results demonstrated that the administration of carrageenan in the tibiotarsal joint of normal or diabetic rats led to local edema ().
The body weight gain in D and DS rats was significantly lower than that in N, NS, and NCa rats, characterizing the catabolic profile as typical of an insulin-deficient state. As expected, diabetic rats treated with insulin (DI rats) recovered the ability to grow normally, with body weight gain similar to those of N rats. DCa rats showed the lowest body weight gain in comparison with the other groups, probably because of diabetes and inflammation; body weight gain in DCa rats was further decreased compared with that in D rats, and this decrease in body weight gain was prevented by the insulin treatment (DCaI rats; ).
SO and TA muscle mass
The mass of the TA muscle was significantly decreased in NCa rats when compared with N rats. All groups of diabetic rats showed low TA muscle mass in comparison with that in N rats, except for the DI group, which showed a TA mass similar to that observed in N rats, indicating that insulin treatment prevented the loss of TA muscle mass in diabetes. In comparison with all atrophied groups, DCa rats had the lower mass of TA. However, the treatment of diabetic-carrageenan rats with insulin (DCaI rats) was not able to prevent the TA mass loss, which remained lower than the values of N and DI rats ().
The mass of SO muscle was significantly decreased in rats with diabetes (D, DI, DS, DCa, DCaI) or with any intervention that distended the tibiotarsal joint capsule (NS, NCa, DS, DCa, DCaI). The treatment with insulin (DI) was not able to prevent the SO mass loss in diabetic rats, when compared with D. As observed with TA muscle, the mass of the SO muscle was further decreased in DCa rats, when compared with the loss of muscle mass of NCa and D rats. The treatment of diabetic-carrageenan rats with insulin (DCaI rats) prevented the SO mass loss observed in the DCa group, but the SO muscle mass remained lower than that of N ().
Muscle morphology and muscle fiber CSA
Atrophy of TA muscle fibers was observed in normal rats receiving saline (NS) or carrageenan (NCa) in the joint, when compared with that in N rats (). Muscle fiber atrophy was also observed in D rats, which was not prevented by insulin treatment (DI). Considering that there were no differences in muscle fiber CSA between NS and NCa rats, as well as among DS, DCa, and DCaI groups, it could be suggested that the decrease in CSA was dependent on joint capsule distension by saline or carrageenan. The treatment with insulin was notable to rectify the changes in the muscle fiber CSA of DCaI rats, in comparison with DCa (), which is in agreement with the minor loss of TA mass.
Figure 1 CSA in TA muscle of normal or diabetic rats after ι-carrageenan joint injection.
Abbreviations: CSA, cross-sectional area; TA, tibialis anterior.
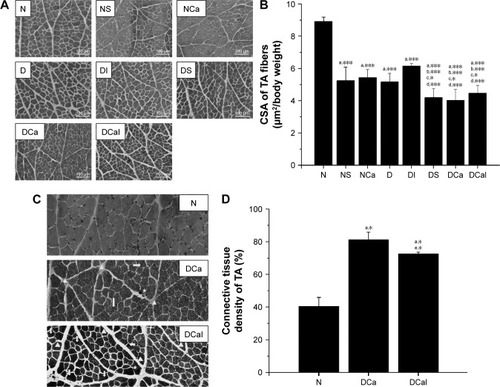
presents the qualitative morphological analysis of TA muscle from N, DCa, and DCaI rats. The muscle morphology of DCa and DCaI rats showed an increase of perimysium, degenerated muscle fibers, and central nuclei in comparison with N group. Analysis of connective tissue showed an increase in DCa and DCaI groups when compared with N group; DCa rats had a considerable gain of connective tissue when compared with other groups ().
Expression of atrogenes and NF-κB in TA
All interventions that distended the tibiotarsal joint capsule (NS, NCa, DS, DCa) increased the expression of atrogin-1 () and MuRF-1 () in TA, with the exception of MuRF-1 in DS, in comparison with N. The expression of atrogin-1 and MuRF-1 was not changed in D and DI rats when compared with that in N. However, the expression of both atrogenes was further increased in TA of DCa rats in comparison with D. Treatment with insulin prevented the increase in the expression of atrogin-1 () in TA of DCaI rats, but not of MuRF-1 (), when compared with DCa.
Figure 2 Expression of atrogenes and NF-κB in TA muscle of normal or diabetic rats after ι-carrageenan injection in the joint.
Abbreviations: MuRF-1, muscle RING finger-1 protein; NF-κB, nuclear factor kappa-B; TA, tibialis anterior.
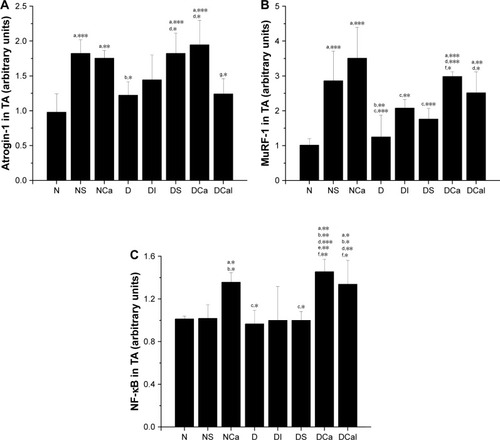
The expression of NF-κB was not changed in the TA muscle of diabetic rats (D, DI, DS), but was significantly increased in diabetic rats injected with carrageenan (DCa and DCaI rats) when compared with rats that did not receive carrageenan (). Similar to the response observed in DCa rats, the expression ofNF-κB was increased in TA of NCa rats, but was unchanged in NS rats, in comparison with that of N. The treatment of DCa rats (DCaI group) with insulin did not reduce the NF-κB levels, which remained similar to levels found in DCa ().
Expression of atrogenes and NF-κB in SO
Interventions that distended the joint capsule in normal rats (NS, NCa) increased the expression of atrogin-1 in SO; however, the increase found in NCa was significantly higher than that in NS (); MuRF-1 expression in SO was also significantly increased in NCa in comparison with both N and NS groups (). The expression of atrogin-1 and MuRF-1 in SO muscle did not change due to diabetes state (D, DS), or with the treatment with insulin (DI), when compared with that of N. However, as observed in TA, the expression of both atrogenes was increased in SO of diabetic-carrageenan rats (DCa rats), in comparison with D rats. Similar to TA, insulin treatment was able to inhibit the expression of atrogin-1 () in the SO of DCaI rats, but not of MuRF-1 (), when compared with DCa.
Figure 3 Expression of atrogenes and NF-κB in SO muscle of normal or diabetic rats after ι-carrageenan injection in the joint.
Abbreviations: MuRF-1, muscle RING finger-1 protein; NF-κB, nuclear factor kappa-B; SO, soleus.
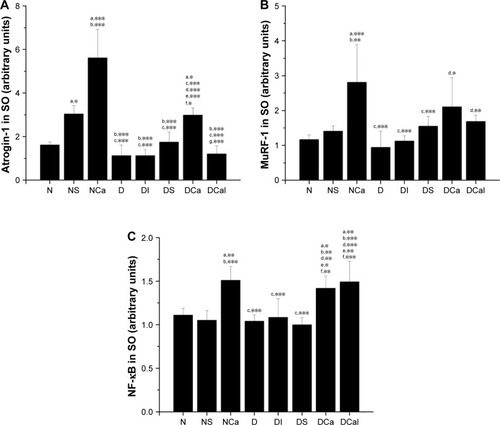
Similar to the profile observed in TA, the SO muscle of rats injected with carrageenan (NCa, DCa, DCaI) showed increased expression of NF-κB in comparison with other groups (). The NF-κB levels were not changed by insulin deficiency or by injection of saline in the joint. The increased NF-κB levels in SO muscle of diabetic-carrageenan rats were not reduced by the insulin treatment (DCaI).
CK activity in TA and SO
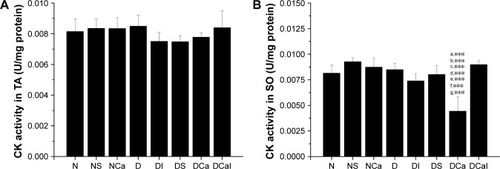
The activity of CK was not changed in TA muscle from rats of any studied group (). In SO muscle, the activity of CK was significantly decreased in diabetic rats injected with carrageenan (DCa rats) in comparison with all other groups, which was completely restored by the insulin treatment (DCaI rats; ).
Figure 4 CK activity in skeletal muscles of normal or diabetic rats after ι-carrageenan injection in the joint.
Abbreviations: CK, creatine kinase; SO, soleus; TA, tibialis anterior.
Discussion
The present study investigated the consequences of the association between two catabolic conditions, DM and acute joint inflammation, and the loss of skeletal muscle mass and its relationship with atrogene expression. Establishment of acute tibiotarsal joint inflammation caused an additional loss of mass in previously atrophied TA and SO muscles due to insulin deficiency, which could be attributed, at least in part, to the increased expression of atrogin-1 and MuRF-1 genes that encode ubiquitin ligases, which direct protein substrates for proteasomal degradation. These changes in TA and SO muscles of diabetic-carrageenan rats were accompanied by an increase in the expression of NF-κB, a transcription factor induced during inflammatory conditions. This study also provides evidence for the beneficial effects of insulin therapy on protein metabolism of skeletal muscle, allowing diabetic rats with acute joint inflammation to preserve muscle mass and recover the ability to grow. Even in the presence of two catabolic conditions (DM and inflammation), treatment with insulin inhibited atrogin-1 expression in both muscles and also attenuated the loss of SO muscle mass. However, treatment with insulin was not able to prevent the loss of TA muscle mass in diabetic-carrageenan rats, indicating that the inflammation overcame the anabolic response of insulin in this muscle.
Although animals after 17 days of diabetes (D group) showed a decrease in the weight of both TA and SO () muscles, as well as a decreased CSA in TA muscle () in comparison with normal rats (N group), it was observed that the expression of atrogenes was similar in both muscles between N and D rats ( and ). Maintenance of reduced muscle mass even under a condition of decreased expression of atrogenes could be attributed to various factors: 1) the increased rate of proteolysis before the 17th day of diabetes, when the atrogene expression could already be increased; 2) the decreased rate of protein synthesis that could occur before and even during the 17th day of diabetes; and 3) the increased protein breakdown by other intracellular proteolytic systems that do not depend on ubiquitin ligase activity, such as lysosomal and apoptotic processes.
In the experimental models of muscle atrophy, it is common to observe the development of a biphasic pattern in protein metabolism, with an initial period of exacerbated muscle mass loss (with accelerated proteolysis and increased levels of components belonging to proteolytic systems) followed by a decreased rate of proteolysis and levels of proteolytic components. This biphasic temporal response could be interpreted as an adaptive mechanism to spare muscle proteins and to avoid the excessive loss of muscle mass under a condition of persistent catabolism. Pepato et alCitation24 also observed an increased rate of proteolysis in SO muscle of rats after 1 day of diabetes in comparison with control, normal rats; after 3 days of insulin deficiency, the rate of proteolysis reached values similar to those of controls, and after 5 and 10 days of diabetes, the proteolysis rate dropped down to below control levels; however, the muscle mass of diabetic rats remained lower than that of controls, corroborating our findings on atrogene expression. The efficacy of this compensatory mechanism can be emphasized by the finding that treatment with exogenous insulin (DI group), which is known to repress both atrogin-1 and MuRF-1 expressions, did not cause any additional inhibition in the expression of these atrogenes on the 17th day of diabetes ( and ). Ramírez et alCitation11,Citation25 have also observed an increase in atrogene expression in SO and TA muscles of rats during the initial stage (2 days) of joint inflammation or immobilization, followed by a decrease after 7 and 15 days of the catabolic stimuli.
Acute joint inflammation was able to overcome and impair the biochemical adjustments in muscle protein metabolism of diabetic rats, since the atrogene expression was increased ( and ) and the skeletal muscle mass was further decreased () in comparison with diabetic rats without joint inflammation. It is well known that prostaglandins, nitric oxide (NO), reactive oxygen species, and pro-inflammatory cytokines, such as interleukins (IL) IL-1β, IL-6, and tumor necrosis factor-alpha (TNF-α), are involved in the complex mechanism of carrageenan-induced inflammation.Citation26–Citation28 Furthermore, it has been demonstrated that some of these mediators induce muscle wasting through stimulation of atrogene expression, leading to an accelerated rate of proteolysis, with both systemicCitation29 and local muscle inflammation.Citation30,Citation31 NF-κB is the main transcription factor induced by TNF-α, which has been implicated in the development of muscle atrophy during conditions of acute inflammation, since this factor induces genes involved in skeletal muscle protein breakdown.Citation32,Citation33 In the present study, it can be observed that the NF-κB expression was increased in muscles of rats injected with carrageenan ( and ), which could explain, at least in part, the increased expression of atrogenes in TA and SO muscles of rats with diabetes and submission to acute joint inflammation.
However, even under a condition of acute inflammation, treatment with insulin was able to counteract the increase in the atrogin-1 expression promoted by the carrageenan in rats with diabetes, in both muscles ( and ), as well as to avoid the loss of SO muscle mass (). However, treatment with insulin did not inhibit the increase in MuRF-1 expression ( and ). At first glance, this was a surprising result, since a coordinated regulation of atrogin-1 and MuRF-1 expression has been commonly observed in several catabolic conditions characterized by increased muscle proteolysis.Citation34 However, in agreement with our findings, Cai et alCitation35 observed that the activation of NF-κB in gastrocnemius muscle, through transgenic overexpression of activated IκB kinase beta (IKKβ), caused profound muscle wasting in association with an increased expression of MuRF-1, without changes in atrogin-1; the authors suggested that the activation of the NF-κB/IKKβ axis participates in increasing MuRF-1 expression under conditions of muscle atrophy, and that atrogin-1 is more responsive to pathways involving FoxO (forkhead box O) transcription factors (such as insulin and IGF-1). This could be the reason why the insulin treatment was able to decrease the expression of atrogin-1, but not of MuRF-1, in muscles of diabetic-carrageenan rats. Finally, it must be highlighted that, in diabetic-carrageenan rats, the responsiveness of SO muscle to the insulin treatment was more evident in comparison with that of TA muscle. It is well known that muscles predominating in type 1, oxidative fibers, are more responsive to insulin, showing high levels of insulin signaling components, in comparison with muscles predominating in type 2, glycolytic fibers.Citation36
The TWEAK–Fn14 system has been proposed to induce muscle atrophy under disease or disuse conditions. TWEAK (tumor necrosis factor-like weak inducer of apoptosis) is a member of the TNF superfamily of cytokines, and Fn14 (fibroblast growth factor-inducible 14) is a type I transmembrane protein acting as TWEAK receptor. It has been observed that TWEAK–Fn14 leads to muscle wasting through activation of NF-κB and enhancing the expression of UPS components.Citation37 Further studies should be performed to verify whether TWEAK–Fn14 is upregulated by inflammation in muscles of diabetic rats.
Saline administration into the tibiotarsal joint led to impairments in skeletal muscle physiology, in both normal and diabetic rats. Increased expression of atrogin-1 (TA, SO) and MuRF-1 (TA) ( and ) and decrease in both muscle fiber CSA (TA, ) and muscle mass (SO, ) were found in NS rats, as compared to N rats. The impact of saline administration in the joints of diabetic rats was modest, causing an increase in atrogin-1 expression in TA () of DS rats in comparison with D rats. Saline injection did not cause an inflammatory response in the joints of rats,Citation25,Citation38 and NF-κB was not changed in TA () or SO () of NS or DS rats. There is evidence to support a temporary, atrophic profile of skeletal muscles surrounding a joint receiving saline or that submitted to manipulations. Ramirez et alCitation25 observed that there is a significant increase in the expression of atrogin-1 in TA muscle 2 days after saline administration into the tibiotarsal joint (sham group), without inflammation (no changes were observed in NF-κB expression). The atrogin-1 expression was restored after 7 or 15 days of the saline injection. It must be highlighted that, in the present study, we also found increases in atrogene expression in muscles that were studied 3 days after saline administration, that is, a period similar to that of Ramirez study. Similarly, in a study by Delfino et al,Citation39 sham rats of a procedure of anterior cruciate ligament (ACL) transection (ie, ACL identification, without transection) had increased the levels of atrogin-1 and MuRF-1 in quadriceps muscles, as well as a reduction in both fiber CSA and muscle mass, 2 and 3 days after joint manipulation. However, it must be emphasized that both the CSA and muscle mass of sham rats were restored after prolonged periods of investigation, unlike those of the ACL transection group. These changes may be explained by arthrogenic muscle inhibition (AMI) due to joint infusion/manipulation. AMI is a reflex reaction of the musculature that surrounds a distended or damaged joint and is characterized by functional ankle instability,Citation40 which has been associated with weakness of the surrounding muscles, favoring muscle atrophy. Unfortunately, in the present study, temporal changes in skeletal muscles after interventions (saline, carrageenan) in joints in normal or diabetic rats were not monitored. However, considering these previous findings in sham rats,Citation25,Citation39 it could be suggested that the atrophic profiles observed in muscles of NS and DS rats are acute and reversible. Nonetheless, it must be highlighted that intra-articular interventions in rehabilitation approaches for rheumatic or musculoskeletal disorders should be made with caution and well accompanied, since the manipulation/distention of the joint capsule itself can alter the normal pattern of the surrounding skeletal muscles.Citation25
Disuse is frequently associated with skeletal muscle atrophy, mainly accompanied by overexpression of atrogin-1 and increased activity of UPS.Citation41 Furthermore, the contribution of disuse in the loss of mass observed in SO of normal or diabetic rats submitted to acute joint inflammation cannot be ignored, considering that these rats presented impairment in body sustenance in the injected pad, probably due to hyperalgesia; inflammatory pain is developed after carrageenan administration in joints.Citation26 Finally, it must be highlighted that the magnitude of the increase in the expression of atrogenes in muscles of rats injected with carrageenan was, sometimes, much higher than that in saline-injected rats (see MuRF-1 expression in TA, DCa vs DS, ; atrogin-1 expression in SO, NCa vs NS; DCa vs DS, ), which may represent an additional catabolic action between disuse (by ankle distention and instability) and inflammation (promoted by carrageenan).
CK activity was strongly decreased () in SO of diabetic rats with acute joint inflammation. Besides the increase in serum CK levels being used as a marker of muscle damage, a reduction in CK activity in muscle tissues has also been used as a criterion for muscle damage due to diseases and atrophies.Citation42 Several conditions leading to muscle atrophy are related to low CK muscle levels, including disuse due to immobilization,Citation43 chronic DM,Citation44 and inflammatory myopathies associated with NF-κB activation.Citation45 In view of the disuse condition in SO of DCa rats (due to the characteristic pain induced by the inflammatory process), it could be suggested that the “temporal energy buffering” requirements are diminished in this muscle, explaining the decrease in CK activity; however, the drop in CK activity can also be a consequence of the significant loss of SO muscle mass (due to both inflammation and DM). Furthermore, the decrease in CK activity in skeletal muscle has been also attributed to post-translational modifications, mainly carbonylation. CK carbonylation in muscle results in decreased activity, as well as causing the formation of insoluble CK aggregates.Citation46 CK carbonylation is often associated with conditions of oxidative stress; this hypothesis may explain the loss of CK activity in SO but not in TA, since SO has predominant oxidative metabolism. Increased levels of carbonylated CK have been observed in skeletal muscles during the following conditions, which also lead to muscle atrophy: cachexia due to cancer,Citation47 chronic obstructive pulmonary disease,Citation48 sepsis,Citation49 and DM.Citation50 Finally, according to our findings, in addition to preserving SO muscle mass (), insulin therapy was also able to maintain muscle functionality, since the CK activity was preserved in SO of DCaI rats (). Corroborating our findings, Su et alCitation44 observed that the decrease in CK expression in SO muscle of STZ-diabetic rats (4 weeks of DM) was reversible by the treatment with insulin.
Conclusion
In rats with DM, acute joint inflammation resulted in an increase in the expression of both atrogin-1 and MuRF-1 in skeletal muscles, leading to further muscle mass loss. The acute joint inflammation, via NF-κB activation, overcame the adaptive biochemical adjustments that usually prevent excessive loss of muscle mass under conditions of continued insulin deficiency.
In addition, data from this study show the benefits of insulin therapy in preserving the skeletal muscle mass of diabetic rats with acute joint inflammation. It is interesting to note that, according to the fiber type predominating in skeletal muscle and its functions, the responsiveness changed following the insulin treatment: SO muscle, predominating in type 1, oxidative fibers and having a postural function, was more sensitive to insulin in comparison with TA muscle, prevailing type 2B, glycolytic fibers, not being a postural muscle. Therefore, SO muscle of diabetic-carrageenan rats treated with insulin recovered the ability to grow, probably due to its role in the maintenance of postural work and body sustenance; furthermore, the insulin effects on preserving SO muscle mass could be related to the blunting of the mRNA levels of atrogin-1. It must be emphasized that insulin therapy also preserved the CK activity in SO of diabetic-carrageenan rats, maintaining its functionality in relation to energy supply.
Taken together, these findings could be relevant to clinical and rehabilitation sciences, since applications could generate new information regarding the muscle adaptations in individuals with DM, allowing the development and improvement of different therapeutic strategies for diabetic individuals with rheumatic diseases. It has been observed that poor diabetic control is associated with failure in a therapeutic intervention (intrasheath triamcinolone injection) for flexor tenosynovitis.Citation51 Therefore, apart from glycemia management, insulin therapy could provide several other benefits, including anabolic effects on the protein metabolism of skeletal muscles, improving their responsiveness to interventions to ameliorate musculoskeletal disorders related to rheumatic manifestations in diabetes.
Acknowledgments
This work was supported by grants from Fundação de Amparo à Pesquisa do Estado de São Paulo (FAPESP 2010/00892–0), Conselho Nacional de Desenvolvimento Científico e Tecnológico (CNPq), Fundaçãopara o Desenvolvimento da UNESP (FUNDUNESP), and the Scientific Support and Development Program of School of Pharmaceutical Sciences of UNESP (PADC/FCFAr, UNESP).
Disclosure
The authors report no conflicts of interest in this work.
References
- American Diabetes AssociationDiagnosis and classification of diabetes mellitusDiab Care200932Suppl 1S62S67
- International Diabetes FederationThe global burden. IDF Diabetes Atlas [serial on the Internet]7th edBelgium20151144 Available from: http://www.idf.org/diabetesatlasAccessed May 02, 2017
- JackmanRWKandarianSCThe molecular basis of skeletal muscle atrophyAm J Physiol Cell Physiol20042874C834C84315355854
- GomesMDLeckerSHJagoeRTNavonAGoldbergALAtrogin-1, a muscle-specific F-box protein highly expressed during muscle atrophyProc Natl Acad Sci U S A20019825144401444511717410
- BodineSCBaehrLMSkeletal muscle atrophy and the E3 ubiquitin ligases MuRF1 and MAFbx/atrogin-1Am J Physiol Endocrinol Metab20143076E469E48425096180
- FrierBCNobleEGLockeMDiabetes-induced atrophy is associated with a muscle-specific alteration in NF-kappaB activation and expressionCell Stress Chaperones200813328729618633731
- GlassDJSkeletal muscle hypertrophy and atrophy signaling pathwaysInt J Biochem Cell Biol200537101974198416087388
- ArkkilaPEGautierJFMusculoskeletal disorders in diabetes mellitus: an updateBest Pract Res Clin Rheumatol200317694597015123045
- SmithLLBurnetSPMcNeilJDMusculoskeletal manifestations of diabetes mellitusBr J Sports Med2003371303512547740
- SuettaCAagaardPMagnussonSPMuscle size, neuromuscular activation, and rapid force characteristics in elderly men and women: effects of unilateral long-term disuse due to hip-osteoarthritisJ Appl Physiol (1985)2007102394294817122381
- RamírezCRussoTLDelfinoGPevianiSMAlcântaraCSalviniTFEffect of tibiotarsal joint inflammation on gene expression and cross-sectional area in rat soleus muscleBraz J Phys Ther201317324425423802230
- Lebiedz-OdrobinaDKayJRheumatic manifestations of diabetes mellitusRheum Dis Clin North Am201036468169921092846
- RaySDattaAKSinhamahapatraPRayIMukhopadhyayPDasguptaSPrevalence of rheumatic conditions in patients with diabetes mellitus in a tertiary care hospitalJ Indian Med Assoc20111092747821888166
- DelfinoVDFiqueiredoJFMatsuoTFaveroMEMatniAMMocelinAJStreptozotocin-induced diabetes mellitus: long-term comparison of two drug administration routesJ Bras Nefrol20022413136
- TrinderPDetermination of blood glucose using 4-amino phenazone as oxygen acceptorJ Clin Pathol1969222246
- WangYHuangCCaoYHanJSRepeated administration of low dose ketamine for the treatment of monoarthritic pain in the ratLife Sci200067326126710983870
- DolanMGMychaskiwAMMendelFCCool-water immersion and high-voltage electric stimulation curb edema formation in ratsJ Athl Train200338322523014608432
- Pinheiro-DardisCMErbereliBTGigo-BenatoDCastroPARussoTLElectrical stimulation delays reinnervation in denervated rat muscleMuscle Nerve2017566E108E11828120411
- FaturiFMFrancoRCGigo-BenatoDIntermittent stretching induces fibrosis in denervated rat muscleMuscle Nerve201653111812625960249
- PevianiSMGomesARMoreiraRFMoriscotASSalviniTFShort bouts of stretching increase myo-D, myostatin and atrogin-1 in rat soleus muscleMuscle Nerve200735336337017143883
- RussoTLPevianiSMDuriganJLGigo-BenatoDDelfinoGBSalviniTFStretching and electrical stimulation reduce the accumulation of MyoD, myostatin and atrogin-1 in denervated rat skeletal muscleJ Muscle Res Cell Motil2010311455720191313
- OliverITA spectrophotometric method for the determination of creatine phosphokinase and myokinaseBiochem J195561111612213260184
- HartreeEFDetermination of protein: a modification of the Lowry method that gives a linear photometric responseAnal Biochem19724824224274115981
- PepatoMTMiglioriniRHGoldbergALKettelhutICRole of different proteolytic pathways in degradation of muscle protein from streptozotocin-diabetic ratsAm J Physiol19962712 Pt 1E340E3478770029
- RamírezCRussoTLSandovalMCJoint inflammation alters gene and protein expression and leads to atrophy in the tibialis anterior muscle in ratsAm J Phys Med Rehabil2011901193093921959222
- CunhaFQPooleSLorenzettiBBFerreiraSHThe pivotal role of tumor necrosis factor alpha in the development of inflammatory hyperalgesiaBr J Pharmacol199210736606641472964
- ChouTCChangLPLiCYWongCSYangSPThe antiinflammatory and analgesic effects of baicalin in carrageenan-evoked thermal hyperalgesiaAnesth Analg20039761724172914633550
- KeebleJEBodkinJVLiangLHydrogen peroxide is a novel mediator of inflammatory hyperalgesia, acting via transient receptor potential vanilloid 1-dependent and independent mechanismsPain20091411–213514219059721
- FrostRANystromGJJeffersonLSLangCHHormone, cytokine, and nutritional regulation of sepsis-induced increases in atrogin-1 and MuRF1 in skeletal muscleAm J Physiol Endocrinol Metab20072922E501E51217003238
- BicerSReiserPJChingSQuanNInduction of muscle weakness by local inflammation: an experimental animal modelInflamm Res200958417518319205846
- PinnigerGJLavinTBakkerAJSkeletal muscle weakness caused by carrageenan-induced inflammationMuscle Nerve201246341342022907233
- HunterRBStevensonEKoncarevicAMitchell-FeltonHEssigDAKandarianSCActivation of an alternative NF-kappaB pathway in skeletal muscle during disuse atrophyFASEB J200216652953811919155
- SchakmanODehouxMBouchuariSRole of IGF-I and the TNFα/NF-κB pathway in the induction of muscle atrogenes by acute inflammationAm J Physiol Endocrinol Metab20123036E729E73922739109
- FolettaVCWhiteLJLarsenAELégerBRussellAPThe role and regulation of MAFbx/atrogin-1 and MuRF1 in skeletal muscle atrophyPflugers Arch2011461332533521221630
- CaiDFrantzJDTawaNEJrIKKbeta/NF-kappaB activation causes severe muscle wasting in miceCell2004119228529815479644
- SongXMRyderJWKawanoYChibalinAVKrookAZierathJRMuscle fiber type specificity in insulin signal transductionAm J Physiol19992776 Pt 2R1690R169610600915
- BhatnagarSKumarAThe TWEAK-Fn14 system: breaking the silence of cytokine-induced skeletal muscle wastingCurr Mol Med201212131322082477
- SaricaogluFDalDAtillaPEffect of intraarticular injection of lornoxicam on the articular cartilage & synovium in ratIndian J Med Res2008127436236518577790
- DelfinoGBPevianiSMDuriganJLQuadriceps muscle atrophy after anterior cruciate ligament transection involves increased mRNA levels of atrogin-1, muscle ring finger 1, and myostatinAm J Phys Med Rehabil201392541141922854904
- PalmieriRMIngersollCDHoffmanMAArthrogenic muscle response to a simulated ankle joint effusionBr J Sports Med2004381263014751941
- SacheckJMHyattJPRaffaelloARapid disuse and denervation atrophy involve transcriptional changes similar to those of muscle wasting during systemic diseasesFASEB J200721114015517116744
- SuttonSCEvansLARinaldiMTNortonKAPredicting injection site muscle damage. II: evaluation of extended release parenteral formulations in animal modelsPharm Res19961310151415188899843
- St-AmandJOkamuraKMatsumotoKShimizuSSogawaYCharacterization of control and immobilized skeletal muscle: an overview from genetic engineeringFASEB J200115368469211259386
- SuCYPayneMStraussAWDillmannWHSelective reduction of creatine kinase subunit mRNAs in striated muscle of diabetic ratsAm J Physiol19922632 Pt 1E310E3161514612
- WangHHertleinEBakkarNNF-kappaB regulation of YY1 inhibits skeletal myogenesis through transcriptional silencing of myofibrillar genesMol Cell Biol200727124374438717438126
- FrohnertBIBernlohrDAProtein carbonylation, mitochondrial dysfunction, and insulin resistanceAdv Nutr20134215716323493532
- Marin-CorralJFontesCCPascual-GuardiaSRedox balance and carbonylated proteins in limb and heart muscles of cachectic ratsAntioxid Redox Signal201012336538019737087
- BarreiroEGeaJMatarGHussainSNExpression and carbonylation of creatine kinase in the quadriceps femoris muscles of patients with chronic obstructive pulmonary diseaseAm J Respir Cell Mol Biol200533663664216166745
- BarreiroEHussainSNProtein carbonylation in skeletal muscles: impact on functionAntioxid Redox Signal201012341742919686036
- AragnoMMastrocolaRCatalanoMGBrignardelloEDanniOBoccuzziGOxidative stress impairs skeletal muscle repair in diabetic ratsDiabetes20045341082108815047625
- KameyamaMFunaeOMeguroSAtsumiYHbA1c values determine the outcome of intrasheath injection of triamcinolone for diabetic flexor tenosynovitisDiabetes Care200629112512251417065695