
Abstract
Background and aims
Serum amylase is a traditional measure used to establish the diagnosis of acute pancreatitis (AP). The current study aimed to assess the predictors and clinical outcome of AP with low serum amylase.
Methods
All patients were divided into two groups, based on their serum amylase level within the first 2 days after hospital admission: group 1 (amylase ≥300 U/L) and group 2 (amylase <300 U/L). Clinical outcomes were compared between the two groups before and after 1:1 propensity score matching. Clinical and biochemical parameters were collected and evaluated as potential predictors of AP with low serum amylase.
Results
A total of 464 patients were enrolled. After propensity score matching according to age, gender, time interval before admission, hematocrit, blood urea nitrogen and creatinine, 108 matched pairs of patients were selected. There was no significant statistical difference between group 2 and group 1 with respect to severity of AP, median days of stay in hospital and death. Multivariate analysis indicated that biliary etiology (odds ratio [OR]: 0.499; 95% confidence interval [CI]: 0.265–0.942; P=0.003), low-density lipoprotein cholesterol (LDL-C) (OR: 1.009; 95% CI: 1.002–1.017; P=0.017) and triglyceride levels (OR: 1.001; 95% CI: 1.0001–1.001; P=0.015) were independently associated with development of AP along with low serum amylase.
Conclusion
Serum amylase level was not related to the severity of AP, median hospital stay (days) and death. Biliary etiology, LDL-C and triglyceride levels were independently associated with the development of AP with lower elevation of serum amylase.
Introduction
Acute pancreatitis (AP) is one of the most common inflammatory diseases of the gastrointestinal tract, with an increasing incidence in recent years.Citation1 Though most patients with AP have a benign clinical course, approximately 10%–20% of patients develop severe AP with significant mortality of at least 30%.Citation2,Citation3 Disturbance of pancreatic blood flow, pancreatic ischemia and activated coagulation plays an important role in the development of AP as well as in the progression of the disease to severe necrotizing pancreatitis.Citation4–Citation6 Recent studies have demonstrated that serum total bile acid, serum neutrophil gelatinase-associated lipocalin and serum soluble Fms-like tyrosine kinase 1 might play a role in prediction of severity of AP.Citation7–Citation9
A study published two decades ago suggested that there is no association between amylase levels and severity, cause or outcome of the AP.Citation10 There have been important changes in the definition and classification of AP since the Atlanta classification from 1992.Citation11 Recent revised Atlanta classification identified that persistent organ failure is the key determinant of severity.Citation11 It may be classified as mild, moderate severe and severe AP according to the severity of diseases. Therefore, one may concern that whether there is association between serum amylase levels and severity of AP, when it is defined by the revised Atlanta classification (classified as mild, moderate severe and severe AP).Citation11
The diagnosis of AP is most often established by the presence of two of the three following criteria:Citation1,Citation11 (i) abdominal pain, (ii) serum lipase or amylase greater than three times the upper limit of normal, and (iii) characteristic findings from abdominal imaging. Therefore, estimation of serum amylase and lipase levels remains the cornerstone in the diagnosis of AP.Citation12
In AP, the levels of amylase often increase by 6–24 hours and usually peak at 48 hours. Over the period of the next 5–7 days after onset, amylase levels typically tend to normalize.Citation13 However, amylase level may remain within the normal range on admission in as many as one-fifth of patients.Citation1 Patients with slight elevation of serum amylase – that is, less than three times the upper limit of normal level – on admission could also have or develop severe AP.Citation10 Amylase tests in these settings result in diagnostic delays or misdiagnosis, imposing additional costs on patients and the health system.Citation14 On the other hand, checking for lipase and amylase simultaneously does not result in improved diagnostic accuracy because amylase and lipase are closely correlated.Citation15 This consideration should warrant further imaging tests like computed tomography (CT) or magnetic resonance imaging of the abdomen to confirm the diagnosis. Therefore, early identification of AP with normal or a small elevation of serum amylase in the disease course might be helpful for physicians to make a timely diagnosis.
It has been noted that serum amylase concentrations may be normal in alcohol-induced AP and hypertriglyceridemia.Citation16 However, to the best of our knowledge, clinical and laboratory predictors of AP with small elevation of serum amylase have not been fully investigated.
Therefore, the current study aimed to assess the predictors and clinical outcome of AP with low amylase based on the revised Atlanta criteria.
Materials and methods
Inclusion and exclusion criteria
Patients with AP admitted to the First Affiliated Hospital of Wenzhou Medical University within 72 hours of the onset of symptoms, from 1st January 2012 to 31st December 2015, were eligible to be enrolled in the study. Exclusion criteria were previous pancreatic surgery, pancreatitis due to endoscopic retrograde cholangiopancreatography (ERCP) or trauma, chronic pancreatitis, pancreatic cancer, antilipidemic therapy, previous surgery or therapeutic ERCP during hospitalization, chronic renal disease with decreased glomerular filtration rate, previous albuminuria, hepatitis, liver cirrhosis, macroamylasemia, diseases of the salivary glands, extrapancreatic abdominal diseases such as acute appendicitis, peptic ulcer and gynecological diseases.Citation1,Citation17,Citation18
Data collection and ethics
Age, gender, body mass index (BMI), time from symptom onset to admission, and biochemical parameters including hematocrit, glucose, blood urea nitrogen (BUN) and creatinine were recorded within 12 hours of hospitalization, except for amylase levels (normal: 80–100 U/L) which were assayed on the first and second day after admission. Subjects were classified as alcohol drinkers (alcohol consumption) if they had regularly consumed any alcoholic beverage one or more times per week during the preceding 6 months.Citation19 Subjects were classified as cigarette smokers if they had smoked 10 or more cigarettes per week during the preceding 6 months.Citation19 Fatty liver was indicated based on noninvasive imaging methods including non-contrast abdominal CT and/or ultrasonography.Citation20
This study protocol was approved by the Ethics Committee of the First Affiliated Hospital of Wenzhou Medical University. This study was performed according to the principles expressed in the Declaration of Helsinki, and written informed consent was obtained from the subjects or their legal guardians.
Definition of outcome
AP was defined as previously described.Citation11,Citation21 The disease severity was stratified into mild, moderately severe and severe according to the revised Atlanta classification.Citation11 Organ failureCitation11,Citation22 was defined according to the Marshall score ≥2, meaning that at least one system (respiratory, cardiovascular, renal) must be affected. The above condition was defined as persistent with a symptomatology ≥48 hours.Citation11,Citation22 Mortality refers to death occurring from AP or its complications during hospitalization.
All patients were divided into two groups according to the highest amylase level within the first 2 days after admission: group 1 (amylase ≥300 U/L) and group 2 (amylase <300 U/L).
Statistical analysis
We used propensity score methods to account for selection bias. We used our clinical experience and knowledge to select possible confounders for their potential association with amylase levels as follows: age, gender, time interval before admission, hematocrit, BUN and creatinine. Therefore, these variables were included in a logistic regression model to derive the propensity score. When performing propensity score matching, a nearest neighbor, one-to-one pair match within 0.2 standard deviations (SDs) (caliper) of the logit of the propensity score and without replacement was used.Citation23 Absolute standardized differences (ASDs) were computed to evaluate matching effectiveness. ASDs <10% between each covariate were considered a good balance between the matched groups.Citation24 We also reported the Hosmer–Lemeshow goodness-of-fit test and c-index of propensity score model, though Ali et alCitation24 argued these tests should not be used to decide whether the propensity score model is correctly specified.
Categorical values were described by count and proportions and compared by the χ2 test before matching. Continuous values were expressed by mean ± SD or median and interquartile range, and compared using the Student’s t-test or the Mann–Whitney nonparametric test before matching. After matching, comparisons of the matched cohorts were performed using the χ2 test (McNemar test for binary data) and paired t-tests.
Multivariable logistic analysis was used to identify the potential predictors of AP with low amylase. According to the results of collinearity diagnostics, total cholesterol was not included into multivariable logistic regression because of collinearity with high-density lipoprotein cholesterol (HDL-C) and low-density lipoprotein cholesterol (LDL-C). Alcohol consumption, serum lipid and etiology (biliary vs non-biliary) were used as dichotomous variables in multivariable logistic regression. Odds ratios (ORs) were calculated with 95% confidence intervals (CIs).
Differences were assessed as being relevant when the two-tailed P-value <0.05 was reached.
Results
Baseline characteristics
Before propensity score matching, a total of 464 patients (344 patients with high amylase and 120 patients with low amylase) were enrolled (). There were 281 male and 183 females, ranging in age from 14 to 92 years (mean age of 50±17 years). Of all 464 patients, 348 (75.0%), 66 (14.2%) and 50 (10.8%) patients developed mild, moderate severe and severe AP, respectively. The mean interval between the onset and admission was 1.8±0.8 days. The predominant cause of AP was cholelithiasis (42.5%). Eight patients died during hospitalization. The mean serum amylase levels at the time of admission and 24 hours later were 1,080±1,040 and 432±447 U/L, respectively.
Table 1 Baseline characteristics and clinical outcomes of patients in the two study cohorts before matching (entire cohort)
After matching according to age, gender, time interval before admission, hematocrit, BUN and creatinine, 108 matched pairs of patients were selected. shows the demographics of the propensity score-matched patients.
Table 2 Baseline characteristics and clinical outcomes of patients in the two study cohorts after matching (matched data)
Evaluation of propensity score matching
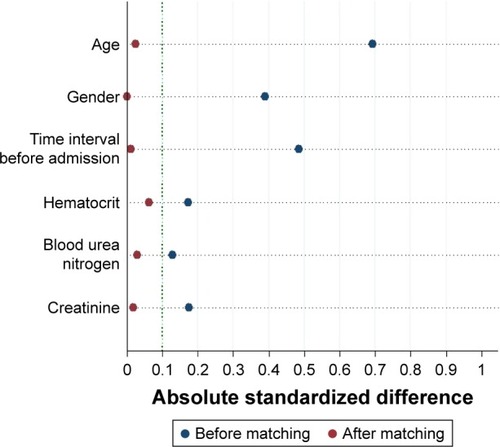
The distribution of propensity scores was different and shared little overlap in the entire cohort before matching (). After matching, the distribution of propensity scores overlapped between groups, suggestive of the comparability between groups (). The propensity score model was well calibrated (Hosmer–Lemeshow test, P=0.843), and discriminated adequately between the two groups (c statistic =0.77). All patients were matched to the closest control within 0.10 ASDs of the logit of the estimated propensity score ().
Figure 1 Distribution of propensity scores in the entire cohort before matching (A) and in the propensity score-matched groups after matching (B) for age, gender, time interval before admission, hematocrit, blood urea nitrogen and creatinine. The estimated propensity scores of each patient represent predicted probability or likelihood that the patients were in the low-amylase group.
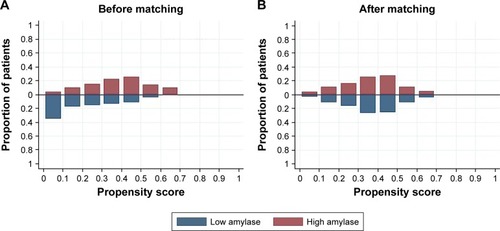
Figure 2 Absolute standardized difference plot before matching (entire cohort) and after matching (matched data) for the covariates listed on the y axis. The dotted vertical line indicates a commonly used cutoff for absolute standardized difference (10%), which means that a covariate balance <10% of absolute standardized difference is considered acceptable.
Comparison of clinical characteristics of patients with and without low amylase
Before matching (), patients in group 2 (low amylase) were younger, and there was a higher proportion of males and longer time from pain onset to admission, as compared to group 1. As to chronic concomitant diseases and lifestyle, group 2 had a higher proportion of patients with diabetes mellitus, fatty liver, alcohol consumption and smoking compared to group 1. There was significant statistical difference between group 2 and group 1 with respect to etiology, BUN and lipid levels. There was a trend for longer median hospital stay (days) with higher serum amylase level, though it did not reach statistical significance (P=0.074). However, no significant difference could be observed between groups, with respect to severity of AP-instigated death.
After matching (), there was no significant statistical difference between group 2 and group 1 with respect to age, gender, time from pain onset to admission, BMI, hypertension, diabetes mellitus, fatty liver, alcohol consumption, smoking, hematocrit, glucose, BUN and creatinine. Patients with low amylase (group 2) had a lower proportion of biliary etiology, and higher serum levels of total cholesterol, LDL-C and triglyceride levels compared to group 1. There was no significant statistical difference between group 2 and group 1 with respect to severity of AP, median hospital stay (days) and death.
Prediction of AP with low amylase: multivariable analysis
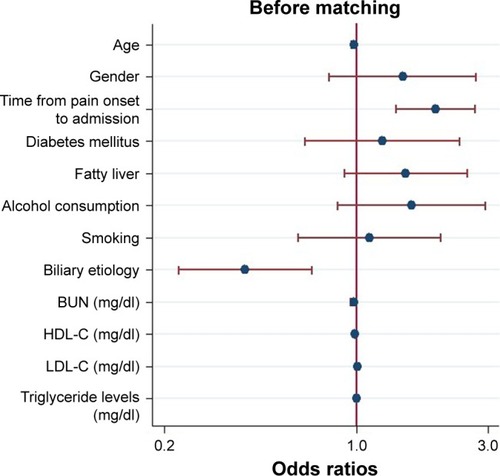
Before matching, according to the results of univariable analysis (), age, gender, time from pain onset to admission, diabetes mellitus, fatty liver, alcohol consumption, smoking, biliary etiology, BUN, HDL-C, LDL-C and triglyceride levels were included as candidate variables in multivariable logistic regression. Multivariable analysis indicated that age (OR: 0.979; 95% CI: 0.962–0.996; P=0.018), time from pain onset to admission (OR: 1.940; 95% CI: 1.395–2.697; P<0.001), biliary etiology (OR: 0.394; 95% CI: 0.226–0.688; P=0.001), HDL-C (OR: 0.991; 95% CI: 0.985–0.997; P=0.004), LDL-C (OR: 1.008; 95% CI: 1.002–1.013; P=0.007) and triglyceride levels (OR: 1.001; 95% CI: 1.0001–1.001; P=0.004) were independently associated with development of AP with low amylase ().
Figure 3 Logistic regression plot of odds ratios and 95% confidence intervals for evaluation of the potential predictors and the risk of acute pancreatitis with low amylase in the entire cohort (n=464).
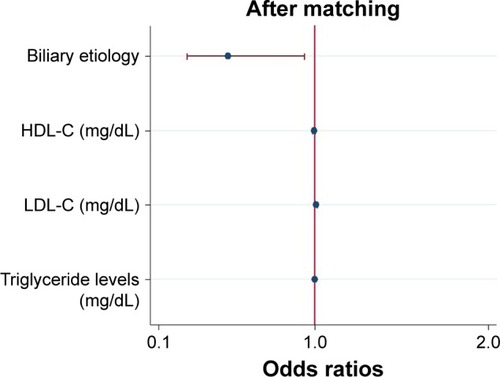
After matching, according to the results of univariable analysis (), biliary etiology, HDL-C, LDL-C and triglyceride levels were included as candidate variables in multi-variable logistic regression. Multivariable analysis indicated that biliary etiology (OR: 0.499; 95% CI: 0.265–0.942; P=0.003), LDL-C (OR: 1.009; 95% CI: 1.002–1.017; P=0.017) and triglyceride levels (OR: 1.001; 95% CI: 1.0001–1.001; P=0.015) were independently associated with development of AP with low amylase (). When ruling out patients with hypertriglyceridemic pancreatitis, biliary etiology (OR: 0.434; 95% CI: 0.219–0.862; P=0.017), LDL-C (OR: 1.009; 95% CI: 1.001–1.017; P=0.022) and triglyceride levels (OR: 1.001; 95% CI: 1.0001–1.002; P=0.033) were independently associated with development of AP with low amylase.
Figure 4 Logistic regression plot of odds ratios and 95% confidence intervals for evaluation of the potential predictors and the risk of acute pancreatitis with low amylase in the propensity score-matched groups (108 matched pairs).
Discussion
The results of the present study demonstrated that: (i) there was no significant statistical difference between group 2 and group 1 with respect to severity of AP, median hospital stay (days) and death ( and ), and (ii) patients with low amylase had a lower proportion of biliary etiology, and higher serum levels of total cholesterol, LDL-C and triglyceride levels compared to the other group of patients ( and ). Biliary etiology, LDL-C and triglyceride levels were independently associated with development of AP with low amylase ( and ). These results did not change, even after ruling out patients with hypertriglyceridemic pancreatitis.
Amylase testing is routinely performed at many health care institutions in clinical practice, although lipase is believed to offer superior sensitivity and specificity as compared to amylase for the diagnosis of AP.Citation14 Other serum enzymes such as trypsinogen and elastase can be analyzed to diagnose AP. However, elevated amylase levels continue to be the “gold standard” among the serum markers.Citation16 Conditions like intestinal obstruction and renal failure might also cause a slight increase of serum amylase.Citation16 AP with small elevated serum amylase levels on admission represents a substantial patient group; it is easy to go unnoticed, and its diagnosis might be delayed. Current textbook, guideline and/or consensus discourage CT of abdomen in the first 48 hours. Normally, the diagnosis of AP is apparent in many patients, and most patients with AP have a mild, uncomplicated course.Citation1 However, imaging could be handy in the timely diagnosis and management of AP with atypical presentation, such as with normal or small elevated levels of pancreatic enzymes, as abdominal imaging is useful to confirm the diagnosis of AP.Citation13 Our study suggested that patients with AP with lower amylase levels than in the standardized criteria had similar clinical outcomes and severity based on the revised Atlanta criteria when compared to patients with high amylase levels in the entire cohort () and the matched data ().
Our study showed biliary etiology (OR: 0.499; 95% CI: 0.265–0.942) was associated with a statistically significant 50.1% reduction in the odds of AP with low amylase when compared to other etiologies (). This is consistent with existing knowledge that patients with gallstone-induced AP tend to have higher levels of pancreatic enzymes as compared with patients with AP from other etiologies.Citation13,Citation16 Cho et alCitation25 have reported on the difference in the levels of serum pancreatic enzymes between alcoholic AP and biliary AP. Serum amylase and lipase tend to be lower in alcoholic AP than in biliary AP. This difference is assumed to be an outcome of the different mechanisms of induction of AP via gallstones and alcohol.Citation26 Our study indicates group 2 had a high proportion of patients with alcohol consumption in the entire cohort, that is, 25.0% vs 11.1% (P<0.001) () before and 24.1% vs 18.5% (P=0.319) () after matching. However, it did not reach a statistical difference when compared to group 1.
It has been reported that hypertriglyceridemic pancreatitis is often associated with low or normal serum amylase, although the mechanism is not fully understood.Citation1 One of the possible explanations is that plasma triglyceride levels >500 mg/dL interfere with in vitro determination of the actual amylase level by preventing the calorimetric reading of the assay end point.Citation27,Citation28 This study proposes that group 2 had a higher proportion of hypertriglyceridemic pancreatitis both in the entire cohort before matching (10.8% vs 4.1%) () and in the matched cohort after matching (11.1% vs 4.6%) ().
There are no reports about the relationship between lipid levels and pancreatic enzymes in patients with AP in the literature. Our multivariable logistic regression study suggested that LDL-C and triglyceride levels were independently associated with development of AP with low amylase both in the entire cohort before matching () and in the matched cohort () after adjusting for confounding factors. These results did not change even when patients with hypertriglyceridemic pancreatitis were removed from the analyses. A study on cardiovascular diseases has suggested that low-density lipoprotein is the principal atherogenic lipoprotein that promotes cholesterol accumulation and an inflammatory response in the artery wall, which drives the process of atherosclerosis.Citation29 Ischemia is one of the well-documented etiologies of AP. Recent studies have indicated that inhibition of coagulation may improve pancreatic ischemia, accelerate normalization of pancreatic histology and affect the development of AP.Citation30–Citation32 It was hypothesized that high LDL-C levels may influence pancreatic microcirculation and result in reduced yield or release of pancreatic amylase.
The strengths of our study include the following: (i) this is the first study to compare clinical outcomes of AP with and without low amylase based on the revised Atlanta criteria using a propensity score analysis, and (ii) to the best of our knowledge, this is the first study to investigate potential clinical and laboratory predictors of AP with low amylase. Nevertheless, there are some limitations to the present study. First, although selection bias could be reduced by propensity score analysis, the relatively small sample size of the matched cohort limits the strength of the results, and there is a risk of type II error. Still, even in cases of a small study sample, propensity score matching can yield unbiased estimations of results, unless the true confounders and the variables related only to the outcome are not included in the propensity model.Citation33,Citation34 On the other hand, our study achieved good balance in covariates between groups after propensity score matching ( and ), which makes our results reliable.
In summary, amylase level was not related to the severity of AP based on the revised Atlanta criteria, median hospital stay (days) and death. Biliary etiology, LDL-C and triglyceride levels were independently associated with development of AP with low amylase.
Author contributions
All authors contributed toward data analysis and drafting and critically revising the paper, and agree to be accountable for all aspects of the work. All of the authors read and approved the manuscript.
Disclosure
The authors report no conflicts of interest in this work.
References
- TennerSBaillieJDeWittJVegeSSAmerican College of GastroenterologyAmerican College of Gastroenterology guideline: management of acute pancreatitisAm J Gastroenterol2013108914001415141623896955
- HongWLinSZippiMSerum albumin is independently associated with persistent organ failure in acute pancreatitisCan J Gastroenterol Hepatol20172017529714329147647
- HongWLinSZippiMHigh-density lipoprotein cholesterol, blood urea nitrogen, and serum creatinine can predict severe acute pancreatitisBiomed Res Int20172017164838528904946
- DumnickaPMaduziaDCeranowiczPOlszaneckiRDrozdzRKusnierz-CabalaBThe interplay between inflammation, coagulation and endothelial injury in the early phase of acute pancreatitis: clinical implicationsInt J Mol Sci2017182
- DumnickaPKusnierz-CabalaBSporekMSerum concentrations of angiopoietin-2 and soluble fms-like tyrosine kinase 1 (sFlt-1) are associated with coagulopathy among patients with acute pancreatitisInt J Mol Sci2017184753
- CeranowiczPDembinskiAWarzechaZProtective and therapeutic effect of heparin in acute pancreatitisJ Physiol Pharmacol200859Suppl 4103125
- MaleszkaADumnickaPMatuszykAThe diagnostic usefulness of serum total bile acid concentrations in the early phase of acute pancreatitis of varied etiologiesInt J Mol Sci2017181106
- SporekMDumnickaPGala-BladzinskaADetermination of serum neutrophil gelatinase-associated lipocalin at the early stage of acute pancreatitisFolia Med Cracov2016562516
- DumnickaPSporekMMazur-LaskowskaMSerum soluble fms-like tyrosine kinase 1 (sFlt-1) predicts the severity of acute pancreatitisInt J Mol Sci201617122038
- LankischPGBurchard-ReckertSLehnickDUnderestimation of acute pancreatitis: patients with only a small increase in amylase/lipase levels can also have or develop severe acute pancreatitisGut199944454254410075962
- BanksPABollenTLDervenisCAcute Pancreatitis Classification Working GroupClassification of acute pancreatitis – 2012: revision of the Atlanta classification and definitions by international consensusGut201362110211123100216
- MunirajTDangSPitchumoniCSPANCREATITIS OR NOT? – elevated lipase and amylase in ICU patientsJ Crit Care20153061370137526411523
- AgrawalAParikhMThellaKJasdanwalaSAcute pancreatitis with normal lipase and amylase: an ED dilemmaAm J Emerg Med201634112254.e32254.e6
- BarbieriJSRiggioJMJaffeRAmylase testing for abdominal pain and suspected acute pancreatitisJ Hosp Med201611536636827160507
- ChaseCWBarkerDERussellWLBurnsRPSerum amylase and lipase in the evaluation of acute abdominal painAm Surg19966212102810338955242
- YadavDAgarwalNPitchumoniCSA critical evaluation of laboratory tests in acute pancreatitisAm J Gastroenterol20029761309131812094843
- HongWDChenXRJinSQHuangQKZhuQHPanJYUse of an artificial neural network to predict persistent organ failure in patients with acute pancreatitisClinics (Sao Paulo)20136812731
- LinSHongWBasharatZWangQPanJZhouMBlood urea nitrogen as a predictor of severe acute pancreatitis based on the revised Atlanta criteria: timing of measurement and cutoff pointsCan J Gastroenterol Hepatol20172017959283128487848
- ChengKHChuCSLinTHLeeKTSheuSHLaiWTLipid paradox in acute myocardial infarction-the association with 30-day in-hospital mortalityCrit Care Med20154361255126425738856
- PriceJCSeabergECLatanichRRisk factors for fatty liver in the Multicenter AIDS Cohort StudyAm J Gastroenterol2014109569570424642579
- HongWDongLHuangQWuWWuJWangYPrediction of severe acute pancreatitis using classification and regression tree analysisDig Dis Sci201156123664367121833749
- LankischPGApteMBanksPAAcute pancreatitisLancet20153869988859625616312
- de MestralCRotsteinODLaupacisAComparative operative outcomes of early and delayed cholecystectomy for acute cholecystitis: a population-based propensity score analysisAnn Surg20142591101523979286
- AliMSGroenwoldRHKlungelOHBest (but oft-forgotten) practices: propensity score methods in clinical nutrition researchAm J Clin Nutr2016104224725827413128
- ChoJHKimTNKimSBComparison of clinical course and outcome of acute pancreatitis according to the two main etiologies: alcohol and gallstoneBMC Gastroenterol2015158726209440
- SakorafasGHTsiotouAGEtiology and pathogenesis of acute pancreatitis: current conceptsJ Clin Gastroenterol200030434335610875461
- MurphyMJShengXMacDonaldTMWeiLHypertriglyceridemia and acute pancreatitisJAMA Intern Med2013173216216423183821
- WongECButchAWRosenblumJLThe clinical chemistry laboratory and acute pancreatitisClin Chem19933922342437679337
- TallARYvan-CharvetLCholesterol, inflammation and innate immunityNat Rev Immunol201515210411625614320
- WarzechaZSendurPCeranowiczPTherapeutic effect of low doses of acenocoumarol in the course of ischemia/reperfusion-induced acute pancreatitis in ratsInt J Mol Sci2017184882
- WarzechaZSendurPCeranowiczPProtective effect of pretreatment with acenocoumarol in cerulein-induced acute pancreatitisInt J Mol Sci201617101709
- WarzechaZSendurPCeranowiczPPretreatment with low doses of acenocoumarol inhibits the development of acute ischemia/reperfusion-induced pancreatitisJ Physiol Pharmacol201566573174026579579
- FukunagaSNagamiYShibaMLong-term prognosis of expanded-indication differentiated-type early gastric cancer treated with endoscopic submucosal dissection or surgery using propensity score analysisGastrointest Endosc201785114315227365265
- PirracchioRResche-RigonMChevretSEvaluation of the propensity score methods for estimating marginal odds ratios in case of small sample sizeBMC Med Res Methodol2012127022646911