Abstract
Background and objectives:
Nonadherence to oral immunosuppressive drugs in renal transplant patients remains a major challenge. The objective of this study was to develop an adherence-exposure model that 1) quantifies the impact of nonadherence patterns on cyclosporine levels and 2) identifies nonadherence patterns that are associated with unfavorable transplantation outcomes.
Design, setting, participants, and measurements:
This model quantified variability in drug exposure, expressed as the coefficient of variation (CV%), for time-averaged and trough cyclosporine levels (Cavg and Cmin, respectively), and percentage of days spent below the therapeutic Cmin target. Simulated patterns of nonadherence closely matched those observed in clinical practice for four nonadherence clusters and an “Others” category.
Results:
Patients in simulated nonadherence clusters 1–3 spent a mean (standard deviation) 5.8% (4.9), 9.0% (5.0), and 6.5% (3.4) of days below the Cmin target, compared with 76.8% (6.5) for cluster 4 and 38.3% (6.4) for the “Others” category. Mean (standard deviation) CV% values for Cmin were 24.1 (7.9), 35.4 (11.7), and 34.1 (10.6) for clusters 1–3, compared with 136.4 (23.6) for cluster 4 and 64.8 (10.3) for the “Others” category. Findings for Cavg were similar.
Conclusion:
Based on nonadherence patterns and known relationships between CV% for Cmin and Cavg, and transplantation outcomes, patients in cluster 4 and the “Others” category are expected to be at high risk of allograft rejection. The proposed drug adherence-exposure model is useful to identify high-risk patients who can be targeted for interventions aimed at enhancing drug adherence to optimize clinical long-term outcomes.
Introduction
While long-term adherence to therapy has clear benefits in many illnesses, organ transplantation stands out as one of the few medical conditions where the implications of suboptimal adherence are as significant as allograft rejection, a return to dialysis, and potentially death. Immunosuppressive regimens have long been dominated by the calcineurin inhibitors, such as cyclosporine and its derivatives. Cyclosporine, which is taken orally at intervals of 12 hours, requires drug monitoring and dose adjustment to maintain serum concentration levels (exposure) within a narrow therapeutic range.Citation1
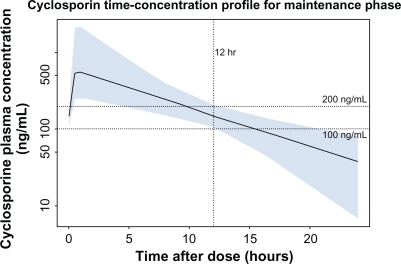
The measure most widely used in practice to monitor cyclosporine exposure for the purpose of dose adjustment is the trough concentration, Cmin, the serum level 12 hours after a first dose and immediately before the next dose. Although the serum level at 2 hours correlates better with Cavg, the time-averaged cyclosporine concentration during the 12-hour period between doses, the trough level is thought to be the most practical measure of exposure.Citation1,Citation2 To maintain effective immunosuppression, Cmin values must be maintained above a floor of 100–200 ng/mL (the value defined in the US product label for the microemulsion formulation of cyclosporine). illustrates that after cyclosporine dose is adjusted to a trough of 100–200 ng/mL, the serum concentration will fall below that level if the next dose is delayed or missed.Citation3 In contrast, over-exposure to high serum levels of cyclosporine is nephrotoxic, but the threshold at which this takes effect has not been clearly defined.
Figure 1 Cyclosporine serum concentration following drug titration targeting a trough concentration of 100–200 ng/mL. Shown is the median (solid line) and 90% population exposure range (shaded area) of cyclosporine serum concentration following a dose adjusted to a target trough concentration of 100–200 ng/mL. Derived from PK parameters reported in Lukas et al.Citation3
After dose optimization, within-patient variability in cyclosporine exposure persists and is associated with higher rates of adverse transplantation outcomes.Citation4,Citation5 Variability in cyclosporine exposure is described by the coefficient of variation (CV%), which is the standard deviation expressed as a percentage of the mean of the measure of exposure (either Cmin or Cavg). Kahan et al determined that patients above a CV% ≥ 28.4% in Cavg for cyclosporine had an increased 5-year incidence of chronic rejection (40%, compared with 24% for patients below the threshold).Citation4 A CV% value for Cmin above a threshold of 36% was similarly associated with an increased risk of chronic rejection.Citation4 In a similar 5-year study, Waiser et al determined a CV% threshold for Cmin of 28.05%.Citation5 Compared with patients with a CV% below this threshold, those above experienced a higher incidence of acute rejection (40.7% versus 29.4%), a lower rate of graft survival (81.1% versus 93.3%), and higher serum creatinine levels (1.7 versus 1.4 mg/dL; P < 0.05 for all comparisons).Citation5
One major cause of variability in drug exposure is nonadherence.Citation6 Nonadherence remains a major challenge in the provision of medical care, particularly in the management of chronic conditions outside of the confines of a clinical trial, and where a medicine’s positive and negative attributes interface with day-to-day human health behaviors. Thus, between 14% and 65% (interquartile range) of renal graft losses have been attributed to nonadherence in cohort studies.Citation7 However, the level of nonadherence that increases the risk of renal graft failure has not been identifiedCitation7 and estimates of the prevalence of nonadherence to oral immunosuppressive drugs in renal transplant patients vary widely, from 2% to 67%.Citation8 In their systematic review, Butler et al reported that nonadherence was formally defined in only 10 of 37 studies analyzed.Citation7 Consensus on a threshold defining nonadherence did not exist.Citation7
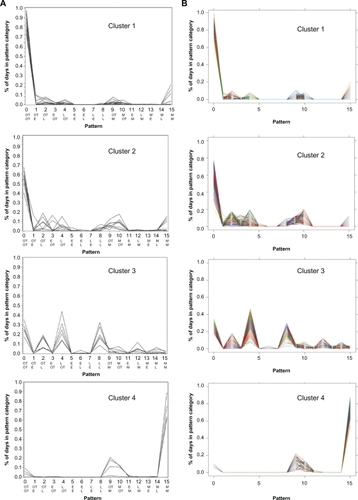
Studies using the Medication Event Monitoring System (MEMS) find that patients’ medication-taking behavior comprises a variety of complex patterns that cannot clearly be dichotomized into adherent and nonadherent.Citation9 Russell et al used MEMS to study adult kidney transplant recipients taking an oral immunosuppressant twice daily at prescribed times, 12 hours apart, in the morning and evening.Citation9 At each dosing, one of four possibilities could occur: the dose could be taken early, on time, late, or could be missed. “On time” was defined as a dose within 1.5 hours on either side of the target time, and early and late doses fell outside the window of ±1.5 hours but within ±6.0 hours. The unit of analysis was day, and because there were four outcomes at each of the two doses on a day, there were 16 (4Citation2) possible adherence patterns. A patient’s adherence was described in terms of the proportion of the total study days the patient’s medication-taking fell into each of the 16 possible adherence patterns. Russell et al applied cluster analysis to the adherence patterns and observed four statistically homogeneous clusters of subjects and an “Others” category in which patients did not cluster into a single pattern of behavior. reproduces the distributions of each of the 16 adherence patterns observed by Russell et al for patients in clusters 1–4. Patients in cluster 1 (32%) almost always took both daily doses of their medication on time. Those in cluster 2 (18%) sometimes missed doses or were late, those in cluster 3 (14%) were frequently late with one or both daily doses, and those in cluster 4 (9%) most often missed both doses. Twenty-seven percent of patients fell into the heterogeneous “Other” category.
Figure 2 A) Observed distributions of nonadherence patterns in renal transplant patients. Shown are nonadherence patterns observed by Russell et alCitation9 for patients in clusters 1–4 (Ns 14, 8, 6, and 4, respectively; the “Others” category, N = 12, is not presented). Each line represents an individual patient. The ordinate shows the percent days with each adherence pattern, and the abscissa shows the 16 patterns, numbered 0–15; the top row of abbreviations shows the timing of morning dose, and the bottom row, timing of the evening dose. B) Simulated distributions of nonadherence patterns.
Figure 2A was reprinted with permission of John Wiley & Sons, Inc. from Res Nurs Health vol. 29, no. 6, 2006, pp. 521–532.
There was, however, no known relationship between the complex patterns of nonadherence reported by Russell et al and immunosuppressant exposure – and hence transplantation outcomes. Relationships between nonadherence patterns and drug exposure can be characterized by computer modeling, an approach pioneered by LB Sheiner.Citation6 We sought to characterize the link between the attributes of a medicine, patient medicine-taking behavior, and drug exposure by adapting the “dose-adherence-exposure-outcomes” framework described by LB Sheiner to a case study in kidney transplantation (). Here we develop a drug adherence-exposure model that 1) characterizes nonadherence patterns to twice-daily oral immunosuppressants, 2) quantifies their impact on exposure to cyclosporine, expressed as CV% for Cavg and Cmin, and as the proportion of days spent below the cyclosporine floor value of 100 ng/mL, and 3) identifies nonadherence patterns that are associated with unfavorable transplantation outcomes such as increased risk of allograft rejection. The goal was to propose a drug adherence-exposure model than can be used to identify high-risk patients who could be targeted for interventions aimed at enhancing drug adherence, hence reducing the risks of allograft rejection, a return to dialysis, and death.
Figure 3 The drug adherence-exposure model. The diagram shows the conceptual framework of the drug adherence-exposure model rather than the temporal sequence of events. The impact of drug nonadherence patterns on the within- and between-individual variability of cyclosporine exposure was quantified by coupling a model of adherence to a dose-exposure model. An adherence model was developed to mimic the 16 nonadherence patterns described by Russell et al,Citation9 and this adherence model was coupled to a previously published population pharmacokinetic (dose-exposure) model for cyclosporine.Citation3 The combined effect of nonadherence patterns and pharmacokinetic characteristics on variability in cyclosporine concentrations was quantified by applying the coupled drug adherence and drug-exposure models to simulate Cavg and Cmin values for 500 patients over a period of 90 days (a total of 45,000 patient-days). Subjects with excessive variability were identified based on threshold levels of variability reported by Kahan et al and Waiser et al.Citation4,Citation5 Individual patients at risk of adverse transplantation outcomes can thus be identified by their nonadherence behavior.

Materials and methods
The impact of drug nonadherence on the within- and between-individual variability of cyclosporine exposure was quantified by coupling a model of adherence to a dose-exposure model. The adherence model was developed to mimic the 16 nonadherence patterns described by Russell et al.Citation9 This adherence model was coupled to a previously published population pharmacokinetic (dose-exposure) model that describes the within- and between-individual variability in the concentration-time profile of cyclosporine.Citation3 The coupled simulation model was applied to determine variability in two measures of exposure: Cavg and Cmin. The drug adherence model was developed in S-PLUS and the cyclosporine population pharmacokinetic (nonlinear mixed-effects) model was implemented in NONMEM®.Citation10,Citation11 The structural component of the population pharmacokinetic model was specified as a one-compartment model with first-order absorption, with typical values structural model parameters specified by fixed-effect parameters, and between-individual variability in structural model parameter values specified by random-effects parameters.
The combined effect of nonadherence and pharmacokinetic characteristics on variability in cyclosporine concentrations was determined by applying the coupled drug adherence and drug-exposure models to simulate Cavg and Cmin values for 500 patients over a period of 90 days (a total of 45,000 patient-days). There were four steps to the procedure used to simulate the cyclosporine exposures for each subject (): 1) assign a dose to the subject; 2) simulate a sequence of doses for the subject by applying the adherence model; 3) simulate Cavg and Cmin values for each dose, by applying the dose-exposure model; and 4) calculate within-subject variability in Cavg and Cmin values and assess implications of variability on clinical outcome.
First, steady-state Cmin values were simulated for each of 500 subjects with the population pharmacokinetic model, assuming perfect adherence to the recommended dose of cyclosporine. The dose of cyclosporine assigned to each subject was adjusted such that the steady-state Cmin value for the subject was within the widely accepted therapeutic window of 100–200 ng/mL for immunosuppression maintenance. Second, the drug adherence model was applied to simulate a sequence of doses for each of the 500 subjects over a period of 90 days, based upon the relative frequency of the adherence patterns reported by Russell et al.Citation9 Third, the population pharmacokinetic model was used to simulate Cavg and Cmin values for each dose in a sequence for each of the 500 subjects. The variability in the values of Cavg and Cmin were then summarized and reported. Finally, the within-subject CV% was calculated for the simulated Cavg and Cmin values, and subjects with excessive variability were identified, based on threshold levels of variability reported by Kahan et al and Waiser et al.Citation4,Citation5
Based on the frequencies of the 16 nonadherence patterns observed by Russell et al,Citation9 the 45,000 patient-days were distributed as follows: 20,995 to pattern 0, 630 to pattern 1, 3,946 to pattern 2, 486 to pattern 3, 3,362 to pattern 4, etc. Of the 500 patients, 159 were assigned to cluster 1, 91 to cluster 2, 91 to cluster 3, 45 to cluster 4, and 114 to the “Others” category. Adherence patterns were simulated for each individual patient. For patient 1 of cluster 1, the 16 patterns of dosing were assigned as follows: patterns 0, 2, 4, 10, and 15 were assigned 76 days, 2 days, 6 days, 1 day, and 5 days, respectively. These patterns were randomly reshuffled to generate dosing over 90 days for patient 1. This process was repeated for patient 2 of cluster 1 after subtracting from the total sum of 45,000 adherence patterns those already completed by patient 1 (ie, 41,994 minus 76 for pattern 0, 7,893 minus 2 for pattern 2, etc.). This process was repeated for the remaining patients in cluster 1, and then for the patients in clusters 2–4. After subtracting all patients in clusters 1–4 from the total, there remained 114 patients with N0 in pattern 0, N1 in pattern 1, etc, in the “Others” category. For subject 1 in this category, a weighted random sampling was taken from the remaining patterns. This process was repeated for the remaining subjects.
Results
Simulated adherence patterns
shows the simulated distributions of adherence patterns computed by the drug adherence-exposure model. These calculated distributions are essentially superimposable on the distributions observed by Russell et al.
Variability in cyclosporine exposure by simulated adherence cluster
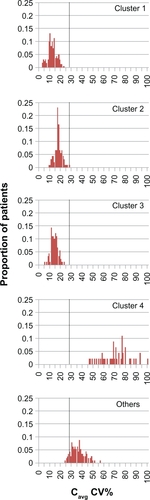
Distributions of CV% values for Cavg are presented in for the simulated adherence clusters. The distributions for clusters 1–3, which had mean (standard deviation [SD]) values of 12.0 (4.1), 17.5 (3.5), and 13.9 (3.3), respectively, were distinct from that of cluster 4, which had a mean (SD) value of 71.9 (12.8), while the “Others” distribution lay in an intermediate position, with mean (SD) of 35.7 (6.3). None of the subjects in clusters 1–3 had Cavg variability greater than the threshold value of 28.4% CV, whereas the percentages of subjects in cluster 4 and “Others” with Cavg variability above the threshold value were 100 and 85, respectively.
Figure 4 Simulated distribution of the coefficient of variation in cyclosporine Cavg for nonadherence clusters. Vertical dotted line: CV% threshold for Cavg of 28.4%, as defined by Kahan et al.Citation4
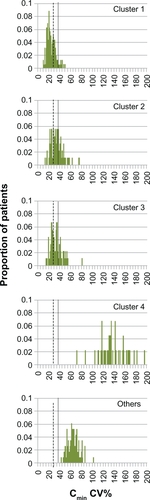
The distributions of CV% values for Cmin were similar to those for Cavg (). Mean (SD) values for clusters 1–4 and “Others” were 24.1 (7.9), 35.4 (11.7), 34.1 (10.6), 136.4 (23.6), and 64.8 (10.3), respectively. The Cmin variability of most subjects in clusters 1–3 (8%–24%) was less than the threshold value of 36% CV, and 29%–76% of these subjects had variability above the lower threshold of 28.05% CV. In contrast, 100% of subjects in cluster 4 and in the “Others” category had Cmin variability above these variability thresholds.
Figure 5 Simulated distribution of the coefficient of variation in cyclosporine Cmin for nonadherence clusters. Vertical dotted line: CV% threshold for Cmin of 36%, as defined by Kahan et al.Citation4 Vertical dashed line: CV% threshold for Cmin of 28.05%, as defined by Waiser et al.Citation5
Percentage of days below the cyclosporine Cmin target range by simulated adherence cluster
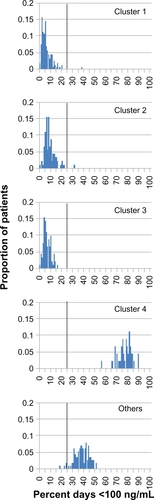
shows the percentage of days below the cyclosporine Cmin floor value of 100 ng/mL for the simulated adherence clusters. Again, the distributions of clusters 1–3 were similar, with mean (SD) values of 5.8 (4.9), 9.0 (5.0), and 6.5 (3.4) days, distinct from the mean (SD) value for cluster 4 of 76.8 (6.5) days, and the mean (SD) for “Others” of 38.3 (6.4) days. The proportion of subjects in clusters 1–3 for whom the serum concentration fell below 100 ng/mL (the lower limit of the target range) on more than 25% of treatment days was less than 1%, whereas the corresponding values for cluster 4 and the “Others” category were 100% and greater than 95%, respectively.
Figure 6 Simulated percentage of days below the cyclosporine Cmin target range for nonadherence clusters. Vertical solid line: 25% of days threshold separating clusters 1–3 from cluster 4 and “Others”.
Discussion
The results provide evidence that the proposed drug adherence-exposure model can be used to quantify the impact of nonadherence patterns on immunosuppressant exposure, and hence transplantation outcomes. The simulated distributions of adherence patterns closely matched those observed for patients in the study reported by Russell et al.Citation9 The distributions by adherence cluster were similar whether the metric was time below the cyclosporine therapeutic range or variability in cyclosporine exposure, and regardless of which measure of exposure was used (Cmin or Cavg).
The distributions of adherence patterns in clusters 1–4 fell into two sets, consisting of clusters 1–3 versus cluster 4. The distributions in clusters 1, 2, and 3 were similar, indicating that patients in clusters 2 and 3 can be placed in the same lower-risk category as the patients in cluster 1, even though patients in clusters 2 and 3 sometimes were late or missed doses.Citation9 The distributions for cluster 4 were distinct and shifted to the right (higher risk). The distribution of the “Others” category fell between those of clusters 1–3 and 4, and a vertical line dividing clusters 1–3 from cluster 4 and “Others” can be drawn. In , the threshold separating clusters 1–3 from cluster 4 and “Others” can be set at 25% of days below a serum level of 100 ng/mL. For the CV% for Cavg, the threshold of 28% determined by Kahan et al effectively separates clusters 1–3 from cluster 4 and “Others” ().Citation4 The thresholds for CV% for Cmin determined by Waiser et al and Kahan et al (28.05% and 36%, respectively) both fall within the 95% confidence interval (8.6%–39.6%) of values for cluster 1 (),Citation4,Citation5 and a threshold of 50% better separates clusters 1–3 from cluster 4 and “Others” (). The discrepancy between the 50% we propose and the 28.05%–36.00% proposed by Waiser et al and Kahan et al might represent experimental error or a difference in the thresholds applicable to different formulations of cyclosporine. We modeled the pharmacokinetics of the microemulsion formulation of cyclosporine, whereas the thresholds reported by Kahan et al and Waiser et al were determined in the 1990s for a different formulation.Citation4,Citation5
These results suggest that a dichotomy between adherers and nonadherers can be objectively defined by adherence-simulation pharmacokinetic modeling based on MEMS data. Patients fitting the characteristics of cluster 4 and “Others” can be identified by their adherence patterns and targeted for intervention to improve adherence. This modeling approach can be applied to other oral immunosuppressants and oral medications for chronic conditions. The current standard of care for immunosuppression after renal transplantation is tacrolimus, a calcineurin inhibitor similar to cyclosporine in its pharmacokinetic profile that shows marked within-patient variability in absorption.Citation1 The values of the variables in the pharmacokinetic algorithm for cyclosporine will need to be modified to apply the model to tacrolimus. The simulated adherence patterns apply to twice-daily oral immunosuppressive regimens, including tacrolimus. In the study reported by Russell et al, 50% of patients took cyclosporine in different formulations, 41% took tacrolimus, and 9% took mycophenolate mofetil.Citation9 It is conceivable that the adherence clusters differ for cyclosporine and tacrolimus because adherence is affected by the specifics of the regimen,Citation12 ie, the drug type (the individual drug, formulation, route of administration), drug side-effects, and the number of daily doses.Citation13 It is anticipated that the advent of novel immunosuppressants, new formulations, and different routes of administration will affect observed adherence patterns.
In summary, we have developed a drug adherence-exposure model that: 1) accurately simulates observed patient adherence patterns; 2) computes values for drug exposure based on the pharmacokinetic properties of cyclosporine; 3) quantifies the impact of nonadherence patterns on variability in cyclosporine levels; and 4) facilitates identification of patients likely to be at high risk of allograft rejection, a return to dialysis, and death. Results were consistent regardless of the specific exposure measure used. The proposed drug adherence-exposure model could be applied to other oral immunosuppressants, and to any oral drugs – with available MEMS data to identify high-risk patients who can be targeted for interventions aimed at enhancing medication adherence over the long term. This proposed model for identifying at-risk patients from their patterns of nonadherence should be tested in clinical studies.
Acknowledgements
Medical writing assistance was provided by Julia Vishnevetsky, MPH and Dimitra Panagiotoglou in collaboration with SCRIBCO.
This work was presented in preliminary form at the 14th Congress of the European Society for Organ Transplantation, Paris, August 30–September 2, 2009.
Disclosure
All of the authors were employees of Bristol-Myers Squibb at the time this study was done.
References
- SchiffJColeECantarovichMTherapeutic monitoring of calcineurin inhibitors for the nephrologistClin J Am Soc Nephrol20072237438417699437
- HalimMANampooryMRJohnyKVThe area under the concentration-time curve versus trough and peak blood level monitoring in renal transplant recipients on cyclosporineTransplant Proc20053773019302116213291
- LukasJCSuarezAMValverdeMPTime-dependent pharmacokinetics of cyclosporine (Neoral) in de novo renal transplant patientsJ Clin Pharm Ther200530654955716336287
- KahanBDWelshMUrbauerDLLow intraindividual variability of cyclosporin A exposure reduces chronic rejection incidence and health care costsJ Am Soc Nephrol20001161122113110820177
- WaiserJSlowinskiTBrinker-PaschkeAImpact of the variability of cyclosporin A trough levels on long-term renal allograft functionNephrol Dial Transplant20021771310131712105257
- KennaLALabbeLBarrettJSPfisterMModeling and simulation of adherence: approaches and applications in therapeuticsAAPS J200572E390E40716353919
- ButlerJARoderickPMulleeMMasonJCPevelerRCFrequency and impact of nonadherence to immunosuppressants after renal transplantation: a systematic reviewTransplantation200477576977615021846
- DenhaerynckKDobbelsFCleemputIPrevalence, consequences, and determinants of nonadherence in adult renal transplant patients: a literature reviewTranspl Int200518101121113316162098
- RussellCLConnVSAshbaughCMadsenRHayesKRossGMedication adherence patterns in adult renal transplant recipientsRes Nurs Health200629652153217131276
- S-PLUS 7 Enterprise Developer User’s GuideInsightful CorporationSeattle, Washington2005
- BealSLSheinerLBNONMEM User’s Guide NONMEM Project GroupUniversity of CaliforniaSan Francisco1992
- HaynesRBA critical review of the “determinants” of patient compliance with therapeutic regimensSackettDLHaynesRBCompliance with Therapeutic RegimensBaltimore, MDJohns Hopkins University Press19762639
- MorrisonAWertheimerAICompilation of quantitative overviews of studies of adherenceDrug Inf J200438197210