
Abstract
Purpose
The aim of this study was to investigate the associations of high blood pressure (BP) and wide pulse pressure (PP) with obesity among common Korean people.
Materials and Methods
This study analyzed data from the Seventh Korean National Health and Nutrition Examination Survey (2017). The associations of BP with body mass index (BMI) and waist-to-height ratio (WHT2R) were investigated using their lump mean values.
Results
The BPs of males and females increased with BMI, the PP of females increased with BMI and then decreased, and the PP of males is nearly independent of BMI. The BPs of males and females increased to their maximum values with WHT2R and then decreased. The PPs of males and females increased with WHT2R.
Conclusion
BMI can be used as a useful predictor for high BP, and WHT2R can be used as a useful predictor for wide PP.
Introduction
Obesity has been attracting much attention because it is known to be associated with high blood pressure (BP) and pulse pressure (PP).Citation1–Citation7 PP is the difference between systolic blood pressure (SBP) and diastolic blood pressure (DBP). Hypertension and PP are major predictors of myocardial infarction, stroke, and other cardiovascular diseases. The body mass index (BMI) has been considered as a useful index for assessing obesityCitation8–Citation10 and is known to be causally associated with hypertension, which can be reduced by weight loss.Citation11–Citation15 However, BMI alone is not appropriate for distinguishing between body fat and muscle. As an alternative, waist circumference (WC) has been used to evaluate abdominal obesityCitation16–Citation22 because it is known to be highly correlated with visceral fat and is easy to measure.Citation23,Citation24 Therefore, BMI and WC are commonly recommended as measures of obesity.
It is known that normal-weight individuals with abdominal obesity can have metabolic risks.Citation25,Citation26 Higher risks of cardiovascular diseases were found in individuals with normal BMI and abdominal obesity compared to individuals with high BMI but no abdominal obesity.Citation27–Citation29 Some studies have shown that BMI and WC are associated with incident hypertension,Citation30,Citation31 and a combination of them may be a better predictor of obesity-related disease than BMI or WC alone.Citation32 Individuals with abdominal obesity were more likely to have metabolic syndrome than those without abdominal obesity.Citation33 Therefore, WC should also be measured in conjunction with BMI to define obesity and predict obesity-related hypertension.
This paper considers BMI and the waist-to-height ratio (WHT2R) as obesity indices. WHT2R is a new waist-to-height ratio introduced in this paper, which is defined as WC divided by the square of the height and considers the facts that WC is more associated with cardio-metabolic mortality than BMI, and height has an inverse association with mortality.Citation34–Citation36 On the other hand, it is nearly impossible to investigate the association of BP with obesity individually because the distribution of BP with obesity is quite complicated. Thus, this paper investigates it using the lump mean value (LMV). For that purpose, male and female subjects were divided into groups with successive BMI or WHT2R except near the two endpoints.
This paper examined the association of BP with BMI and WHT2R using their LMVs and regression methods, which fit the LMVs of BP with respect to the BMI and WHT2R to a straight line or Gaussian curve. The cutoff values for BMI and WHT2R for high BP and wide PP were determined from the straight lines or Gaussian curves. This paper discussed whether BMI and WHT2R could be used as useful predictors for high BP and wide PP.
Materials and Methods
Study Design and Participants
This study analyzed the public-use releases of the Seventh Korean National Health and Nutrition Examination Survey in 2017 (KNHANES VII-2, approval number 117002), which was performed by the Korea Centers for Disease Control and Prevention (KCDCP). KNHANES is a nationwide, population-based, cross-sectional survey conducted by the Division of Chronic Disease Surveillance of the KCDCP to examine the health and nutritional status of the population. The survey was conducted after approval by the institutional review board (IRB) in the KCDCP, and written informed consent was obtained from each participant at the time of enrollment. The final study cohort comprised 2550 males and 2938 females from a total of 6235 subjects aged 10 to 80 years. Subjects were excluded if they had extreme values of BMI, WHT2R, or BP in order to investigate the association between abdominal obesity and blood pressure in common Korean people ().
Table 1 Ranges of Systolic and Diastolic Pressures, BMI, and WHT2R considered
Data Analysis
This study investigated the association between obesity and BP using the LMVs of BMI, WHT2R, and BP given in Tables S1–S4. The WHT2R is defined as follows:
Each lump was composed of different numbers of subjects with successive BMI or WHT2R except near the two endpoints. The number of subjects contained in each lump was slightly different according to obesity because the number of subjects with the same BMI or WHT2R is not uniform and decreases toward the two endpoints due to a lack of subjects. The associations of BMI and WHT2R with BP were investigated using Microsoft Excel 2014, SPSS (version 25), and regressions in Sigmaplot 14. This paper examines the association between obesity and BP by considering linearity and Gaussianity. Linearity is defined as:
where is the LMV of BMI or WHT2R,
is a constant,
is the slope, and
is the LMV of SBP, DBP, or PP. In this study, the Gaussianity is defined as:
where is the minimum value of
when the constant
is positive,
is the standard deviation, which determines the width of the distribution, and
is the
value corresponding to the maximum value of
.
Results
Association Between BMI and Blood Pressure
shows BP with respect to BMI (Tables S1 and S2). It was fitted to straight lines given by EquationEq. (2(2) ). The parameters
and
are shown in the figure.
is the coefficient of determination. The males’ () and females’ () SBP and DBP increase as BMI increases, and the goodness of fit for linear regression is sufficient according to
. The males’ SBP increases from
to
, and their DBP increases from
to
when BMI increases from
to
. The females’ SBP increases from
to
, and their DBP increases from
to
when BMI increases from
to
.
Figure 1 The LMVs of SBP (red) and DBP (blue) with respect to the LMV of BMI for males (A) and females (B).
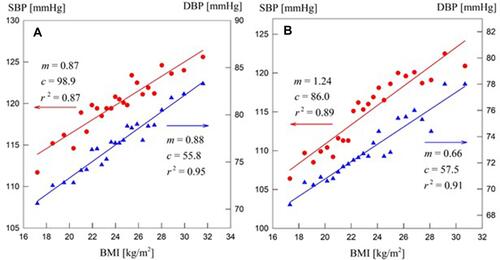
The cutoff values of BMI for SBP and DBP can be obtained from . The males’ cutoff values are for an SBP of
and
for a DBP of
. The females’ cutoff values are
and
for the same SBP and DBP. The females’ cutoff value for DBP was extrapolated from the blue line.
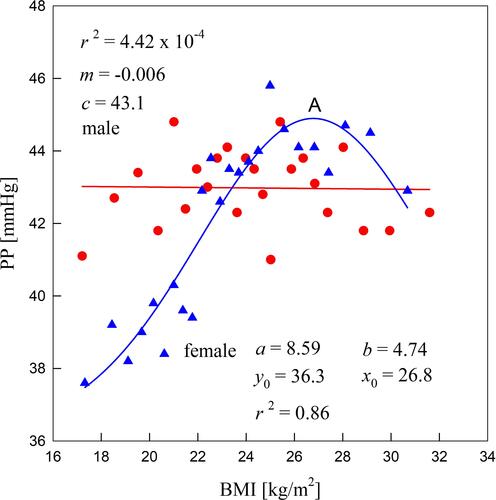
shows males’ and females’ PPs with respect to BMI. The association between the males’ PP and BMI cannot be obtained by either EquationEq. (2(2) ) or EquationEq. (3
(3) ) because PP fluctuates near
, and
for the linear regression is very small. But the association between females’ PP and BMI can be obtained by EquationEq. (3
(3) ), and the goodness of fit for Gaussian regression is sufficient according to
. Females’ PP increases from
to the maximum value (point A) of
when BMI increases from
to
and then it decreases to
until BMI increases to
.
Figure 2 The LMVs of PP with respect to the LMV of BMI for males (red) and females (blue).
Association Between WHT2R and Blood Pressure
BP with respect to WHT2R is shown in and is fitted to Gaussian curves given by EquationEq. (3(3) ) (Tables S3 and S4). Males’ () and females’ () SBP and DBP increase to their maximum values as WHT2R increases, and then they decrease. The goodness of fit for Gaussian regression is sufficient according to
.
Figure 3 The LMVs of SBP (red) and DBP (blue) with respect to the LMV of WHT2R for males (A) and females (B).
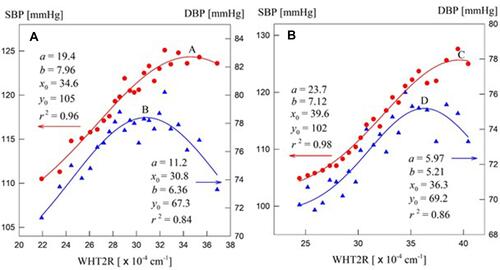
Males’ SBP increases from to the maximum value (point A) of
when WHT2R increases from
to
and then it decreases to
until WHT2R increases to
. Males’ DBP increases from
to the maximum value (point B) of
when WHT2R increases from
to
and then it decreases to
until WHT2R increases to
. Therefore, DBP reaches the maximum value earlier than SBP.
For females (), SBP increases from to the maximum value (point C) of
when WHT2R increases from
to
and then it decreases to
until WHT2R increases to
. DBP increases from
to the maximum value (point D) of
when WHT2R increases from
to
and then it decreases to
until WHT2R increases to
. Therefore, DBP reaches the maximum value earlier than SBP, as in males.
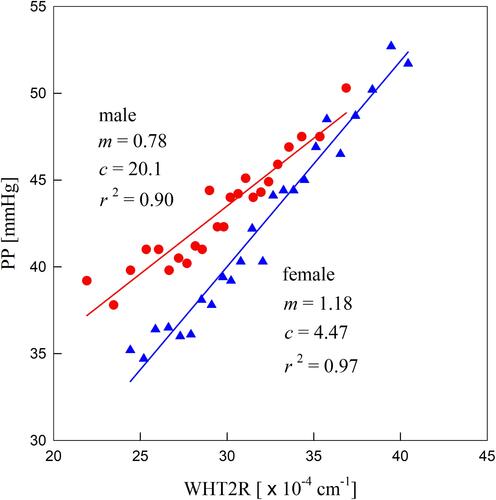
shows that males’ and females’ PPs increase with WHT2R. The association of males’ and females’ PPs with WHT2R can be obtained by EquationEq. (2(2) ), and the goodness of fit for Gaussian regression is sufficient according to
. The cutoff values of WHT2R for PP can be recommended from . Males’ and females’ cutoff values are
and
for PP of
, respectively.
Figure 4 The LMVs of PP with respect to the LMV of WHT2R for males (red) and females (blue).
Discussion
The associations of BP with BMI and WHT2R were investigated using their LMVs. SBPs and DBPs increased with BMI for both males and females. PP increased with BMI for females and was nearly independent of BMI for males. Therefore, BMI can be used as a predictor of high BP for both males and females and for wide PP for females. Males’ and females’ SBPs and DBPs increased to their maximum values with WHT2R and then decreased. The PPs of males and females increased with WHT2R. Therefore, WHT2R can be used as a predictor of high BP for both males and females until they increase to their maximum values, as well as for wide PP for both males and females.
The temporal behavior of BP depends on the peripheral vascular resistance, arterial compliance, and blood inertance.Citation37–Citation39 The peripheral resistance represents the resistance to blood flow in the arterial system, which is mainly in the resistance vessels (ie, small arterials and arterioles). The arterial compliance of the arterial wall is the ratio of a volume change to the resulting change in pressure of blood vessels that consist of large elastic arteries and small distal arteries. The compliance depends on the radius and wall thickness of the vessel and decreases with age due to progressive changes in the elastin and collagen content of the arterial wall.
Blood inertance represents the inertia of blood mass in the artery. It is known that the peripheral resistance is the main factor for the risk of hypertension, but arterial compliance is also important for old-age systolic hypertension.Citation40,Citation41 Blood inertance is predominant in large arteries. It is also known that increased stiffness within the thoracic aorta increases PP because of an increase in SBP and a decrease in DBP.Citation42,Citation43 Therefore, the increase in BP may be explained by increased stroke volume and contractility of the heart, combined with increased systemic vascular resistance caused by increased sympathetic activity.
This paper showed that BMI and WHT2R can be used as useful predictors for high BP and wide PP, respectively. The cutoff values for males’ BMI were for an SBP of
and
for a DBP of
, and females’ cutoff values were
and
for the same SBP and DBP. Males’ and females’ cutoff values for WHT2R were
and
for a PP of
, respectively.
The results were applicable to investigate the cause-effect relationships between BP and BMI or WHT2R by linear and Gaussian regressions. Linear regression and Gaussian regression mean that the relationship between the two variables is represented as a straight line and a Gaussian curve, respectively. The effect is determined by only one cause when a straight line represents the relationship and two or more causes when a Gaussian curve represents the relationship. This means that fat or muscle included in the BMI can be the dominant variable affecting the SBP and DBP (), and both visceral fat and subcutaneous fat included in the WHT2R can be the dominant variables affecting the SBP and DBP ().
Conclusion
The associations of BP with BMI and WHT2R among common Korean people cannot be interpreted individually, but their characteristics can be analyzed by their LMVs. Although the cutoff values for the BMI and WHT2R for high BP and wide PP recommended in this paper can be used as guidelines for Korean people with a similar physique, it is expected that the cutoff values for other ethnicities can be obtained using the present method. On the other hand, the aging process decreases arterial compliance and increases peripheral resistance because with age, the stiffness of the artery wall increases, the viscosity increases, and the radius of the artery wall decreases.Citation44 This will be investigated using the present method in the near future.
Acknowledgments
The author would like to thank the Korea Centers for Disease Control and Prevention for providing the data from the Korea National Health and Nutrition Examination Survey 2016–2017.
Disclosure
The author reports no conflicts of interest in this work.
References
- Fiebach NH, Hebert PR, Stampfer MJ, et al. A prospective study of high blood pressure and cardiovascular disease in women. Am J Epidemiol. 1989;130:646–654. doi:10.1093/oxfordjournals.aje.a115386
- Whelton PK, Perneger TV, Brancati FL, Klag MJ. Epidemiology and prevention of blood pressure-related renal disease. J Hypertens Suppl. 1992;10:S77–S84.
- Kearney PM, Whelton M, Reynolds K, Muntner P, Whelton PK, He J. Global burden of hypertension: analysis of worldwide data. Lancet. 2005;365:217–223. doi:10.1016/S0140-6736(05)17741-1
- James PA, Oparil S, Carter BL, et al. Evidence-based guideline for the management of high blood pressure in adults: report from the panel members appointed to the Eighth Joint National Committee (JNC 8). JAMA. 2014;311:507–520. doi:10.1001/jama.2013.284427
- Michard F, Boussat S, Chemla D, et al. Relation between respiratory changes in arterial pulse pressure and fluid responsiveness in septic patients with acute circulatory. Am J Respir Crit Care Med. 2000;162:134–138. doi:10.1164/ajrccm.162.1.9903035
- Mulè G, Nardi E, Cottone S, et al. Relationship of metabolic syndrome with pulse pressure in patients with essential hypertension. Am J Hypertens. 2007;20:197–203. doi:10.1016/j.amjhyper.2006.07.016
- Protogerou AD, Blacher J, Mavrikakis M, Lekakis J, Safar ME. Increased pulse pressure amplification in treated hypertensive subjects with metabolic syndrome. Am J Hypertens. 2007;20:127–133. doi:10.1016/j.amjhyper.2006.06.014
- Hu G, Barengo NC, Tuomilehto J, Lakka TA, Nissinen A, Jousilahti P. Relationship of physical activity and body mass index to the risk of hypertension: a prospective study in Finland. Hypertension. 2004;43:25–30. doi:10.1161/01.HYP.0000107400.72456.19
- Kawai VK, Nwosu SK, Kurnik D, Harrell FE, Stein CM. Variants in BMI-associated genes and adrenergic genes are not associated with gestational weight trajectory. Obesity. 2019;27:1184–1189. doi:10.1002/oby.22505
- Hwang S, Cho YS, Kang NL. Association between body mass index and fitness in Korean adults according to the lump mean value and Gaussian fitting. Med Hypotheses. 2020;135:109471. doi:10.1016/j.mehy.2019.109471
- Mokdad AH, Ford ES, Bowman BA, et al. Prevalence of obesity, diabetes, and obesity-related health risk factors, 2001. JAMA. 2003;289:76–79. doi:10.1001/jama.289.1.76
- Neter JE, Stam BE, Kok FJ, Grobbee DE, Geleijnse JM. Influence of weight reduction on blood pressure: a meta-analysis of randomized controlled trials. Hypertension. 2003;42:878–884. doi:10.1161/01.HYP.0000094221.86888.AE
- Shuger SL, Sui X, Church TS, Meriwether RA, Blair SN. Body mass index as a predictor of hypertension incidence among initially healthy normotensive women. Am J Hypertens. 2008;21:613–619. doi:10.1038/ajh.2008.169
- Rahmouni K. Obesity-associated hypertension: recent progress in deciphering the pathogenesis. Hypertension. 2014;64:215–221. doi:10.1161/HYPERTENSIONAHA.114.00920
- Linderman GC, Lu J, Lu Y, et al. Association of body mass index with blood pressure among 1.7 million Chinese adults. JAMA Network Open. 2018;1:e181271. doi:10.1001/jamanetworkopen.2018.1271
- Taylor RW, Keil D, Gold EJ, Goulding A. Body mass index, waist circumference girth, and waist-to hip circumference ratio as indexes of total and regional adiposity in women: evaluation using receiver operating characteristic curve. Am J Clin Nutr. 1998;67:44–49. doi:10.1093/ajcn/67.1.44
- Zhu S, Wang Z, Heshka S, Heo M, Faith MS, Heymsfield SB. Waist circumference and obesity-associated risk factors among whites in the third National Health and Nutrition Examination Survey: clinical action thresholds. Am J Clin Nutr. 2002;76:743–749. doi:10.1093/ajcn/76.4.743
- Hsieh SD, Yoshinaga H, Muto T. Waist-to-height ratio, a simple and practical index for assessing central fat distribution and metabolic risk in Japanese men and women. Int J Obes Relat Metab Disord. 2003;27:610–616. doi:10.1038/sj.ijo.0802259
- Ashwell M, Gunn P, Gibson S. Waist-to-height ratio is a better screening tool than waist circumference and BMI for adult cardiometabolic risk factors: systematic review and meta-analysis. Obes Rev. 2012;13:275–286. doi:10.1111/j.1467-789X.2011.00952.x
- Shen S, Lu Y, Qi H, et al. Waist-to-height ratio is an effective indicator for comprehensive cardiovascular health. Sci Rep. 2017;7:43046. doi:10.1038/srep43046
- Nevill AM, Duncan MJ, Lahart IM, Scandercock GR. Scaling waist girth for differences in body size reveals a new improved index associated with cardiometabolic risk. Scand J Med Sci Sport. 2017;27:1470–1476. doi:10.1111/sms.12780
- Vasquez F, Correa-Burrows P, Blanco E, Gahagan S, Burrows R. A waist-to-height ratio of 0.54 is a good predictor of metabolic syndrome in 16-year-old male and female adolescents. Pedia Res. 2019;85:269–274. doi:10.1038/s41390-018-0257-8
- Carr DB, Utzschneider KM, Hull RL, et al. Intra-abdominal fat is a major determinant of the national cholesterol education program adult treatment panel III criteria for the metabolic syndrome. Diabetes. 2004;53:2087–2094. doi:10.2337/diabetes.53.8.2087
- Czernichow S, Kengne AP, Stamatakis E, Hamer M, Batty GD. Body mass index, waist circumference and waist-hip ratio: which is the better discriminator of cardiovascular disease mortality risk? Evidence from an individual-participant meta-analysis of 82 864 participants from nine cohort studies. Obes Rev. 2011;12:680–687. doi:10.1111/j.1467-789X.2011.00879.x
- Lee SC, Hairi NN, Moy FM. Metabolic syndrome among non-obese adults in the teaching profession in Melaka, Malaysia. J Epidemiol. 2017;27:130–134. doi:10.1016/j.je.2016.10.006
- Thaikruea L, Thammasarot J. Prevalence of normal weight central obesity among Thai healthcare providers and their association with CVD risk: a cross-sectional study. Sci Rep. 2016;6:37100. doi:10.1038/srep37100
- Després JP, Lemieux I. Abdominal obesity and metabolic syndrome. Nature. 2006;444:881–887. doi:10.1038/nature05488
- Coutinho T, Goel K, Corrêa de Sá D, et al. Combining body mass index with measures of central obesity in the assessment of mortality in subjects with coronary disease: role of “normal weight central obesity”. J Am Coll Cardiol. 2013;61:553–560. doi:10.1016/j.jacc.2012.10.035
- Ghandehari H, Le V, Kamal-Bahl S, Bassin SL, Wong ND. Abdominal obesity and the spectrum of global cardiometabolic risks in US adults. Int J Obes. 2009;33:239–248. doi:10.1038/ijo.2008.252
- Seo DC, Choe S, Torabi MR. Is waist circumference ≥102/88cm better than body mass index ≥30 to predict hypertension and diabetes development regardless of gender, age group, and race/ethnicity? Meta-analysis. Prev Med. 2017;97:100–108. doi:10.1016/j.ypmed.2017.01.012
- Lee CM, Huxley RR, Wildman RP, Woodward M. Indices of abdominal obesity are better discriminators of cardiovascular risk factors than BMI: a meta-analysis. J Clin Epidemiol. 2008;61:646–653. doi:10.1016/j.jclinepi.2007.08.012
- Li C, Ford ES, McGuire LC, Mokdad AH. Increasing trends in waist circumference and abdominal obesity among US adults. Obesity. 2007;15:216–224. doi:10.1038/oby.2007.505
- Park J, Lee ES, Lee DY, et al. Waist circumference as a marker of obesity is more predictive of coronary artery calcification than body mass index in apparently healthy Korean adults: the Kangbuk Samsung Health Study. Endocrinol Metab. 2016;31:559–566. doi:10.3803/EnM.2016.31.4.559
- Seidell JC. Waist circumference and waist/hip ratio in relation to all-cause mortality, cancer and sleep apnea. Eur J Clin Nutr. 2010;64:35–41. doi:10.1038/ejcn.2009.71
- Langenberg C, Shipley MJ, Batty GD, Marmot MG. Adult socioeconomic position and the association between height and coronary heart disease mortality: findings from 33 years of follow-up in the Whitehall Study. Am J Public Health. 2005;95:628–632. doi:10.2105/2004.046219
- Petursson H, Sigurdsson JA, Bengtsson C, Nilson TIL, Getz L. Body configuration as a predictor of mortality: comparison of five anthropometric measures in a 12 year follow-up of the Norwegian HUNT 2 study. PLoS One. 2011;6:e26621. doi:10.1371/journal.pone.0026621
- Stergiopulos N, Westerhof BE, Westerhof N. Total arterial inertance as the fourth element of the windkessel model. Am J Physiol. 1999;276:H81–H88. doi:10.1152/ajpheart.1999.276.1.H81
- Segers P, Rietzsxhel ER, De Buyzere ML, et al. Three- and four-element Windkessel models: assessment of their fitting performance in a large cohort of healthy middle-aged individuals. Proc Inst Mech Eng H. 2008;222:417–428. doi:10.1243/09544119JEIM287
- Westerhof N, Lankhaar JW, Westerhof BE. The arterial Windkessel. Med Biol Eng Comput. 2009;47:131–141. doi:10.1007/s11517-008-0359-2
- Benetos A, Safar M, Rudnichi A, et al. Pulse pressure: a predictor of long-term catdiovascular mortality in a French male population. Hypertension. 1997;30:1410–1415. doi:10.1161/01.HYP.30.6.1410
- Mitchell GF, Moye LA, Braunwald E, et al. Sphygmomanometrically determined pulse pressure is a powerful independent predictor of recurrent events after myocardial infarction in patients with impaired left ventricular function SAVE investigators. Survival and ventricular enlargement. Circulation. 1997;96:4254–4260. doi:10.1161/01.CIR.96.12.4254
- Nichols WV, O’Rourke MF. McDonald’s Blood Flow in Arteries: Theoretic, Experimental, and Clinical Principles. 3rd ed. London, UK: E. Arnold; 2005.
- Kelly R, Tunin R, Kass D. Effect of reduced aortic compliance on left ventricular contractile function and energetics in vivo. Circ Res. 1992;71:490–502. doi:10.1161/01.RES.71.3.490
- Zahedi E, Chellappan K, Ali MAM, Singh H. Analysis of the effect of ageing on rising edge characteristics of the photoplethysmogram using a modified Windkessel model. Cardiovasc Eng. 2007;7:172–181. doi:10.1007/s10558-007-9037-5