
Abstract
Background
The reports of ultrasound evaluation of lower limb veins are difficult to understand by general practitioners (GPs) and physicians who are not specialized. We developed software for a three-dimensional (3D) electronic report of venous hemodynamic mapping (MEVeC®) in order to represent lower limb venous vasculature in a 3D way. The aim of the study is to compare the novel 3D report with the standard report.
Methods
Thirty subjects (medical students and GPs) evaluated a standard report and a novel 3D report of the lower limb veins of a prespecified patient. The cases were randomly and blindly taken from an archive of 100 cases. GPs and students answered a questionnaire made up of 13 questions that were structured in order to investigate the readability and comprehension of the two reports. A score ranging from 0 to 10 (0= not understandable; 10= full comprehension) was attributed to each report for each question according to the readability of the venous scheme proposed.
Results
The scores from each question of the questionnaire were compared. The 3D report (MEVeC®) obtained higher scores than those from the evaluation of the standard report (P<0.0001). Each question revealed the superiority of the 3D report (MEVeC®) as compared with the standard report of the ultrasound evaluation of lower limbs. When dividing the scores according to percentiles, the 3D report (MEVeC®) still continued to show more readability than the standard report in a statistically significant way (P<0.0001).
Conclusion
The new 3D report (MEVeC®) concerning ultrasound evaluation of lower limb veins is more reproducible than the standard report when evaluated by medical physicians not specialized in the evaluation of the vein tree of lower limbs.
Introduction
Chronic venous diseases are pathologies able to deeply and negatively influence the quality of life of the patients due to the effects that venous hemodynamic impairment in the lower limb vasculature induce in these individuals: eg, impaired wound healing and ulcer formation; venous thrombi formation and related embolic events; chronic calf, ankle, and foot swelling; and leg ache.Citation1 In Western countries the prevalence of chronic venous diseases ranges from 27% to 55% in the general population, with an annual incidence equal to 2.6% in women and 1.9% in men.Citation2–Citation4 The large number of patients suffering from such a disease makes diagnosis a fundamental step in the general management of the pathology. By refining diagnosis techniques, physicians are able to depict more precisely the morphological venous alterations in order to better understand the venous hemodynamics altered by the veins’ impairment, and to adopt targeted surgical and pharmacological interventions able to guarantee long-term success in terms of improvements in quality of life and disease progression.Citation1,Citation2
Echo color Doppler (ECD) allows physicians to easily detect abnormalities in lower limb veins in terms of morphological and functional impairments. Thus, ECD has become the gold standard method to evaluate the lower limb venous system, reaching sensitivity and specificity as high as 96% and 99%, respectively, as compared with invasive phlebography assessment.Citation5,Citation6 In order to reach a better understanding of the complex abnormalities in lower limb veins’ structures, accurate graphic representations of the deep and superficial venous systems of the lower limbs, were realized.Citation7,Citation8 This generated the era of venous mapping of venous lower limb vasculature. A further simplification of such an evaluation came from our previous work, which validated the development of a new and faster method for evaluation of the venous vasculature of lower limbs, in order to obtain more easily standardized venous mapping.Citation9 Nevertheless, one of the major limitations of such an approach is the difficulties in the interpretation and readability of the venous maps for nonspecialized physicians. In order to overcome such difficulties, a three-dimensional (3D) approach was proposed. Leotta et alCitation10 first tried to propose a 3D evaluation of lower limb veins. They used complex computational analyses of peripheral vein grafts of the lower limbs in order to obtain a full image of them. Nevertheless, after their first attempt, no others have been performed until now. Our group produced a 3D ECD report (3D report) able to give a full visualization of the deep and superficial venous mapping of lower limbs. Dedicated software (MEVeC®; Health Department, Tecnopolis, Science and Technology Park, University of Bari, Bari, Italy) is able to give a 3D report that makes comprehension of the venous vasculature of the lower limbs and its alterations in morphology and hemodynamics easier for nonexpert physicians.
The aim of our study is to compare a 3D report (MEVeC®) with the standard report in order to demonstrate the superiority of the former over the latter. Furthermore, we tried to demonstrate the easy comprehension of a 3D report over the standard report for general practitioners (GPs) and medical students.
Materials and methods
The study protocol was approved by the local ethics committee and was in agreement with the Helsinki Declaration. Informed consent was obtained from the patients and from the enrolled subjects.
One hundred cases of lower chronic vein disease were considered. The cases came from 100 consecutive patients attending the Angiology Ambulatory, Section of Cardiovascular Diseases, Department of Emergency and Organ Transplantation (DETO), University of Bari, Bari, Italy, due to chronic vein diseases of lower limbs. Due to the consecutive enrollment, we considered patients suffering from venous insufficiency and venous thrombosis, and some of the final population sample showed no vein alterations.
All subjects underwent Doppler ultrasound evaluation of deep and superficial veins of lower limbs.
A total of 30 subjects among GPs and medical students of the University of Bari, School of Medicine, Bari, Italy, were further enrolled in order to evaluate the 3D report (MEVeC®) and standard venous mapping, by means of a dedicated questionnaire. To the best of our knowledge, the 3D software (MEVeC®) is unique in its form. It was registered and patented in order to provide official affiliation to our research group.
Ultrasound evaluation of lower limbs
One hundred patients underwent Doppler ultrasound evaluation of deep and superficial veins of lower limbs. In order to reduce bias, a single expert physician performed all the evaluations by means of a multifrequency 7.5–10 MHz Doppler ultrasound probe (Sonos 1500B; Hewlett Packard, Palo Alto, CA, USA). The ultrasound examinations were performed in a warm room (mean temperature 18°C–22°C) in agreement with our previously standardized ECD protocol.Citation9 In particular, the patients were examined in a standing position in order to detect venous morphology, the presence of venous reflux, or vein thrombosis. The limbs were subdivided into four topographical sections: 1) from the midpoint of the thigh to the inguinal ligament, 2) from the kneecap to the midpoint of the thigh, 3) from the midpoint of the calf to the kneecap, and 4) from the heel to the midpoint of the leg. The deep and superficial veins of each section were investigated.Citation9
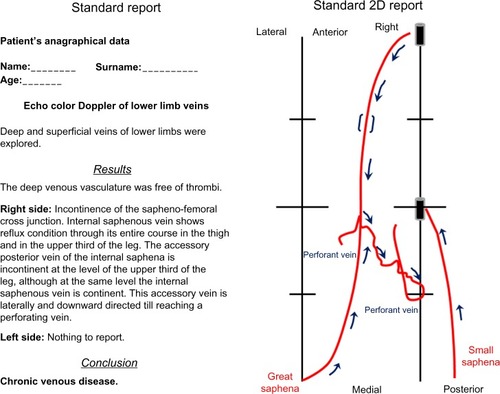
All data from ECD were firstly reported on a two-dimensional (2D) scheme representation where physicians can depict the venous anatomy and the main alterations in hemodynamics of lower limb veins. This constitutes the standard 2D report adopted in order to describe the morphofunctional situation of lower limb veins (, right side). This standard 2D report was linked to the standard report that reported on paper the narrative expression of the ultrasound evaluation (, left side).
Figure 1 Comparative representation of the standard report on paper (scheme on the left) and a two-dimensional (2D) report (scheme on the right).
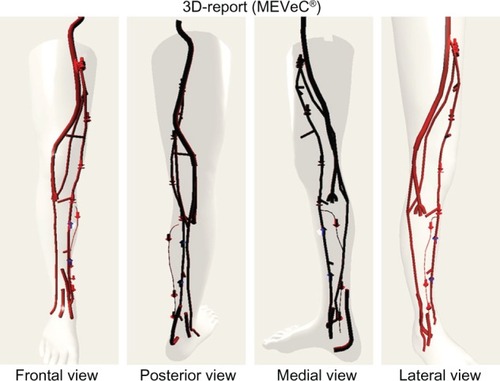
We managed a further, novel 3D report for each patient evaluated. We created dedicated 3D electronic report software (venous hemodynamic mapping [MEVeC®]). This software allows physicians to create a 3D image of deep and superficial lower limb vasculature, to introduce all the symbols able to detect morphological and functional impairment of the veins and the collateral course, and to rotate and zoom the image (). The frontal, posterior, medial, and lateral views of the entire 3D map belonging to a patient are represented in .
Figure 2 Frontal, posterior, medial, and lateral view of the three-dimensional (3D) report (MEVeC®; Health Department, Tecnopolis, Science and Technology Park, University of Bari, Bari, Italy). The arrows directed downward express the presence of a venous reflux. The upward arrows indicate the continence of the veins. The interactions between deep and superficial veins are clearly expressed.
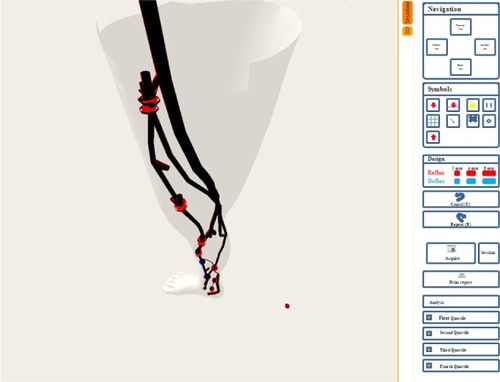
represents the screen that appears when performing the 3D evaluation. On the right side of the screen, physicians can find the navigation buttons, which allow rotation of the image. Furthermore, the “Symbols” zone includes buttons able to make the symbols appear in the 3D image. Each symbol represents peculiar hemodynamic and/or anatomic venous alterations, such as the presence of reflux, the presence of a thrombus, and the absence of a vein due to previous interventions on the venous vasculature. The “Design” section allows evaluation of the reflux times and the ability to insert them into the final report.
Figure 3 The visual screen example appearing when performing a three-dimensional evaluation.
The questionnaire
The 30 enrolled subjects (GPs and medical students) were asked to compare the standard report and the 3D report. The comparison was undertaken by means of a dedicated questionnaire, which was administered by a physician who was obliged not to give any help or to influence the answers.
We tried, not only to obtain a declaration of clarity of the new method as compared with the standard 2D report, but also to determine whether the studies were correctly interpreted, in order to have a complete evaluation of the advantages of the new 3D map.
An example of the adopted questionnaire is represented in . The questionnaire was made up of 13 questions all related to the standard report and the 3D report representations. Each question explored a particular aspect of the venous mapping. Under each question there was a table reporting the names of the two reports. The enrolled 30 subjects were asked to give a score from 0 (not understandable or comprehensible) to 10 (completely clear and comprehensible) for the MEVeC® report and the standard report.
Figure 4 The questionnaire adopted to compare a standard report and a three-dimensional MEVeC® (Health Department, Tecnopolis, Science and Technology Park, University of Bari, Bari, Italy) report.

Statistical analysis
The continuous variables were expressed as mean ± standard deviation. We used the Wilcoxon signed-rank test, which is a nonparametric statistical hypothesis test able to compare two related, matched samples or repeated measurements on a single sample in order to assess whether mean values from the population differ (ie, it is a paired difference test). P<0.05 was considered statistically significant.
Results
identifies the comparisons between the 3D electronic report (MEVeC®) and the standard report according to questionnaire answers. The answers to each question and the relative scores for each kind of report are gathered and compared in this table.
Table 1 Comparison between a three-dimensional (3D) electronic report (MEVeC®) and a standard report, according to questionnaire answersTable Footnotea
The 3D electronic report (MEVeC®) was more comprehensible than the standard report. The mean values of the scores showed higher statistically significant ratings for the MEVeC® report than for the standard report (P<0.0001). By analyzing each question’s answer, it was clear that the standard report reached a nonsatisfactory level of comprehension for GPs and medical students, as demonstrated by an overall mean score <7 for all the questions. On the contrary, the 3D report (MEVeC®) reported a score ≥9: ie, a score revealing a great degree of comprehension of the ultrasound evaluation of lower limb vein morphology and function. In particular, question 1, which reported the global judgment about the readability and comprehension of each kind of report, pointed out the net difference between the two reports (standard report: 6.50±0.90 versus 3D report [MEVeC®]: 9.80±0.48, P<0.0001) ().
evaluates the percentile distribution of the answers for each report and for each question. Once more, the score from all questions and among all the percentiles considered revealed the superiority of the 3D report (MEVeC®) over the standard report (P<0.0001 for all questions and among the different groups of percentiles). When considering once again the first question comparing the entire comprehension and readability of the two reports, we observed a really poor understanding of the standard report as compared with the 3D report (MEVeC®). In fact, the 3D report (MEVeC®) reached a full score (equal to 10) in all the percentile groups.
Table 2 Percentile distribution of the scores from the questionnaire dealing with a comparison between a three-dimensional electronic report (MEVeC®) and a standard report
Discussion
The aim of this study was to compare a new 3D report (MEVeC®) for the evaluation of lower limb venous vasculature with the well-established standard report of the classic venous hemodynamic mapping of the venous vessels of the lower limbs.
It is well established that chronic venous disease is a pathological condition widespread in Western countries.Citation2–Citation4 In parallel, one of the major problems related to these kinds of diseases is the great difficulty in obtaining, firstly, a standardized evaluation and, secondly, a really comprehensible and understandable evaluation.Citation11 Hertzberg et alCitation12 found a correlation between the subjective vein size evaluation from an experienced ultrasonographer and the measurements from objective measurements of vein diameters. Nevertheless, although these data were ascertained for experienced ultrasonographers, their reproducibility among GPs and medical students could be reduced due to their limited experience.
Interesting findings came from Haenen et al.Citation13 They tried to evaluate interobserver variability coefficients of common duplex ultrasound in patients previously diagnosed with deep venous thrombosis. They found an interobserver variability coefficient for compressibility equal to 0.77, whereas according to reflux it was calculated as equal to 0.86.Citation13 Such good results are in agreement with other previous papers,Citation14 and pointed out the need for the correct setting of ultrasound machines, in order to achieve better results in the definition of the images, and in their reproducibility.Citation15 Nevertheless, findings from Linkins et alCitation16 were not in agreement with previously cited papers. Linkins et alCitation16 effectively demonstrated that there was poor reproducibility in the examination of the lower limb veins between different operators. The authors evaluated residual vein diameter, venous flow, and echogenicity of of the lower limbs veins of patients suffering from deep vein thrombosis. Although the variability of intraobserver coefficient was good (r2=96%), and despite the experience of physicians in the ultrasound evaluation of venous diseases, there was a significant reduction in the same coefficient when applied to interobserver variability. In fact, it reached poor levels for all the evaluated veins’ characteristics: r2=12% for residual vein diameter, weighted kappa coefficient (Wn) =0.51 (95% confidence interval 0.24–0.78) for venous flow, and Wn =0.01 for echogenicity (95% confidence interval 0–0.03).Citation16
Similar limitations were found by Yamamoto et al,Citation17 who compared ultrasound evaluation of the lower limb veins with intraoperative evaluation and found a poor result for ultrasound in offering a reliable comparison with data from intraoperative evaluation of veins.
Thus, there is a real need for standardization in the evaluation of lower limb vasculature. Venous mapping has been considered a tool able to improve comprehension of venous vascular course, alterations in its morphology, and pathological changes in its function.Citation9,Citation18–Citation20 Venous mapping is a 2D scheme of the venous tree of lower limbs. The symbols and the overall representation give a frank account of the hemodynamics of the venous tree and allow expert physicians to follow-up chronic venous diseases and to target the appropriate surgical and/or therapeutic intervention.Citation9,Citation18–Citation20 Nevertheless, one of its limitations is the limited comprehension and readability of such a map. Only experts in angiology are experienced enough to understand the map, whereas GPs and/or medical students (ie, physicians not skilled in angiology) often remain unable to understand the vein vasculature and its alterations, after observing such a map.
Thus, new methods to promote a better approach to such a disease were developed, involving 3D imaging. Computational models tried to develop new perspectives in the evaluation of the venous system and its features.Citation21 First attempts were made by Leotta et al,Citation10 who developed a 3D ultrasound evaluation of peripheral vein grafts based on complex mathematical algorithms. Nevertheless, their map was not reliable and was confusing. Our 3D report (MEVeC®) overcame the limitations of the previous 3D mapping of lower limb venous vasculature. In particular, our results demonstrated that the 3D software generated a venous map that was more comprehensive and reliable than the standard report. To the best of our knowledge, this is the first approved 3D map for lower limb venous vasculature. No study has ever evaluated a 3D report of venous ECD of the lower limbs and, above all, its practical use in general medicine.
Our results demonstrated the superiority of the new 3D report over the standard report. When evaluated by GPs and medical students, the 3D report (MEVeC®) was more understandable than the standard protocol. Even the percentile comparisons continued to reveal the superiority and clarity of the 3D report (MEVeC®) over the classic hemodynamic maps.
Thus, the software may soon enter clinical practice in order to assist physicians in venous ECD of lower limb reporting. In particular, vascular ultrasound experts have a tool able to give a full 3D picture of both the hemodynamics and the morphology of the veins in the lower limbs. They can easily follow the course of the veins and their abnormalities through the limbs, because the 3D map is more clear than the 2D one. Naturally, more studies are needed in order to define the advantages of 3D maps over 2D ones. Nevertheless, the 3D report (MEVeC®) can be useful for GPs in their clinical practice. They can immediately have an overview of the lower venous limb vasculature of their patients, thus defining the exact alteration of this structure and therefore improving the knowledge of their patients’ venous disease. This increased understanding about vascular alterations will increase the compliance of the patients toward the therapies and toward the advise of the physicians, and this will surely improve the quality of life of such individuals.
Also, the software could be used as a simplified tool to enable students to better learn the characteristics of the venous system of the lower limbs and its pathological degeneration. The student will be able to easily understand the course of the veins and the diseases that could affect such a vascular area. Further studies are needed in order to validate 3D reports (MEVeC®) in larger cohorts and different settings.
Disclosure
The authors report no conflicts of interest in this work.
References
- PriolletPFranceschiCLazarethILaurianCStudy and treatment of varicose veins. Truths and counter-truthsAnn Cardiol Angeiol (Paris)19944352752778074422
- WhiteJVRyjewskiCChronic venous insufficiencyPerspect Vasc Surg Endovasc Ther200517431932716389426
- RobertsonLEvansCFowkesFGREpidemiology of chronic venous diseasePhlebology20082310311118467617
- ChiesaRMaroneEMLimoniCVolontéMSchaeferEPetriniODemographic factors and their relationship with the presence of CVI signs in Italy: the 24-cities cohort studyEur J Vasc Endovasc Surg200530667468016055355
- BakerSRBurnandKGSommervilleKMThomasMLWilsonNMBrowseNLComparison of venous reflux assessed by duplex scanning and descending phlebography in chronic venous diseaseLancet199334188424004038094169
- EichlisbergerRFrauchigerBJägerKAssessment of the leg veins using duplex ultrasonographyTher Umsch199148106977071780799
- WongJKDuncanJLNicholsDMWhole-leg duplex mapping for varicose veins: observations on patterns of reflux in recurrent and primary legs, with clinical correlationEur J Vasc Endovasc Surg200325326727512623340
- CinaAPedicelliADi StasiCColor-Doppler sonography in chronic venous insufficiency: what the radiologist should knowCurr Probl Diagn Radiol2005342515615753879
- GaleandroAIQuistelliGScicchitanoPDoppler ultrasound venous mapping of the lower limbsVasc Health Risk Manag20128596422371652
- LeottaDFPrimozichJFBeachKWBergelinROStrandnessDESerial measurement of cross-sectional area in peripheral vein grafts using three-dimensional ultrasoundUltrasound Med Biol2001271616811295271
- Di NardoEColamussiGPitrelliNLeporeRBongarzoniGClassification of varices with Doppler ultrasonography mapping. Clinical and hemodynamic correlationMinerva Chir1998537–86156189793350
- HertzbergBSKliewerMADeLongDMLaloucheKJPaulsonEKCarrollBASonographic estimates of vein size in the lower extremities: subjective assessment compared with direct measurementJ Clin Ultrasound19982631131179502032
- HaenenJHvan LangenHJanssenMCVenous duplex scanning of the leg: range, variability and reproducibilityClin Sci (Lond)199996327127710029563
- AsbeutahAMRihaAZCameronJDMcGrathBPReproducibility of duplex ultrasonography and air plethysmography used for the evaluation of chronic venous insufficiencyJ Ultrasound Med200524447548215784766
- OgawaTLurieFKistnerRLEklofBTabrahFLReproducibility of ultrasound scan in the assessment of volume flow in the veins of the lower extremitiesJ Vasc Surg200235352753111877703
- LinkinsLAStrettonRProbynLKearonCInterobserver agreement on ultrasound measurements of residual vein diameter, thrombus echogenicity and Doppler venous flow in patients with previous venous thrombosisThromb Res2006117324124716378830
- YamamotoNUnnoNMitsuokaHPreoperative and intraoperative evaluation of diameter-reflux relationship of calf perforating veins in patients with primary varicose veinJ Vasc Surg20023661225123012469055
- ÖzgürOAlimoğluEÇekenKApaydinASindelHTChronic venous insufficiency patterns in lower extremity veins detected by Doppler ultrasoundDicle Medical Journal2013404543548
- García-GimenoMRodríguez-CamareroSTagarro-VillalbaSDuplex mapping of 2036 primary varicose veinsJ Vasc Surg200949368168919268773
- HoballahJJCorryDCRossleyNChalmersRTSharpWJDuplex saphenous vein mapping: venous occlusion and dependent position facilitate imagingVasc Endovascular Surg200236537738012244426
- ZervidesCGiannoukasADComputational phlebology: reviewing computer models of the venous systemPhlebology201328420921823479775